PROF. DR. WOLFGANG HERR DER FAKULTÄT FÜR MEDIZIN DER UNIVERSITÄT REGENSBURG
Impact of an anti-metabolic therapy on leukemic and non-malignant
T cells
Inaugural – Dissertation zur Erlangung des Doktorgrades
der Medizin
der
Fakultät für Medizin der Universität Regensburg
vorgelegt von
Matthias Fante
2017
Dekan: Prof. Dr. Dr. Torsten E. Reichert 1. Berichterstatter: Prof. Dr. Marina Kreutz
2. Berichterstatter: PD Dr. Stephan Schreml Tag der mündlichen Prüfung: 21. September 2017
Für meine Eltern.
I
Index
Index of figures ... IV Index of tables ... VI
1. Introduction ... 1
1.1 Tumor cells ... 1
1.1.1 Characteristics of a tumor cell ... 1
1.1.2 Tumor cell metabolism ... 2
1.1.3 Regulation of tumor cell metabolism ... 6
1.1.4 Inhibition of tumor glucose metabolism – a promising therapeutic strategy? ... 9
1.2 Activation, effector function and metabolism of human T lymphocytes ... 13
1.2.1 Activation of T lymphocytes ... 13
1.2.2 Effector functions of activated T cells ... 16
1.2.3 Metabolism of T lymphocytes ... 18
2. Research objectives ... 22
3. Material and methods ... 23
3.1 Material ... 23
3.1.1 Devices ... 23
3.1.2 Pipettes, plates, flasks, tubes ... 23
3.1.3 Medium, buffers, solutions ... 24
3.1.4 Cell separation... 25
3.1.5 Apoptosis staining ... 25
3.1.6 Antibodies and isotypes ... 26
3.1.7 Kits, cytokines... 26
3.2 Methods ... 27
3.2.1 Tumor cell line cultivation ... 27
3.2.2 T cell isolation, stimulation and cultivation ... 27
3.2.3 Mixed leukocyte reaction (MLR) ... 30
3.2.4 Determination of cell number and cell size ... 30
II
3.2.5 Measurement of glucose consumption and lactate secretion ... 30
3.2.6 Determination of cytokines ... 31
3.2.7 Flow cytometry ... 31
3.2.8 Restriction of glycolysis ... 33
3.3 Statistics ... 33
4. Results ... 34
4.1 Impact of glycolytic inhibition on leukemic T-ALL cells ... 34
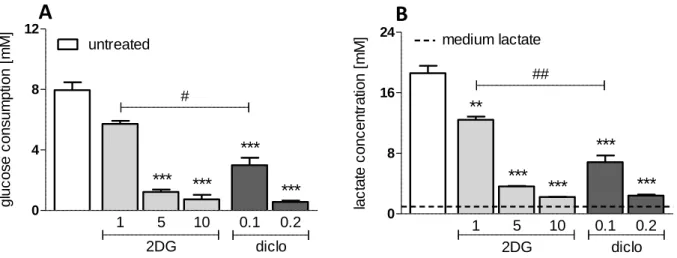
4.1.1 Impact on glucose consumption and lactate production ... 34
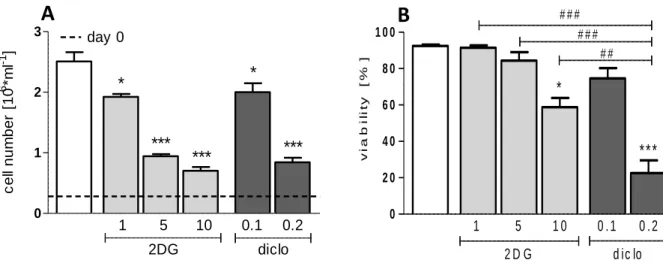
4.1.2 Impact on proliferation and viability ... 35
4.2 Characterization of primary human T cells ... 37
4.2.1 Characterization of stimulated human CD4+ T cells ... 37
4.2.2 Characterization of stimulated human CD8+ T cells ... 40
4.2.3 Comparison between metabolic activity in CD4+ and CD8+ T cells ... 42
4.3 Impact of anti-metabolic drugs on human T cells ... 44
4.3.1 Impact on quiescent human T cells ... 44
4.3.2 Impact on stimulated human T cells ... 44
4.3.3 Impact on restimulated human T cells ... 53
4.3.4 Impact of continuous diclofenac exposure ... 58
4.3.5 Impact on a mixed leukocyte reaction (MLR) ... 60
5. Discussion ... 63
5.1 Metabolic features of malignant and primary human T cells ... 63
5.2. Impact of an antiglycolytic treatment on leukemic versus primary T cells ... 65
5.3 Outlook: Glycolytic inhibition complements immunotherapeutic approaches .. 70
6. Conclusion ... 72
7. References ... 73
8. Appendix ... 90
8.1 German abstract ... 90
8.2 Abbreviations ... 93
III
8.3 Publication ... 97 8.4 Acknowledgement ... 98 8.5 Declaration ... 99
IV
Index of figures
Figure 1. Glucose and glutamine metabolism of neoplastic cells ... 5
Figure 2. Targets and appropriate anti-metabolic compounds already used in treatment of tumors ... 12
Figure 3. Metabolic re-programming during T cell activation ... 21
Figure 4. Purity of freshly isolated example donor CD4+ and CD8+ T cells ... 28
Figure 5. Schedule of T cell cultivation and time points of measurements ... 29
Figure 6. Impact of 2-deoxyglucose and diclofenac on glucose metabolism of C7H2 cells ... 35
Figure 7. Impact of 2-deoxyglucose and diclofenac on cell number and viability of C7H2 cells ... 36
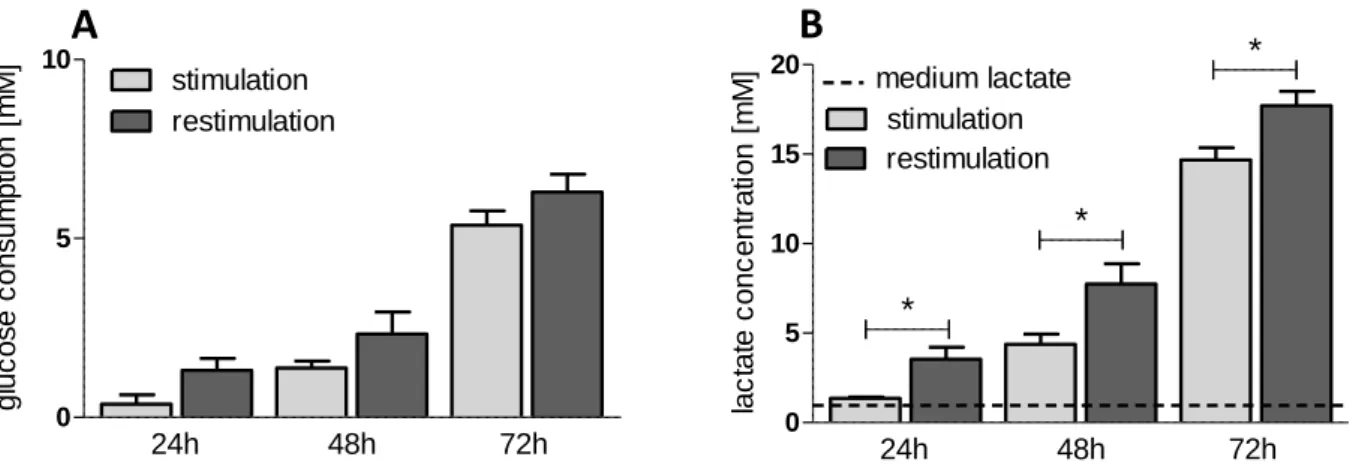
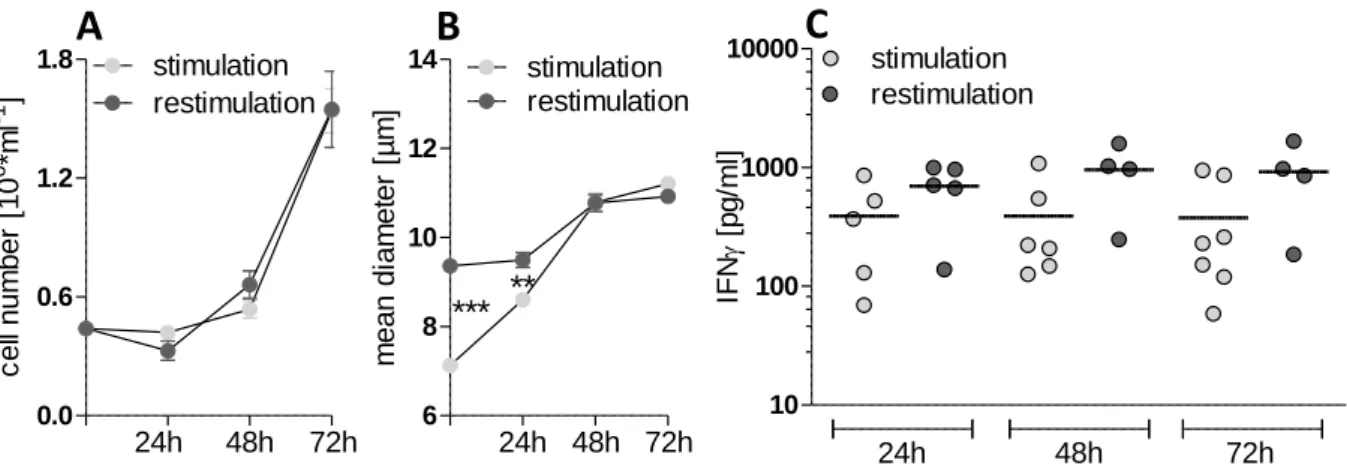
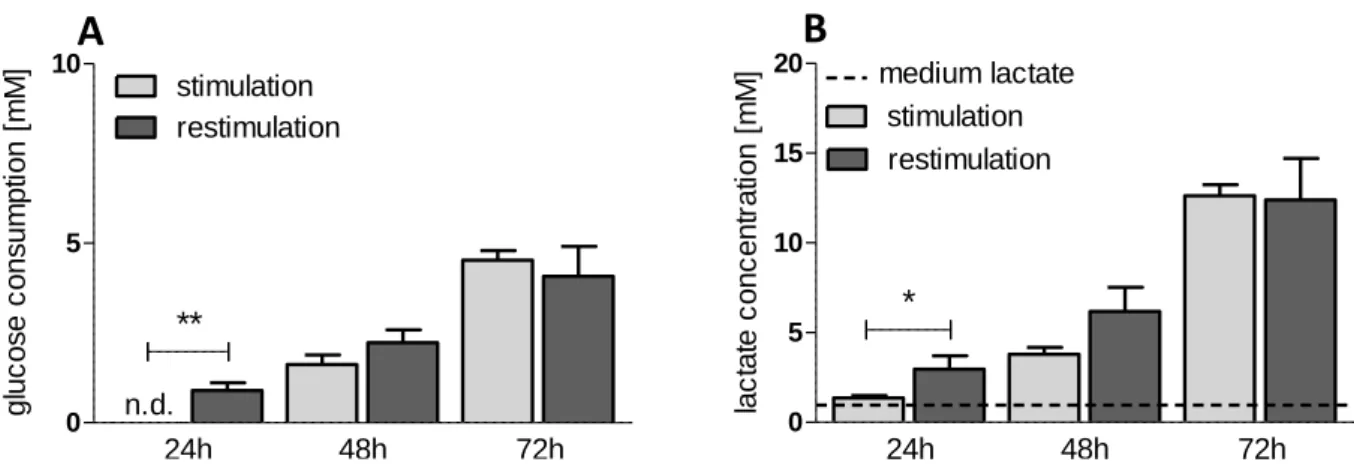
Figure 8. Metabolic characterization of human stimulated and restimulated CD4+ T cells ... 38
Figure 9. Functional characterization of human stimulated and restimulated CD4+ T cells ... 39
Figure 10. Metabolic characterization of human stimulated and restimulated CD8+ T cells ... 40
Figure 11. Functional characterization of human stimulated and restimulated CD8+ T cells ... 42
Figure 12. Impact of 2DG and diclofenac on glucose metabolism of stimulated human CD4+ and CD8+ T lymphocytes ... 46
Figure 13. Impact of 2DG and diclofenac on proliferation and viability of stimulated human CD4+ and CD8+ T lymphocytes ... 49
Figure 14. Impact of 2DG and diclofenac on interferon ɣ and interleukin 2 secretion of stimulated human CD4+ and CD8+ T lymphocytes ... 50
Figure 15. Impact of 2DG and diclofenac on expression of surface markers CD137, CD25 and CD95 of stimulated human CD4+ and CD8+ T lymphocytes ... 52
Figure 16. Impact of 2DG and diclofenac on lactate secretion of restimulated human CD4+ and CD8+ T lymphocytes ... 54
Figure 17. Impact of 2DG and diclofenac on proliferation and viability of restimulated human CD4+ and CD8+ T lymphocytes ... 55
V
Figure 18. Impact of 2DG and diclofenac on interferon ɣ secretion of restimulated human CD4+ and CD8+ T lymphocytes ... 56 Figure 19. Impact of diclofenac on lactate concentration, proliferation, viability and interferon ɣ secretion of continuously treated human CD4+ and CD8+ T lymphocytes ... 59
VI
Index of tables
Table 1. Impact of 2DG and diclofenac on stimulated CD4+ and CD8+ T cells after 7 days ... 47 Table 2. Impact of 2DG and diclofenac on IL-10 secretion of CD4+ T cells after 48 hours ... 51 Table 3. Impact of 2DG and diclofenac on two times re-stimulated CD4+ and CD8+ T cells ... 57 Table 4. Impact of 2DG and diclofenac on CD4+ lymphocytes activated in a mixed leukocyte reaction (MLR) ... 61
1
1. Introduction
Tumor cells display and depend on increased metabolic activity to sustain proliferation. Among other pathways glycolysis is strongly elevated. Inhibition of this vital metabolic pathway is a fairly new approach and several anti-glycolytic drugs are currently under investigation in clinical trials (1, 2). However, beside tumor cells other organs and tissues also rely on glucose metabolism and the suppression of this pathway might result in adverse side effects. In particular, activated T lymphocytes show a similar metabolic phenotype compared to cancer cells. Thus, anti-glycolytic drugs might impede T cell function. As T cell infiltration and activation are important for the prognosis of tumor patients, preservation of T cell function is crucial (3). The link between glucose metabolism and T cell function has been mainly investigated in the murine system and data on the human system are rather sparse and contradictory. However, analyzing the importance of glucose metabolism and the impact of glycolytic inhibitors on human T cell function is a prerequisite for the development of treatment strategies selectively affecting tumor cells.
1.1 Tumor cells
1.1.1 Characteristics of a tumor cell
In 2000 Hanahan and Weinberg defined the main attributes of neoplastic cells – the well-known “Hallmarks of Cancer” (4).
The hallmarks include (i) a sustained proliferation and cell growth by increased receptor sensitivity, autocrine hormone secretion or constitutive pathway activation;
(ii) evasion of growth suppressors by loss of tumor suppressor genes such as retinoblastoma 1 (RB1) or tumor protein p53 (TP53) or corruption of the anti- proliferative effect of the transforming growth factor β (TGFβ); (iii) resistance to cell death via increase of anti-apoptotic (e.g. Bcl-2) and decrease of pro-apoptotic proteins (e.g. Bax, Bak); (iv) enabling of replicative immortality by the up-regulation of the enzyme telomerase, which elongates replication-limiting, telomeric DNA-endings;
(v) induction of angiogenesis to assure removal of waste products and supply with
2
essential nutrients and oxygen; (vi) activation of invasion and metastasis via down- regulation of adhesion molecules and genetic transition into migrating cells.
In 2011 two emerging hallmarks were added by the authors: evasion of immune destruction and re-programming of energy metabolism (5).
1.1.2 Tumor cell metabolism
In the 1920s Otto Warburg, a German scientist, reported increasing lactic acid concentrations in tumor cell cultures, resulting from accelerated glucose metabolism (6). This physiological process is well known from muscle cells switching from Krebs´
cycle (= tricarboxylic acid cycle; TCA cycle) derived energy production to glucose fermentation under oxygen limitation. Surprisingly, Warburg demonstrated, that tumor cells exhibited the same metabolic phenotype even in the presence of oxygen (=
Warburg effect, aerobic glycolysis). Nowadays, this feature is used in diagnosis to detect tumor cells by fluorodeoxyglucose traced positron emission tomography–
computed tomography (FDG-PET/CT) (7).
The highly glycolytic state is achieved by up-regulating the expression of enzymes linked to glycolysis. Hexokinase (HK), the first enzyme in the glycolytic pathway, and other glycolytic key enzyme such as phosphofructokinase (PFK) or lactate dehydrogenase (LDH) are elevated on transcriptional and protein level (8, 9). In a variety of tumors LDH-A is upregulated and its expression negatively correlates with patient survival (10). LDH-A degrades pyruvate to lactate thereby regenerating NAD+ which is necessary to maintain the glycolytic flux (11).
Besides an up-regulated expression, also an altered activity, reaction rate and substrate specificity of glycolytic enzymes is observed and tumor specific isoforms of different enzymes are detected as a result of alternative splicing processes after transcription. For example in normal cells HK is expressed as isoform HK-I. Tumor cells, however, express the isoform HK-II, which in contrast is not negatively regulated by its product glucose-6-phosphate thus ensuring a continued glycolytic flux. Furthermore, HK-II is bound to the outer mitochondrial membrane thus (i) enabling an immediate access to mitochondrially produced ATP and (ii) preventing the apoptosis inducing release of cytochrome c (11, 12). Non-transformed cells
3
express the M1 isoform of the pyruvate kinase (PKM1). However, almost every tumor cell expresses the subtype M2 (PKM2), which has intrinsically a lower enzymatic activity and is impeded by different kinases. Consequently, glycolytic intermediates accumulate and promote the anabolic metabolism by flux into downstream pathways such as the pentose phosphate pathway. In addition PKM2 is described as a co- factor for transcription (11, 13).
Furthermore, the expression of transporters linked to glucose metabolism is increased in tumor cells. To ensure high intracellular glucose concentrations, the amount of insulin-independent glucose transporters (GLUT) is elevated on transcriptional level but also by increased surface trafficking of cytosolic transporters (14, 15). The transport of glucose across the lipid membrane by GLUT is energy independent. Especially GLUT1, GLUT3 and GLUT4 show a high affinity to glucose and ensure a sufficient glucose flux into cancer cells even under low-glucose conditions (11, 16). Accordingly, overexpression of GLUT1 has been related to poor prognosis in tumor bearing patients (17). The expression of monocarboxylate transporters (MCT) is also up-regulated in a variety of tumors (18). MCTs belong to the solute carrier 16 (SLC16) family (19) and transport lactate across the plasma membrane in co-transport with a proton thereby maintaining the intracellular pH and cell homeostasis (20). Notably, the MCTs bidirectionally transport substrates depending on the intra- and extracellular concentration gradients of protons and substrates as lactate (21). The most common monocarboxylate transporters in cancer cells are MCT1 and MCT4: While MCT1 is found in many tissues and transports a wider range of substrates (e.g. lactate, benzoate, butyrate), MCT4 in contrast is mainly expressed in highly glycolytic cells such as tumor cells.
Accordingly, MCT4 exhibits higher Km values (MCT4: Km = 20 mM) compared to other members of the MCT family (MCT1: Km = 5 mM) enabling a sufficient export of lactate even under conditions of extensive production and preventing loss of pyruvate across the cell membrane (18, 22). Interestingly, MCT1 and MCT4 expression varies even within a tumor: while hypoxic areas preferentially express MCT4 to release lactate, normoxic regions take up and metabolize the monocarboxylate via MCT1 (23, 24). Furthermore, MCT surface expression is regulated by the matrix metalloproteinase inducer basignin (= CD147), which is required for the transport to
4
and insertion of MCTs into the cell membrane. Its activation in turn promotes matrix degradation, invasion and metastasis (25).
Initially, the Warburg phenotype was attributed to mitochondrial disorders, however even increased mitochondrial content and energy production have been observed in different tumors (26–28). Other reasons for the switch to glycolysis are currently discussed. Glycolysis yields only two molecules ATP from one molecule glucose compared to 36 molecules ATP gained by mitochondrial oxidative phosphorylation (OXPHOS). However, despite the lower yield of ATP, glycolysis is the most time- effective and least energy demanding process by which a cell can gain additional energy (29). When energy production is covered by glycolysis, the intermediates of the TCA cycle can be used for the generation of building blocks.
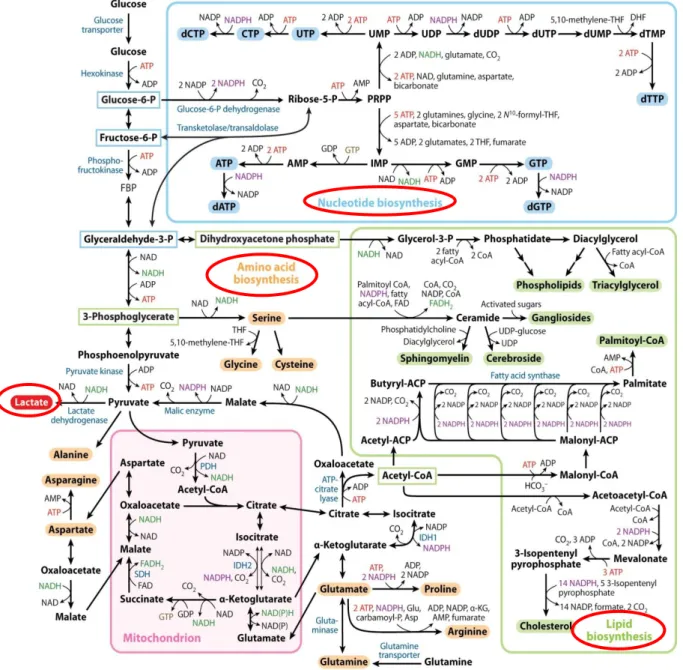
Thus accelerated glycolysis is necessary to accomplish the high energy demand of proliferating cells required for the production of biomass and to ensure DNA replication and cell division. Moreover, glycolytic intermediates are required for the generation of building blocks as shown in figure 1 (30).
The flux of glucose-6-phosphate to the pentose phosphate pathway (PPP) facilitates the synthesis of nucleotides (ATP, GTP, TTP, CTP) being essential for DNA replication and RNA transcription. Furthermore, NADP+ is reduced to NADPH, which is important for the replenishment of the antioxidant glutathione and serves as a reducing equivalent for lipid biosynthesis. Glyceraldehyde-3-phophate, 3- phosphoglycerate and acetyl-CoA are the carbon sources for lipid biosynthesis. In addition, 3-phosphoglycerate is essential for amino acid biosynthesis of glycine and cysteine via serine (30).
Additionally, proliferating cells utilize the amino acid glutamine as alternative carbon- and essential nitrogen-source. Moreover, the degradation products of glutaminolysis replenish the pool of mitochondrial intermediates (= anaplerosis) and thereby - replacing glucose - maintain mitochondrial energy production. Vice versa, substrates of the TCA cycle are transported to the cytosol (= cataplerosis) and serve as precursors of the amino acids proline and arginine. Moreover, the intermediates α- ketoglutarate (αKG) and citrate are converted into acetyl-CoA by cytosolic ATP- citrate lyase (ACL) and used as the main building block of cholesterol and other lipids (figure 1).
5
First described in solid tumors, these alterations in metabolism are also observed in leukemia and lymphoma cells (31, 32)
Figure 1. Glucose and glutamine metabolism of neoplastic cells
(modified after Lunt et. al, Annual review of cell and developmental biology, 2011 (30))
6 1.1.3 Regulation of tumor cell metabolism
As described above, the Warburg effect supports tumor growth and proliferation by providing essential building blocks and ATP. Mitogenic activation normally depends on the interaction of growth factors and their receptors. In cancer cells, however, pathways downstream of those receptors can be constitutively activated in the absence of extracellular stimuli by mutations, enhanced intrinsic activity or elimination of negative regulators. Moreover, it has been shown, that tumor suppressors and proto-oncogenes directly activate cell metabolism.
1.1.3.1 The PI3K/Akt/mTORC1 pathway
The PI3K/Akt/mTORC1 pathway is a complex signaling network and highly activated in many tumors (33). Phosphatidylinositol-3-kinase (PI3K), a lipid kinase, is activated by receptor protein tyrosine kinases (RPTK) and G protein coupled growth factor receptors like epidermal growth factor receptor (EGFR) or insulin-like growth factor receptor (IGFR). Upon activation PI3K phosphorylates phosphatidylinositol-2- phosphate (PIP2) to phosphatidylinositol-3-phosphate (PIP3). Proteins expressing pleckstrin homology domains (PH) such as 3-phosphoinositide dependent kinase 1 (PDK1) bind to PIP3 and activate the serine threonine kinase Akt by conformational change and phosphorylation. Conversely, phosphatase and tensin homolog (PTEN) dephosphorylates PIP3 to PIP2 and prevents overstimulation of Akt.
Akt is expressed in three different isoforms: Akt1, Akt2 and Akt3. All of them modulate numerous regulators of cell survival, cell cycle progression and metabolism on a transcriptional or post-translational level (34). By phosphorylation Akt increases the activity of the rate-limiting glycolytic enzyme HK (35). Moreover, the association of HK with the outer mitochondrial membrane (as described above) is promoted (36).
The stimulation of PFK2 results in an accumulation of the allosteric PFK1 activator fructose-2,6-bisphosphate thus indirectly enhancing glycolysis (37). Glucose uptake is supported by trafficking of intracellularly stored GLUT1 to the plasma membrane, even though underlying mechanisms have not yet been fully understood (38). In addition, Akt phosphorylates and therewith inactivates pro-apoptotic factors such as
7
Bad, procaspase-9 or transcriptional factors of the death ligand Fas (39, 40).
Importantly, Akt promotes the formation of the mammalian target of rapamycin complex 1 (mTORC1)(34). Besides the post-translational modulation also transcriptional effects are described: Akt and mTORC1 control the expression of almost all genes involved in glucose uptake (41) and glycolysis (42, 43) by the transcription factors HIF1α and c-Myc (see below). Akt activates the nuclear factor κB (NFκB) and the cyclic AMP response element-binding protein (CREB), both upregulating the expression of survival genes (44). Moreover, mTORC1 up-regulates the messenger RNA (mRNA) translation by the effector proteins S6 kinase 1 (S6K1) and the eukaryotic initiation factor 4E (eiF-4E)- binding protein 1 (4E-BP1) and accelerates the cellular turnover (45).
1.1.3.2 Hypoxia inducible factor 1α (HIF1α)
Different stimuli, such as Akt and mTORC1 activity, hypoxia or reactive oxygen species (ROS) inhibit the constant degradation of HIF1α by proteasomes.
Dimerization with the constitutively expressed HIF1β protein leads to the activation of the HIF-complex. Upon heterodimerization the complex acts as a transcription factor on hypoxia-responsive elements (HREs) itself, but also regulates further transcription factors. Target genes upregulate glucose metabolism, cell differentiation and metastasis: activated HIF up-regulates GLUTs, glycolytic enzymes e.g. hexokinase (9) as well as LDH-A and pyruvate dehydrogenase kinase 1 (PDK1). This in turn restricts the uptake of glucose-derived pyruvate by mitochondria and decreases cellular respiration (46). As Ullah et al. show, MCT4 but not MCT1 is increased by HIF1α expression (47). Additionally, the vascular endothelial growth factor (VEGF) is an important target gene of the HIF-complex. VEGF induces angiogenesis and improves oxygen and nutrient supply, but also facilitates hematogenous metastasis of tumor cells. Furthermore, the matrix metalloproteinases 2 and 9 (MMP2, MMP9) are up-regulated and cell adhesion molecules (such as E-cadherin) down-regulated (48), which supports metastasis. There is evidence, that HIF promotes the de- differentiation of cancer cells and prevents differentiation of progenitors (49, 50).
8 1.1.3.3 c-Myc amplification
Myc is a transcription factor, which regulates the expression of a variety of human genes upon dimerization with the protein Myc-associated factor x (Max). Myc is the product of the c-Myc gene (cellular myelocytomatosis gene) and amplification is caused either by an activating mutation, by oncogenes inducing gene expression or by a decreased protein degradation as a result of an inefficient ubiquitination (51).
Especially, the growth factor receptor-associated phosphorylation cascade Ras (rat sarcoma) – Raf (rat fibrosarcoma) – MEK (Mitogen/Extracellular signal-regulated kinase) – ERK (extracellular signal-regulated kinase) and the PI3K/Akt/mTOR pathway promote the induction of Myc expression (52). Amplified Myc results in the overexpression of glucose transporters and several glycolytic enzymes such as HK, PFK, LDH-A and PDK. Myc also initiates the alternative splicing of pyruvate kinase to PKM2 (53). Beyond that, Myc supports the upregulation of glutaminolysis by increasing the expression of amino-acid transporter 2 (ASCT2) and glutaminase (GLS), catalyzing the reaction of glutamine to glutamate (13, 52). As a consequence cells become glutamine dependent, which intriguingly leads to apoptosis in case of glutamine withdrawal in Myc overexpressing cells (54). Myc also stimulates ribosome biogenesis and increases nucleotide biosynthesis by expression of several PPP enzymes (52). Myc regulates cell cycle progression by increased transcription of cyclin dependent kinases (Cdks), cyclins or associated transcription factors like E2F and the antagonism of the cell cycle inhibitors p21Cip and p27Kip (55). Cyclins enable the transition of G1- (gap 1 phase) to S-phase (synthesis phase) in the cell cycle and support proliferation (56).
1.1.3.4 Loss of p53 expression
p53, also known as “the guardian of the genome”, is a tumor suppressor accumulating intracellularly as a consequence of DNA damages like strand brakes.
Thereupon, DNA repair systems are activated while cell cycle is arrested. Failure of DNA repair leads to increasing p53 levels and the induction of apoptosis by caspases (57). Moreover, p53 also affects cell metabolism by blocking glycolysis via the protein
9
TIGAR (TP53-induced glycolysis and apoptosis regulator), which impedes the enzymatic reaction of fructose-6-phosphate to fructose-2,6-bisphophate (58). On the other hand p53 enhances mitochondrial enzyme synthesis as cytochrome c oxidase 2 (SCO2) expression, which in turn increases oxidative phosphorylation (OXPHOS) (59, 60). A loss of function mutation in the p53 tumor suppressor gene promotes cell cycle and enhances glycolysis (8).
1.1.4 Inhibition of tumor glucose metabolism – a promising therapeutic strategy?
As tumor cells - in contrast to non-malignant cells – display a highly elevated glycolysis, inhibition of this metabolic pathway is an emerging therapeutic strategy.
Glycolytic restriction affects tumor cells in many ways: (i) reduced energy supply resulting in increased (chemo-/radio-) therapeutic sensitivity (61–63), (ii) growth inhibition due to lack of necessary building blocks and (iii) diminished extracellular lactate accumulation. There is growing evidence that lactic acid is not only the end product of aerobic glycolysis but also represents an alternative fuel for respiring tumor cells. Tumor-associated cells, such as fibroblasts, can also metabolize lactate instead of glucose, which prevents a competition for nutrients between tumor, tumor- associated and immune cells (23, 64). Furthermore, the acidic tumor milieu alters immune cell function and the extracellular matrix and promotes invasion and metastasis (65). Numerous studies showed a correlation between pH level and drug resistance of tumor cells (20). As shown by Fischer et al., high extracellular lactic acid concentration blocks the secretion of lactate by activated human T cells. This results in an impaired T cell function thereby contributing to the immune escape of tumor cells (66, 67). Additionally, lactic acid decreases the ability of monocytes to produce the pro-inflammatory cytokine tumor necrosis factor alpha (TNFα) playing an important role in the anti-tumor immune response (68). Furthermore, Colegio et al.
demonstrated, that tumor-derived lactate is taken up by tumor associated macrophages (TAMs) and leads to an increased expression of the vascular endothelial growth factor (VEGF) and arginase 1 - both tumor promoting factors (69).
This implies, that lactate acts not only as an immunosuppressor, but is capable to
10
recruit and support pro-tumorigenic immune cells fostering tumor growth, maintenance and metastasis (70).
Interfering with the glycolytic pathway is possible on different levels: (i) on the level of signal transduction and transcription and (ii) on the protein level of enzymes and transporters of the metabolic pathway itself.
(i) Signaling pathways involved in the regulation of metabolism are already targeted by many substances resulting in an interrupted growth and proliferation or even the induction of apoptosis in tumor cells:
Growth factor receptor: The monoclonal antibody cetuximab impedes EGF-receptor mediated growth signaling via the PI3K/Akt/mTORC1 pathway, which is successfully applied in the treatment of colorectal cancer (71, 72).
PI3K/Akt: Akt inhibition via perifosine in combination with other Akt inhibitors is in the focus of new therapeutic strategies for T-ALL (73).
mTORC1: rapamycin targets mTORC1 and thereby diminishes its transcriptional effects on genes up-regulating glycolysis. Additionally, the antidiabetic drug metformin induces AMP-kinase (AMPK), which indirectly inhibits mTORC1 (74).
HIF1: hypoxia and other factors stabilize the transcription factor subunit HIF1α (as shown above). For activation necessary dimerization with the β-subunit can be blocked by the drug acriflavine (75).
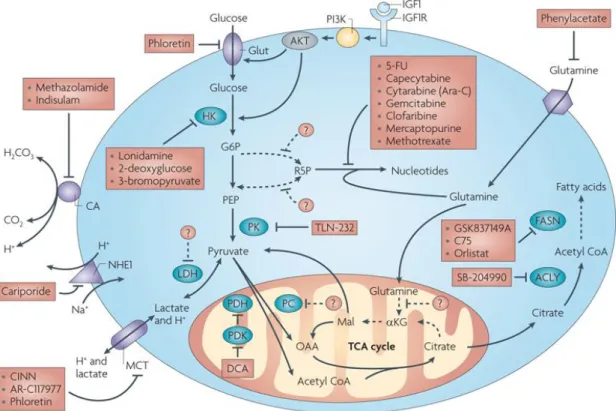
(ii) Glucose metabolism can be targeted on several steps and inhibitors of glycolytic enzymes as well as of transporters are currently under investigation (figure 2). The first step in glucose metabolism is the uptake of glucose by different transporters.
GLUT1, overexpressed in many tumor cells (14), is targeted by the drugs phloretin (76) and fasentin (77). Furthermore, hexokinase is impeded by various substances such as lonidamine (78), 3-bromopyruvate (79) or 2-deoxyglucose (2DG) (11, 80).
2DG, a glucose analogue, is converted into 2-deoxyglucosephosphate (2DG-P), which cannot be further metabolized. Its accumulation leads to a feed-back inhibition and a subsequent glycolytic arrest (81). 2DG application results in a release of hexokinase II (HK II) from the outer mitochondrial membrane, affecting the integrity of mitochondria and their function (63, 82). Similar effects are achieved by the inhibition of phosphofructokinase and pyruvate kinase (11). Another approach is the blockade
11
of pyruvate dehydrogenase kinase 1 (PDK1) by dichloroacetate (DCA), which reduces its inhibitory effect on pyruvate dehydrogenase (PDH). This results in a regained flux of pyruvate into the TCA cycle, increased OXPHOS and a drop in lactate excretion (83). Next, lactate dehydrogenase (LDH) is impeded by FX11 and oxamate, which leads to ATP depletion and a reduced chemotherapeutic drug resistance (84, 85). Additionally, the close cooperation of LDH with the transcription factor Oct-4 (Octamer binding transcription factor 4) is compromised (86). Blockade of monocarboxylate transporters MCT1 and MCT4 has anti-tumorigenic effects by blocking lactate efflux which results in an intracellular acidification and cell death (87, 88). A specific inhibitor of MCT1 (AR-C155858) was developed by AstraZeneca (89) and effectively blocks growth of transformed fibroblasts (90). Another MCT1 inhibitor (AZD3965) induces cell death of breast cancer and Burkitt lymphoma cell lines (88).
Importantly, efficient inhibition of glycolysis implies simultaneous blockade of both MCT transporters (22, 90).
Recently it has been shown that diclofenac, a non-steroidal anti-inflammatory drug (NSAID), is a potent glycolytic inhibitor in several tumor cells (melanoma and histiocytoma cells). The observed effects are independent of cyclooxygenase (COX) inhibition, as neither the unspecific COX-inhibitor aspirin nor the selective COX-2 inhibitor NS-398 showed an effect on proliferation and lactate production (91).
12
At first glance, inhibition of glycolysis seems to be a selective therapeutic strategy for tumor cells. However, many of the above mentioned targets are ubiquitously expressed in non-malignant cells (e.g. GLUT and glycolytic enzymes), so that blockade of this metabolic phenotype may hit other glucose-dependent cells.
Several studies show a comparable metabolic switch in T lymphocytes upon activation (92, 93), which raises concerns of a reduced immunofunction under anti- glycolytic treatment. As T cell infiltration and activation in the tumor tissue are correlated with a better prognosis (3, 94, 95), anti-glycolytic drugs might compromise T cell function thus negatively affecting patient outcome. However, the inhibition of glycolysis results in reduced tumor cell proliferation, viability and concomitantly lowered extracellular lactic acid concentration. Consequently, the anti-tumor immune response might be improved. In summary, the overlapping metabolic profile and complex interactions between tumor and immune cells challenge the application of anti-glycolytic therapies for tumor therapy.
Figure 2. Targets and appropriate anti-metabolic compounds already used in treatment of tumors
(by Tennant et al., Nature Reviews Cancer, 2010 (80), reprinted by permission from Macmillan Publishers Ltd:
Nature Reviews Cancer, © 2010)
13
1.2 Activation, effector function and metabolism of human T lymphocytes
The human immune system is challenged by a variety of different pathogens.
Besides the unspecific response of the innate immune system, a successful defense against infections or degenerated cells depends on the adaptive immune response.
Naive cells surveil the tissue and blood using a wide variety of different and unique recognition receptors and, upon activation, undergo massive clonal expansion to ensure pathogen clearance. To do so, immune cells activate several important metabolic pathways to meet their demands.
1.2.1 Activation of T lymphocytes
To proliferate and differentiate, T cells rely on antigen recognition, co-stimulation and cytokines. Antigen recognition is the first step of activation ensuring a specific immune response. Therefore, the presentation of foreign proteins by major histocompatibility antigens (MHC) is mandatory and two different complexes, MHC I and MHC II, recruit specific subpopulation of T cells. Upon recognition of unspecific microbial patterns, dendritic cells (DCs) or macrophages in the periphery take up and process foreign extracellular antigens (for example bacteria or fungi). After degradation, antigen fragments consisting of up to 25 amino acids (AA) are presented by the major histocompatibility complex II (MHC II), which is only expressed on professional antigen presenting cells (APCs) like DCs or macrophages.
The activated APCs thereupon migrate to secondary lymphoid tissues such as lymph nodes or the spleen, where circulating naïve CD4+ lymphocytes (= T helper cells, Th
cells) expressing CD4-assosciated T cell receptors (TCRs) are stimulated. In contrast, CD8+ T cells (= cytotoxic T cells, CTLs) are activated by the major histocompatibility complex I (MHC I) expressed by every nucleated human cell. In the course of the turnover of cellular proteins, short amino acid chains (< 10 AA) are connected with the histocompatibility complex and presented at the cell surface.
Virus- or tumor-caused alterations in those patterns are detected by specific, CD8- associated TCRs and result in an activation of the CTL. Similar to CD4+ T cells, activation of CD8+ T cells can be also initiated by antigen presenting cells, which
14
requires a pathway called “cross-presentation”: for reasons, which have not yet been entirely explained, APCs are able to ingest infected cells or secreted tumor- or virus- proteins and load to MHC I instead of MHC II. Furthermore, cytokines produced by CD4+ T cells also recognizing the respective pathogen (see below) are able to enhance or even initiate the differentiation of CTLs. It is assumed, that especially CTLs coping with latent viral infections or tumors eliciting a limited innate immune response depend on the interaction with both, APCs and CD4+ helper cells (81).
The T cell receptor complex consists of (i) the receptor part with two highly varying, via disulfide bonds connected chains (α- and β-chain) recognizing the cell-specific, MHC-bound antigen, and (ii) the non-covalently associated CD3- and ζ-proteins, which transduce the stimulation signal. The CD4- respectively CD8-molecules are transmembrane glycoproteins of the Ig superfamily, which bind to non-polymorphic sections of the MHC and are responsible for the MHC-restriction of the particular cell (CD4 to MHC II, CD8 to MHC I). Intracellular kinases connected to these molecules enable the signal transduction by phosphorylation of CD3- and ζ-proteins (81).
Besides the TCR stimulation, further co-stimuli are necessary to fully activate T cells.
These additional signals are cell-to-cell- or cytokine transmitted and depend on a prior APC stimulation. The TCR stimulation without co-stimulation results in anergy, describing a cellular hyporesponsiveness to a further T cell receptor stimulation.
Binding of CD28, expressed on the surface of T cells, by the APC ligands B7-1 and B7-2 (= CD80 and CD86) amplifies or even initiates the signal transduction especially via the activation of the PI3K/Akt pathway (96). Its importance is underlined by the fact, that knock-out of or mutations in genes encoding these proteins result in severe immune deficiency (17, 81). While about 80 % of CD4+ T cells express CD28, only about 50 % of CD8+ T cells express this co-stimulatory ligand (97). Also the CD40 ligand (CD40L), a tumor necrosis factor superfamily membrane protein on the helper T cell surface, binding the receptor CD40 on the APC surface leads to an increased B7-1/B7-2 expression and cytokine production thus providing a positive feedback loop. This process called licensing additionally enhances CTL differentiation (81).
Besides the membrane bound co-stimulatory molecules also humoral factors support and enhance the activation of lymphocytes. The most important cytokine for T cell stimulation is IL-2, which is early produced by innate immune cells and later
15
synthesized and secreted by CD4+ T helper cells, acting in an auto- as well as paracrine manner. The secretion peak is reached 8-12 hours upon antigen recognition and IL-2 interacts with the type I cytokine receptors. IL-2 binding to the IL- 2 receptor α (IL2-Rα, CD25) supports cell cycle progression and proliferation, survival and secretion of effector proteins such as IFNɣ (81, 92). Other cytokines playing a crucial role in T cell stimulation are IL-12, IL-15 and IL-21.
Upon ligation of the TCR and co-stimulation, the PI3K pathway is activated. The consecutive activation of the downstream kinase Akt contributes to cell survival by inhibition of members of the Bcl-2 family. Also the MAP (mitogen-activated protein) kinase cascade, involving Ras/Raf/MEK/ERK, is initiated and results in the synthesis and activation of the transcription factor activator protein 1 (AP-1). The TCR- dependent activation of the enzyme phospholipase C ɣ1 (PLCɣ1) catalyzes the reaction of the membrane-bound phosphatidylinositol-4,5-bisphosphate (PIP2) into the soluble inositol-1,4,5-triphosphate (IP3) and diacyl glycerol (DAG). IP3 leads to an increase of cytosolic calcium and via calmodulin and calcineurin to the activation of the transcription factor nuclear factor of activated T cells (NFAT), whereas DAG recruits the protein kinase C (PKC) and therewith activates the nuclear factor κB (NFκB). These transcription factors are responsible for the expression of anti- apoptotic proteins, enhanced proliferation, increased cytokine production as well as differentiation of naive T cells into effector and memory cells (81).
Besides activating co-receptors also inhibiting counterparts (= immune checkpoints) play a crucial role in balancing the immune response avoiding both immunodeficiency and autoimmune reactions. B7-1 and B7-2, ligands on the surface of APCs, are bound by the membranous T cell molecule cytotoxic T lymphocyte antigen 4 (CTLA-4, CD154), which is also engaged upon activation and shows a considerably higher affinity to B7 compared to the CD28 receptor. Especially when B7 levels are low, this connection leads to a negative regulation of the immune response and self-tolerance. A similar effect is achieved by the connection of the programmed death ligand 1 (PD-L1) on APCs to its receptor programmed death 1 (PD-1) on T cells. These mechanisms mediate the inactivation of the immune system to prevent systemic damage by overstimulation or the development of autoimmune reactive T cell clones by MHC-presentation of autologous peptides without expression of co-stimuli (81).
16 1.2.2 Effector functions of activated T cells
T cells are responsible for the cell-mediated part of the adaptive immune response.
CD8+ T cells directly eliminate infected and transformed cells by apoptosis inducing ligands and cytotoxic proteins. In contrast, CD4+ T cell subpopulations attract, control and activate innate immune cells like macrophages and neutrophils by cytokine secretion and surface molecule expression. Depending on the particular T cell subtype different leukocytes are recruited. Additionally, CD4+ T cells can acquire a cytotoxic phenotype contributing to lysis of malignant or infected host cells (98, 99).
CD8+ T cells (CTLs) directly attack every kind of cell harboring intracellular microbes, but also neoplastic cells. Following differentiation and activation in secondary lymphoid organs, CTLs enter infection sites and bind to target cells presenting specific virus- or tumor-altered cellular proteins by class I MHC. After binding to the MHC I, the immunologic synapse is formed by the adhesion molecules intercellular adhesion molecule 1 (ICAM-1) and lymphocyte function-associated antigen 1 (LFA- 1). This close connection prevents damage of healthy neighboring cells. CTLs secret perforin and granzymes, which perforate the target cell membrane and induce apoptosis. Furthermore, CTLs express the membrane protein Fas ligand (FasL, CD95), which binds the ubiquitously expressed death receptor Fas and also mediates cell death via caspase activation (81).
To avoid recognition and elimination, tumor cells engage many mechanisms. As T cell activation relies on the MHC presentation, many tumors show downregulated MHC I expression to get “invisible” to CTLs. Another strategy is the suppression of T cell activation by upregulated PD-L1 expression. Furthermore, tumor antigens can be presented on MHC II but with low B7 levels on the APCs. This combination supports the CTLA-4- instead of the CD28-binding by B7 family members also inhibiting T cell activation. Additionally, tumor produced humoral factors such as transforming growth factor β (TGFβ) prevent T cell proliferation and effector functions (81).
Activated CD4+ T cells differentiate in a variety of subpopulations: Th1, Th2 and Th17 cells, displaying different functions.
Th1 cells are mainly activated by APCs secreting IL-12 upon pathogen recognition.
The Th1 subpopulation is characterized by production and secretion of IFNɣ
17
supporting macrophage activation and the killing of phagocytosed microbes by reactive oxygen species (ROS) and lysosomal enzymes. Beyond that IFNɣ-activated macrophages secret chemokines to recruit innate immune cells and produce IL-12 to amplify the Th1 response. An IFN-mediated antibody switch of IgG to subclasses promoting opsonization and phagocytosis of extracellular microbes supports this mechanism. Additionally, IFNɣ increases the MHC expression and MHC-mediated pathogen presentation leading to a stronger activation thereby resulting in a positive feedback loop.
Th2 cells in contrast are primarily stimulated by allergens and chronic inflammations without innate immune cells. These cells coordinate an immune response performed by mast cells, basophils and eosinophils via secretion of IL-4, IL-5 and IL-13.
Thereby, IL-4 and IL-13 regulate the antibody switch to IgE, whereas IL-5 stimulates eosinophils. Further on, especially IL-13 increases the mucosal barrier function by stimulation of mucus production.
Immune response mediated by Th17 cells is stimulated by extracellular fungi and bacteria, which are recognized and presented via the MHC II by APCs. IL-17 produced by Th17 cells activates neutrophils and monocytes.
CD4+ T helper cells enhance the antitumor response by production of cytokines which are necessary for the differentiation of CD8+ effector cells. Additionally, secretion of IFNɣ and TNFα increases MHC I expression in target cells thus supporting recognition by CTLs (81).
18 1.2.3 Metabolism of T lymphocytes
1.2.3.1 Metabolism of quiescent T cells
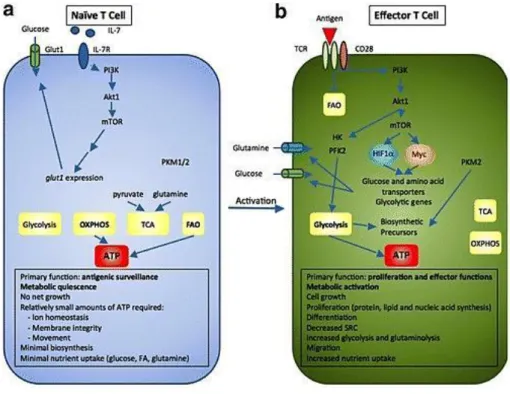
As shown in figure 3, quiescent cells cover their energy demand utilizing glucose and fatty acids to generate ATP by oxidative phosphorylation (OXPHOS) (100, 101). This metabolic phenotype is not static, but relies on different growth signals to prevent apoptosis and maintain intracellular glucose concentrations. A permanent, weak T cell receptor (TCR) signal is necessary to maintain a critical amount of GLUT1 on the surface and oxidative energy production by stimulation of mitogen-activated protein kinase (MAPK) and AMP-kinase (AMPK) pathways (92).
Besides the TCR signals also interleukin 7 (IL-7) prevents cell death via stabilizing the balance between pro- (Bim) and anti-apoptotic members (Bcl-2 and Mcl-1) of the B cell lymphoma 2 family (102) by binding to the IL-7 receptor (IL-7R). This homeostasis is a critical process to avoid both, immunodeficiency by lacking of adequate cell numbers and autoimmune diseases by uncontrolled proliferation.
Additionally, also IL-7 promotes the glucose metabolism and glycolysis by expression and the surface trafficking of GLUT1 and therewith increased glucose uptake via the activation of the januskinase (Jak)/signal transducer and activator of transcription 5 (STAT5) and the PI3K/Akt pathway. In contrast to activated T cells, quiescent cells show a delayed, but at low levels constant Akt activation (103).
1.2.3.2 Metabolism and function of activated T cells
Upon activation murine T cells immediately increase the expression of various surface molecules as well as the secretion of cytokines, followed by a massive clonal expansion. For this reason, stimulated T cells have a high demand for biomolecules (DNA, lipids, amino acids) required for cell growth, proliferation and production of effector proteins. To meet this demand increased metabolic activity is necessary (104) and T cell metabolism shifts, as shown in figure 3 (101), from OXPHOS to glycolysis to support the highly proliferative phenotype (105). Binding of the TCR complex and co-stimulatory receptors results in increased PI3K/AKT/mTORC1, AMPK and MAP kinase activity, regulating transcription factors such as c-Myc or
19
NFAT (106, 107). Glycolysis, glutaminolysis and mitochondrial activity are upregulated by expression of rate-limiting enzymes and the surface trafficking of appropriate transporters (96, 108, 109). The metabolic profile of activated T cells closely resembles the profile observed in tumor cells.
Frauwirth et al. demonstrated, that CD28 co-stimulation is crucial for the enhancement of glucose metabolism in T cells by upregulation of the PI3K/Akt pathway (96). This results in increased GLUT1 and GLUT3 levels to foster glucose up-take required for the replenishment of intracellular building blocks (110) as well as elevated activity of glycolytic enzymes e.g. HK and PKM2 (101). Neither TCR/CD3 stimulation alone nor IL-2 binding to IL-2 receptors are able to induce and maintain a comparable metabolic state in T cells (96). Interestingly, the CD28 ligation alone does not induce glucose metabolism and stimulation of further, TCR-associated pathways, such as the MAP kinase cascade, is required. Especially ERK is necessary to increase the hexokinase activity (111). Furthermore, it is well-known, that some of the glycolytic enzymes are able to affect genetic transcription or stabilize transcriptional factors, respectively, representing a linkage between the T cell effector function and metabolism (112). Similar to tumor cells, glucose serves as a carbon source for nucleotides and NADPH redox equivalents via the pentose phosphate pathway as well as amino acid synthesis. Provision of these building blocks is necessary for the proliferation (111, 113) and inhibition of glycolysis by 2DG results in a significant proliferation arrest of murine T cells (107, 114, 115).
Furthermore, in the murine system a strong link between the production of the effector cytokine interferon ɣ and glycolysis is reported (113, 116, 117). Glucose regulates the dissociation of the enzyme glyceraldehyde-3-phophate dehydrogenase (GAPDH) from the 3´ UTR (= three prime untranslated region) of IFNɣ, which enables the translation of IFNɣ (118). Accordingly, it is shown that 2DG inhibits the IFNɣ production (119). Cham and Gajewski demonstrated that 2DG also reduces IL- 2 production in murine T cells (120). On the other hand it has been shown that glucose starvation affects whether IL-2 production by murine CD4+ cells nor cytotoxic activity of murine CD8+ T cells (113, 121).
Upregulated glutamine uptake replenishes the TCA cycle, supports maintenance of mitochondrial membrane potential and acts as a biomolecular precursor of lipids and amino acids (92, 104, 122–125). Inhibition of glutaminolysis is shown to impede
20
murine T cell growth and proliferation (126), whereas IFNɣ and IL-2 are produced in glutamine free environment. However, presence of glutamine results in a further stimulation (127, 128).
Studies analyzing the importance of mitochondrial energy production for proliferation and effector functions of activated T cells are contradictory. Mitochondrial ATP seems to be important for proliferation and memory T cell development (118). Also, IL-2 production depends on OXPHOS and reactive oxygen species (ROS) generation (129). However, the inhibition of mitochondrial respiration has no impact on the IFNɣ production in murine CD4+ T cells (118), whereas the blockade in murine CD8+ T cells is shown to distinctly reduce interferon secretion (130).
The link between metabolism and function of human T lymphocytes is much less elucidated, but numerous aspects show significant differences between the murine and the human immune system (131). For example, glucose restriction results in severely impaired proliferation but preserved IFNɣ production in human T cells, whereas murine T cells cannot maintain interferon secretion. Glycolytic inhibition by 2DG in contrast affects effector functions (132). Upon activation, increased glucose and glutamine uptake are linked to proliferation and cytokine production (96, 108, 133). However, human memory CD8+ T cells rely on an early glycolytic switch to ensure a sufficient IFNɣ production (114), whereas human CD4+ T cells maintain their functions even under conditions of energy restriction (134). Taken together, the link between metabolism and effector functions is still not clear.
21
Figure 3. Metabolic re-programming during T cell activation
(a) Naïve T cells surveil secondary lymphoid tissues. Therefore necessary energy is mainly produced by OXPHOS and fatty acid oxidation (FAO). Low levels of IL-7 binding to IL-7 receptor (IL-7R) ensure adequate amounts of surface glucose transporters via PI3K/Akt/mTOR pathway. (b) Upon activation T cells undergo a massive clonal expansion. TCR/CD28-mediated pathways inhibit FAO and OXPHOS, while upregulated glucose transporters and glycolytic enzymes maintain high levels of important building blocks (modified after Herbel et al., Clinical and translational medicine, 2016, reprint permitted by the authors (101))
22
2. Research objectives
One of the main aspects of nowadays cancer research is the development of targeted therapies to reduce treatment related adverse side effects and increase therapeutic efficacy. Therefore, characteristics distinguishing tumor cells from non- malignant cells are under investigation. In this context also the altered tumor cell metabolism is under consideration. Most solid tumors but also leukemic cells are characterized by an upregulation of glucose metabolism. Its inhibition is shown to effectively impair tumor growth and viability. Moreover, anti-glycolytic treatment reduces the secretion of the immunosuppressive metabolite lactic acid. Taken together, glucose metabolism represents a promising therapeutic target.
However, it has been shown, that murine primary T cells also rely on glucose metabolism to sustain proliferation and effector functions. In line, glycolytic inhibition impairs proliferation and secretion of key cytokines such as IFNɣ. As the number and activity of tumor infiltrating T cells positively correlate with patient prognosis, anti- glycolytic treatment might severely affect patient outcome.
The aim of this study was the development of an anti-glycolytic treatment, effectively targeting tumor glucose metabolism, but preserving effector functions of human T cells. Data on the link between metabolism and human T cell function are rather sparse. In this study, therefore, glucose metabolism was analyzed in relation to function of stimulated human CD4+ and CD8+ T cells. In addition, the impact of two glycolytic inhibitors, 2DG and diclofenac, on proliferation and viability of malignant T lymphocytes was investigated in comparison to primary CD4+ and CD8+ T cells.
Finally, effects of glycolytic inhibitors on effector functions such as IFNɣ production of human T cell populations were examined.
23
3. Material and methods
3.1 Material 3.1.1 Devices
Advia 1650 Bayer HealthCare, Tarrytown (NY, USA)
CASY cell counter Roche Innovartis, Bielefeld
EMax Precision microplate reader Molecular Devices, Sunnyvale (CA, USA)
FACS Calibur BD Bioscience, Heidelberg
Incubator (BBD 6220) Heraeus, Osterode
Multifuge 3S-R Thermo Scientific, Waltham
Multifuge 3.0R Thermo Scientific, Waltham
Sepatech Megafuge 1.0 Heraeus, Osterode
Sepatech Megafuge 3.0 cooling centrifuge
Heraeus, Osterode
Thermo VarioSkan Thermo Scientific, Waltham
Vortex Genie 2 Scientific Industries, Bohemia (NY, USA)
3.1.2 Pipettes, plates, flasks, tubes
Research Plus (pipettes), 10/100/1000 µl
Eppendorf AG, Hamburg Serological Pipettes,
1/2/5/25 ml
Nerbe plus, Winsen
Pipetboy acu Integra Bioscience, Zizers (CH)
Polystyrene Round-Bottom Tubes 5 ml (FACS tubes)
Corning Science, Tamaulipas (Mexico) Tube Racks 15/50 ml Greiner Bio-One, Kremsmünster (AUT) 96 well plates U-/flat-bottom Costar, Corning
24 3.1.3 Medium, buffers, solutions
Annexin binding buffer BD, Franklin Lakes (NJ, USA)
Aqua Ecotainer B. Braun, Melsungen
FACSclean BD, Franklin Lakes (NJ, USA)
FACSflow BD, Franklin Lakes (NJ, USA)
FACSrinse BD, Franklin Lakes (NJ, USA)
Lymphocyte separation solution (Ficoll) PAA, Linz (AUT) Phosphate buffered saline (PBS) Biochrome, Berlin Dulbecco´s PBS without Ca2+/Mg2+ PAA
T cell medium
500 ml RPMI 1640 PAN Biotech, Aidenbach
5 ml instable L-glutamine Biochrome, Berlin 5 ml Nonessential amino acids Gibco
5 ml Sodium pyruvate Gibco
0.5 ml β-mercaptoethanol Gibco
2.5 ml Penicillin/Streptomycin (10.000U/ml)
Gibco
10 % AB-Serum, human PAN Biotech, Aidenbach
Tumor cell (C7H2) medium
500 ml RPMI 1640 PAN Biotech, Aidenbach
2 ml instable L-glutamine Biochrome, Berlin
10 % FCS Gibco
25 DC medium
500 ml RPMI 1640 PAN Biotech, Aidenbach
1.0 % instable L-glutamine Biochrome, Berlin 2.5 ml Penicillin/Streptomycin
(10.000U/ml)
Gibco 10 % FCS (fetal calf serum) Gibco
FACS staining buffer PBS + 2 % AB-serum
MACS buffer
PBS + 2 mM EDTA + 1 % FCS
3.1.4 Cell separation
QuadroMACS® separator Miltenyi Biotec, Bergisch Gladbach
LS Columns Miltenyi Biotec, Bergisch Gladbach
CD4 MicroBeads, human Miltenyi Biotec, Bergisch Gladbach CD8 MicroBeads, human Miltenyi Biotec, Bergisch Gladbach
3.1.5 Apoptosis staining
Dye Company Vol./test Material
number
FITC Annexin V BD 5 µl 556419
7-AAD BD 20 µl 559925
26 3.1.6 Antibodies and isotypes
3.1.7 Kits, cytokines
Dynabeads® Human T-Activator CD3/CD28
Gibco/Invitrogen
Human IFN gamma DuoSet ELISA R&D Systems, Wiesbaden Human IL-2 DuoSet ELISA R&D Systems
Human IL-10 DuoSet ELISA R&D Systems
Glucose (HK) Assay Kit Sigma, St. Louis (USA)
IL-2 PeproTech, Hamburg
Anti-human
antibody Conjugate Company Clone Isotype
(Mouse) Vol./test Material number
CD4 PE BD RPA-T4 IgG1, к 5 µl 561844
CD8 PE-Cy7 BioLegend SK1 IgG1, к 10 µl 344711
CD25 PE-Cy7 BD M-A251 IgG1, к 5 µl 557741
CD95 FITC BD DX2 IgG1, к 20 µl 561975
CD137 PE eBioscience 4B4 IgG1, к 5 µl 12-1379
Isotype
(Mouse) Conjugate Company Clone Vol./test Material number
IgG1, к FITC BD MOPC-21 20 µl 555909
PE-Cy7 BioLegend MOPC-21 20 µl 400126
PE BD MOPC-21 20 µl 555749
27 3.2 Methods
3.2.1 Tumor cell line cultivation
As representative of a malignant T-ALL cell line CEM-CCRF-C7H2 cells, first isolated by Norman and Thompson in 1977 (135), was used. These cells were cultivated in tumor cell medium at a starting concentration of 300.000 cells per ml in a total volume of 20 ml. Incubation was performed in a humidified atmosphere (5 % CO2, 95
% air) at 37° Celsius and cells were split every second day.
3.2.2 T cell isolation, stimulation and cultivation
Human peripheral blood mononuclear cells (PBMCs) were separated from blood of healthy donors by leukapheresis via a density gradient centrifugation (2000 rpm, 25 min, room temperature) over Ficoll/Hypaqua and subsequent countercurrent centrifugation (elutriation). Cells were collected from the interphase and washed with PBS (two times 1800 rpm, 7 min, 4°C, third time 1200 rpm, 7 min, 4°C). The study was approved by the local ethical committee and all human participants gave written informed consent.
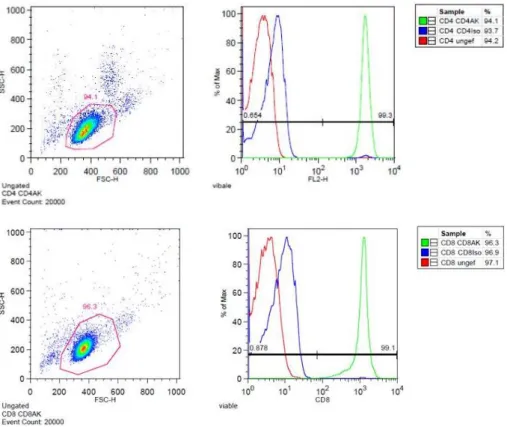
CD4+ and CD8+ T cells were isolated by magnetic separation. Therefore, 108 monocyte-depleted PBMCs were solved in 160 µl MACS buffer and incubated with 40 µl magnetic anti-CD4 or anti-CD8 MicroBeads. After incubation, cells were washed with MACS buffer, centrifuged and resuspended. The cell suspension was applied on LS columns and magnetically separated by a MACS separator. After separation, purity of populations was determined by anti-CD4 and anti-CD8 staining and analyzed by flow cytometry. Thereby a purity of more than 98 % was achieved (figure 4).
28
Subsequently, cells were solved in T cell medium supplemented with IL-2 (100 IU/ml) and plated on 96 well plates together with anti-CD3/CD28 beads in a ratio of 1:1 (105 cells, 105 beads, total volume 225 µl). As a control T cells were plated without anti- CD3/CD28 beads under identical conditions (= quiescent T cells). Plated T cells were cultured in a humidified atmosphere (5 % CO2, 95 % air) at 37° Celsius. In figure 5 a detailed experimental time course is presented.
Figure 4. Purity of freshly isolated example donor CD4+ and CD8+ T cells
Subpopulations were stained with anti-CD4+ and anti-CD8+ antibodies immediately after magnetic bead separation and analyzed by flow cytometry.
29
d0d1d2d3 d0d1d2d3 Re-stimulus
7 daysuntreated Re-stimulus
7 daysuntreated Re-stimulus
7 daysuntreatedd0d1d2d3
(A) (C) (B) (D )
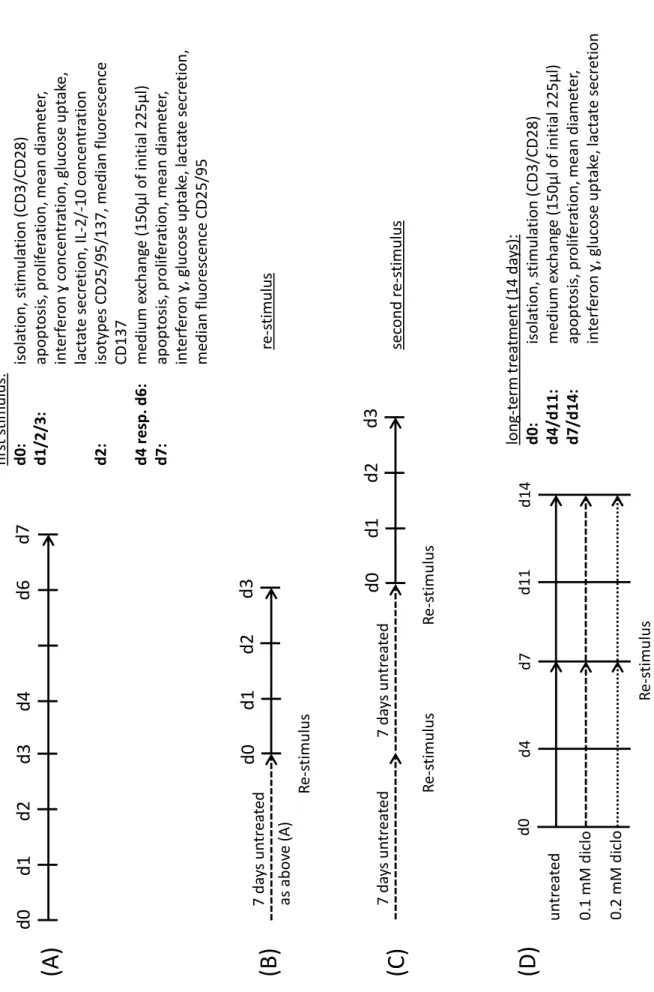
d4d6d7firststimulus: d0:isolation, stimulation(CD3/CD28) d1/2/3:apoptosis, proliferation, meandiameter, interferonɣ concentration, glucoseuptake, lactatesecretion, IL-2/-10 concentration d2:isotypesCD25/95/137, median fluorescence CD137 d4 resp. d6: medium exchange(150µl ofinitial 225µl) d7:apoptosis, proliferation, meandiameter, interferonɣ, glucoseuptake, lactatesecretion, median fluorescenceCD25/95 asabove(A)re-stimulus secondre-stimulus untreated 0.1 mM diclo 0.2 mM diclo Re-stimulus
d4d7d11d14long-term treatment(14 days): d0:isolation, stimulation(CD3/CD28) d4/d11:medium exchange(150µl ofinitial 225µl) d7/d14:apoptosis, proliferation, meandiameter, interferonɣ, glucoseuptake, lactatesecretion
d0
Figure 5. Schedule of T cell cultivation and time points of measurements
30 3.2.3 Mixed leukocyte reaction (MLR)
T cells were stimulated in a mixed leukocyte reaction (MLR), representing a more physiological stimulus. In a MLR T cells are activated by allogenic antigen presenting dendritic cells (DCs). Monocytes were differentiated to dendritic cells by stimulation of 1.5 x 10⁶ cells per ml with IL-4 (144 U/ml), colony stimulating factor GM-CSF (224 U/ml) and after 4 days matured with lipopolysaccharide LPS (100 ng/ml) in DC medium for two days. Matured DCs were centrifuged (1600 rpm, 4 min, 4 °C) and re- suspended in T cell medium. DCs were plated on 96 well plates with freshly isolated T cells at a ratio of 1:10 (10.000 DCs, 100.000 T cells) in a total volume of 225 µl T cell medium supplemented with IL-2 (100 IU/ml). A medium exchange (150 µl of initial 225 µl) was performed on day four and T cells were harvested after seven days of stimulation.
3.2.4 Determination of cell number and cell size
Measurement of proliferation and cell growth was performed with the CASY system.
Cells were pooled and separated from anti-CD3/CD28 beads by magnetic separation. 50 µl of the cell suspension were mixed with 10 ml of CASY buffer.
Principle of the CASY technology is the electric acquisition of cells passing through a measurement pore. The resulting signal depends on the cell volume (electrical current exclusion, ECE), which leads to detection of cell size and number.
3.2.5 Measurement of glucose consumption and lactate secretion
After magnetic separation from anti-CD3/CD28 beads and pooling, cell suspension was centrifuged (1600 rpm, 4 min, 4°C) and supernatant was drawn and stored at - 20 °C for determination of glucose and lactate concentrations. Glucose consumption and lactate secretion were calculated as the difference between the concentration in the standard medium and culture supernatant.