Policy Research Working Paper 6897
Private School Participation in Pakistan
Quynh Nguyen Dhushyanth Raju
The World Bank South Asia Region Education Unit May 2014
WPS6897
Public Disclosure Authorized Public Disclosure Authorized Public Disclosure Authorized Public Disclosure Authorized
Produced by the Research Support Team
Abstract
The Policy Research Working Paper Series disseminates the findings of work in progress to encourage the exchange of ideas about development issues. An objective of the series is to get the findings out quickly, even if the presentations are less than fully polished. The papers carry the names of the authors and should be cited accordingly. The findings, interpretations, and conclusions expressed in this paper are entirely those of the authors. They do not necessarily represent the views of the International Bank for Reconstruction and Development/World Bank and its affiliated organizations, or those of the Executive Directors of the World Bank or the governments they represent.
Policy Research Working Paper 6897
: Private schooling is an important feature of the educational landscape in Pakistan and is increasingly a topic of public and government discourse. This study uses multiple rounds of national household sample surveys to examine the extent and nature of private school participation at the primary and secondary levels in Pakistan. Today, one-fifth of children—or one-third of all students—go to private school in Pakistan. Private school students tend to come from urban, wealthier, and more educated households than do government school students and especially out-of-school children. Important differences exist across Pakistan’s four provinces with respect to the characteristics of private school students relative to government school students, as well as in the composition of private school students. Private schooling is highly concentrated, with a few districts (situated mainly in northern Punjab province) accounting for most of the private school students. Private school
This paper is a product of the Education Unit, South Asia Region. It is part of a larger effort by the World Bank to provide open access to its research and make a contribution to development policy discussions around the world. Policy Research Working Papers are also posted on the Web at http://econ.worldbank.org. The authors may be contacted at nguyen4@
worldbank.org or draju2@worldbank.org.
participation among children varies largely from one
household to another, rather than within households,
and to a greater extent than does government school
participation. The spatial patterns of private school
supply are often strongly correlated with the spatial
patterns of private school participation. In the 2000s,
private school participation rates grew in Punjab,
Sindh, and Khyber Pakhtunkhwa provinces and across
socioeconomic subgroups, contributing in particular to
the growth in overall school participation rates for boys,
children from urban households, and children from
households in the highest wealth quintile. Nevertheless,
the composition of private school students has become
less unequal over time. This trend has been driven mainly
by Punjab province, which has seen declines in the shares
of private school students from urban households and
households in the highest wealth quintile.
Private School Participation in Pakistan
Quynh Nguyen World Bank Dhushyanth Raju
∗World Bank
We thank Amit Dar and Huma Ali Waheed for their encouragement of and support for this study; Andaleeb Alam and Mahesh Dahal for their research assistance; and Donald Baum, Seo Yeon Hong, and Shinsaku Nomura for their comments and suggestions. We gratefully acknowledge the Australian Department of Foreign Affairs and Trade (DFAT) and the World Bank for their financial support for the study.
∗
Nguyen: qnguyen4@worldbank.org. Raju: draju2@worldbank.org.
1. Introduction
Private schooling in Pakistan has received growing and widespread attention in recent years.
Researchers are studying it. The popular media at the local, national, and international level is reporting on it. Both the country’s government, at different tiers of the administration, as well as those international development agencies that provide Pakistan with financial and technical assistance in the education sector are grappling with the phenomenon’s implications when it comes to education policy, development and reform, and service delivery.
Pakistan’s private school system has a long history, with its roots in the pre-independence era. In the early decades after independence, the system remained modest, being largely
comprised of schools supported by nongovernmental organizations (NGOs), both religious (madrassas, missionary schools) and secular. These schools primarily catered to high-income families residing in major cities. Starting in the 1990s, there was a boom in private schools, leading to a dramatic structural transformation in the school system at large.
1This transformation is still underway, as the private school system continues to proliferate, expand in reach, and change in composition.
Using school census data from 1999/2000, Andrabi, Das, and Khwaja (2008) found that the majority of Pakistan’s roughly 36,000 private schools were established in the 1990s and were at the primary level (up to grade 5). The rural share of private schools established in each year was at least as large as the urban share. Furthermore, the vast majority of private schools established in the 1980s and 90s reported that they were for-profit. Using school census data from 2007/08, I-SAPS (2010) determined that the number of private schools has since doubled to 70,000, with particularly strong growth in schools at the middle and high levels in both rural and urban areas. Using multiple rounds of household sample survey data, Andrabi et al. also found that the private school share of enrollment rose markedly over the 1990s for both rich and poor households and urban and rural households, and rose more in the provinces of Punjab and Khyber Pakhtunkhwa (KP) than in Sindh and Balochistan. Over this same period, the government school system—the dominant provider of schooling in terms of the number of
1
The boom in private schools and private school participation is likely driven by multiple factors. One often-stated factor is poor service delivery in government schools, but the claim is yet to be empirically substantiated. Andrabi, Das, and Khwaja (2013) find that past expansion of government secondary schools for girls is one driver of the expansion of low-cost private schools. They argue that the pathway is secondary school educated women taking up employment as teachers in low-cost private schools at low, market-competitive wage rates.
2
institutions and share of enrollment—has seen its position steadily erode, particularly in urban areas and in the rural parts of Punjab and KP provinces. This has occurred despite the fact that government schools are ostensibly free for the user, while private schools typically charge fees.
Today, the private school system is largely composed of institutions that are for-profit, fee-based, secular, autonomous, unregulated in practice, and which lack direct government support. In other words, they are purely private entities whose school service delivery decisions are dictated by market-competitive forces. A large segment of the private school system is also highly affordable. School fees are generally low enough that poor households manage to pay them. For example, Andrabi et al. (2008) find that average tuition fees constitute around 2 percent of the average household income in both rural and urban areas. Private schools are affordable due to their low operating costs, a main component of which is labor. Private schools tend to be staffed by young, unmarried women with low levels of education and little or no formal training in teaching. Private school teachers are also paid substantially less on average than government school teachers, even after accounting for differences in the characteristics of teachers between the two school types (Andrabi et al. 2008).
In this study, we use recent rounds of household sample survey data that are national in coverage and representative at a low-administrative level—at the district level—to provide both a panoramic and a high-resolution profile of private school participation at the primary and secondary levels in Pakistan.
2We specifically examine the extent and nature of the phenomenon by disaggregating the data in multiple ways to reveal patterns across (1) selected socioeconomic subpopulations, (2) administrative divisions/spatial units (country, province, and district), and (3) children within households. We also compare the extent of private school participation in
Pakistan to that of India, as the two countries have a shared history of political, social, and economic development prior to achieving their respective independence in 1947.
This study is descriptive. The nature and contents of the data (observational data, basic information on schooling) do not allow us, for example, to examine what factors encourage or inhibit private school participation or which benefits—human capital and other—might be obtained by children, families, and communities from private school participation. Existing research finds that private schooling is associated with higher student achievement (Alderman et
2
Pakistan has five administrative tiers: federal, province, district, tehsil/taluka, and union council. In 2010/11, the year of our most recent survey data, there were 113 districts in Pakistan’s four provinces.
3
al. 2001; Das et al. 2006; Aslam 2003, 2009; Andrabi et al. 2010; Andrabi et al. 2011) and labor market earnings (Asadullah 2009) in Pakistan. Among these studies, Andrabi et al. (2010) identify the causal effect of private schooling on student achievement by using standardized test score data for primary-grade students in selected villages of Punjab and instrumenting for the child’s private school participation by using the household’s distance to private school relative to the distance to government school, conditional on the distance of the household from the village center. Andrabi et al. (2010) additionally find that average student achievement in private schools is 0.8 to 1 standard deviations higher than in government schools. Using the same instrumental variables strategy, the study authors also find a causal effect of private school participation on student civic values, as measured through a standardized civic knowledge and disposition test.
This study comes closest to previous work by Andrabi et al. (2008), in that we use
household survey data to examine private school participation in the 2000s, updating the findings of Andrabi et al. for the 1990s. Our study also extends the previous work by extracting more information from the survey data on, for example, whether and to what extent private school participation differs spatially (as measured at the district level) as well as among children across and within households. At the same time, our study is more limited than the previous work in that we do not examine the characteristics of private schools and the private school participation decision at the village level (which Andrabi et al. do in their study by using school and
population census data). I-SAPS (2010) has, however, provided some updated work on the characteristics of private schools using school census data collected over the 2000s.
Our examination of current private school participation using household survey data from 2010/11 provides six main findings. First, the extent of school participation for children in the 6 to 10 and 11 to 15 age groups is large: about one-fifth of children go to private school in
Pakistan, which translates into roughly one-third of all students, given the sizeable share of the country’s children that do not go to school at all. Pakistan’s national and provincial levels of private school participation do not, however, stand out when compared, for example, to corresponding private school participation rates in India and its states. Second, as expected, private school students tend to come from urban, wealthier, and more educated households than do government school students, and especially out-of-school children. Third, aside from
differences in private school participation rates among provinces, there are, at times, qualitative
4
differences in the characteristics of private school students compared to government school students from one province to another. The composition of private school students also differs across provinces, with the sharpest distinctions arising between Punjab and KP, on one side, and Sindh and Balochistan, on the other. The differences in the composition of private school
students between KP and Sindh are particularly interesting given that these two provinces have comparable private school participation rates. Fourth, private schooling is highly concentrated in Pakistan, with over 50 percent of private school students residing in 10 out of the country’s 113 districts. These 10 districts tend to be more urban and wealthier, and most of them are situated in northern Punjab. Fifth, most of the variation in school participation among children is due to the variation in school participation among children across households rather than within
households. This pattern is even more pronounced in relation to private school participation than government school participation. Sixth, the spatial patterns in private school participation across provinces, districts, and rural vs. urban areas frequently overlap to a high degree with the spatial patterns in private school supply, obtained using separate school census data.
Our examination of the evolution of private school participation over the 2000s using household survey data from 1998/99 onwards provides three main findings. First, private school participation rates grew markedly in Punjab, KP, and Sindh. Private school participation rates also grew markedly in all selected socioeconomic subgroups. Second, the growth in private school participation rates contributed more to the growth in overall school participation rates for boys, children from urban households, and children from households in the highest wealth quintile (which are the traditionally advantaged subgroups) than for other socioeconomic subgroups. Third, the growth in private school participation was nevertheless equalizing in nature, particularly in Punjab, where the shares of private school students from households in the highest wealth quintile and urban households fell.
3The remainder of the paper is organized as follows. Section 2 describes the data and key variables. Section 3 discusses private school participation rates at the country level, and across provinces and selected socioeconomic subgroups. Section 4 compares private school
participation rates in Pakistan’s provinces to those in India’s states. Section 5 compares the
3
Although appearing to be contradictory, the two findings are mutually possible. The first finding pertains to the extent of private school participation in subgroup x, while the second finding pertains to the extent of subgroup x in private school participation, where subgroup x is a minority subgroup in the population.
5
socioeconomic characteristics of private school students to those of government school students and out-of-school children, and considers the composition of private school students across provinces. Section 6 discusses the distribution of private school students across districts. Section 7 discusses the distribution of private school participation among children within the same household. Section 8 discusses how private school participation rates and the composition of private school students have evolved over the 2000s. Section 9 discusses associations between the spatial distribution of private schools and key spatial patterns in private school participation.
Section 10 summarizes our main findings.
2. The data and variables
The data for this study come from national household sample surveys administered by the
Pakistan Bureau of Statistics (PBS).
4The surveys are Living Standard Measurement Surveys and Core Welfare Indicator Questionnaires adapted to the Pakistan context. In constructing the current picture, we use data from the 2010/11 Pakistan Social and Living Standards
Measurement (PSLM) survey, the latest available survey for which primary data have been publicly released by PBS at the time of writing this paper.
5The 2010/11 PSLM survey is
representative at the district level and interviewed 75,979 households in 5,368 Primary Sampling Units (PSUs).
6In constructing the picture over the 2000s, we mainly use data from the 1998/99 Pakistan Integrated Household Survey (PIHS) and the 2004/05 PSLM survey as baseline data to estimate the change in private school participation over 1998/99–2010/11, a twelve-year period, and 2004/05–2010/11, a six-year period, respectively. The 1998/99 PIHS is representative at the province level and interviewed 14,820 households in 1,050 PSUs. The 2004/05 PSLM survey is representative at the district level and covers 73,424 households in 5,164 PSUs. We also use data from the 2001/02 PIHS and the 2005/06, 2006/07, 2007/08, and 2008/09 PSLM surveys to track more finely the evolution of private school participation rates over the 2000s by province and by
4
The Pakistan Bureau of Statistics (PBS) is the country's main agency tasked with collecting and compiling statistical information on socioeconomic features of the economy. The PBS was created in 2011 through a merger of the Federal Bureau of Statistics and other federal-level statistical agencies. Prior to 2011, the PIHS and PSLM surveys were administered by the Federal Bureau of Statistics.
5
PBS released the 2011/12 PSLM survey report in June 2013; the release of the primary data will follow.
6
Rural PSUs are villages. Urban PSUs are blocks of cities or towns, where each block is composed of 200–250 households (PSLM survey reports, Federal Bureau of Statistics, Government of Pakistan).
6
selected subgroup (females vs. males, urban vs. rural). However we do not use these additional data to examine the nature of the evolution of private school participation at the same depth as with the 1998/99 PIHS and 2004/05 and 2010/11 PSLM survey data.
All the surveys cover the four provinces and the Islamabad Capital Territory (ICT). ICT accounted for less than 1 percent of the population of Pakistan in 2012.
7Given its relatively small size, we exclude ICT from our analysis and only examine private school participation in the four provinces.
8For ease of exposition, we refer to the four provinces taken together as the country.
The household sample surveys ask a small set of basic questions about education.
Individuals age four and above are asked their current schooling status. Those who report being currently enrolled in school are asked in which grade or level they are and in which type of school. Regarding school type, the response options include government, private, and a few others (Masjid school, Deeni Madrassa, NGO/Trust school, and Non-Formal Basic Education (NFBE) community school). Thus, given these response options, the choice of “private” is likely to largely reflect for-profit, fee-based, secular private schools, although there may be some errors of inclusion if parents are not able to distinguish between private and NGO, Trust, and NFBE community schools in their response to the survey. In the 2010/11 survey, only 1.5 percent and 0.4 percent of children in the four to 18 age group were reported to be in Masjid schools/Deeni Madrassas and NGO/Trust/NFBE community schools, respectively.
For the findings presented in Section 3, children are defined as students if they are reported to be in grade one or higher in any type of school. We disaggregate students by three types of school: (1) private, (2) government, and (3) other (Masjid school, Deeni Madrassa, NGO/Trust, NBFE community school). Non-students (or out-of-school children) are
disaggregated into two types: (1) those never in school, based on their response that they never attended school or that the highest grade attended was katchi (preschool); and (2) those who
7
The denominator for the percentage is the population in the four provinces and ICT. The percentage is calculated from population projection data from the National Institute of Population Studies (NIPS).
8
Excluding ICT from the analysis does not influence the patterns we observe in private school participation in Pakistan. In addition, given its size, and albeit territories and provinces are at the same administrative tier, it seems inappropriate to include ICT as a separate unit in any analysis where we compare patterns in private school participation across provinces. Using the 2010/11 PSLM survey, we estimate total school participation and private school participation rates for the six to 10 age group of 89 percent and 33 percent respectively for ICT, which are higher than in each of the provinces. In any analysis of schooling, what might be more appropriate is to compare ICT to the provincial capitals or other major urban centers in the country.
7
dropped out, based on their response that they are currently not in school and the highest grade they attended was grade one or higher.
9For the findings presented in Section 4 and later, children are defined as students only if they are reported to be in grade one or higher in either private or government school, and we disaggregate students into these two types of schools only.
We examine private school participation for children in two age groups: six to 10 and 11 to 15. The age groups correspond to the official ages for primary schooling (grades 1 to 5) and secondary schooling (grades 6 to 10), respectively (Government of Pakistan, Ministry of
Education 2009). In the 2010/11 survey, there were 76,806 children in the six to 10 age group in 42,606 households, and 61,623 children in the 11 to 15 age group in 37,620 households.
10The private school participation rate for a given age group is defined as the share of children in that age group that is in private school. The private school share of enrollment for a given age group is defined as the share of students in that age group that is in private school. The characteristics of children we examine comprise of (1) gender, (2) age, (3) household location in terms of urban/rural and district, (4) household wealth measured by household asset index quintiles, (5) the completed education level of the household head (to which we loosely refer as the “education level of the household”), (6) total household size, and (7) the number of school- age children in the household (see Table 1 for the manner in which variables were defined and constructed). All statistics are estimated accounting for survey sampling weights and, where relevant, clustering at the PSU level.
3. The extent of private school participation
In the context of Pakistan, the extent of private schooling—both in absolute terms and relative to the extent of other types of schooling—has to be referenced against the extent of schooling in general. The backdrop is one in which a large share of children simply do not go to school.
11The
9
For those having dropped out of school, the surveys do not ask what type of school the individual last went to.
Thus, we cannot examine whether the rates of exit from schoo l differ by school type.
10
There are children in the six to 10 age group that are in katchi (preschool). In 2010/11, 8.4 percent of children in the six to 10 age group were reported to be in katchi. For the purposes of our analysis, these children are assigned out-of-school status as, in practice, katchi typically serves as institutional childcare rather than formal, structured preschool education.
11
We can rule out the lack of school availability as a primary general explanation for low school participation in Pakistan. Using the 2010/11 survey data, we find that 84 percent of households with children in the six to 10 age group reside within fifteen minutes of the nearest primary school, but less than two-thirds of them send all of their children to school. Government schooling is also free, apart from nominal monthly contributions to funds that may
8
level of school participation in Pakistan is low relative to that of other countries in South Asia, but also in relation to other countries at its per-capita income level. Moreover, the country is likely to fall substantially short of the 2015 United Nations Millennium Development Goal of universal primary education.
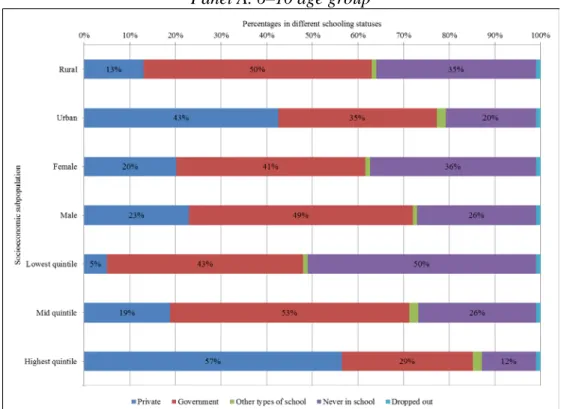
Distribution of children across schooling statuses at the country level
Figure 1 depicts the distribution of children in age groups six to 10 (Panel A) and 11 to 15 (Panel B) in 2010/11 across five schooling statuses for the country as a whole. The schooling statuses are (1) in private school, (2) in government school, (3) in other types of schools, (4) never went to school, and (5) dropped out of school. At the country level, about one-third of children in the six to 10 age group are not in school. Specifically, 31 percent of children have never gone to school, while a negligible percentage has dropped out. Forty-five percent of children are in government school, while most of the remaining children—22 percent—are in private school.
Given the sizeable share of children that are not in school, the private school participation rate of 22 percent translates into a private school share of enrollment of 32 percent.
The picture remains roughly the same for children in the 11 to 15 age group. One-third of these children are not in school. Specifically, 12 percent of children have dropped out, whereas 22 percent have never gone to school. Forty-six percent are in government school. Eighteen percent are in private school, which is a few percentage points lower than the corresponding rate for the six to 10 age group. Again, given the sizeable share of children that are not in school, the private school participation rate of 18 percent translates into a private school share of enrollment of 27 percent.
Private school participation rates across provinces
be operated by schools. These estimates tell us that there are factors other than pure distance to school––to which we know households are sensitive (see, e.g., World Bank 2005)––and the direct cost of schooling that are behind the sizeable shortfall in school participation. The primary cause is likely related to the attributes and output of available schools (i.e., the features of service delivery), which raise costs and reduce benefits for households. The documented low level of student achievement would be key among them, making schooling an unwise investment decision in a standard economic decisionmaking framework, leading especially poor households to opt out of schooling (for all children or selectively for some children), given that their choice set in terms of school options may be particularly inferior. Indeed, over two-thirds of out-of-school children in the six to 10 age group come from households in the bottom two wealth quintiles.
9
Figure 1 also depicts the distribution of children in age groups six to 10 (Panel A) and 11 to 15 (Panel B) in 2010/11 across five schooling statuses, separately by province. For the six to 10 age group, Punjab has the highest private school participation rate at 27 percent, followed, in
descending order, by Sindh (18 percent), KP (16 percent), and, trailing by a large distance, Balochistan (3 percent). The government school participation rate does not differ across
provinces to the same extent; the rates vary between 44 and 49 percent. The lower private school participation rates in Sindh, KP, and Balochistan relative to Punjab’s are accompanied by higher out-of-school rates in these provinces, which imply that the relative difference in the private school share of enrollment between these provinces and Punjab is smaller.
The patterns across provinces for the six to 10 age group are qualitatively similar for the 11 to 15 age group; province rankings in terms of the private school participation rate are the same as noted above, and the relative difference between provinces in the private school share of enrollment is smaller than the relative difference between provinces in private school
participation rates. While the private school participation rate is lower for the 11 to 15 age group relative to the 6 to 10 age group in Punjab (21 percent vs. 27 percent), the rates across the two age groups are roughly equivalent in each of the other provinces.
Private school participation rates across socioeconomic subgroups
Figure 2 depicts the distribution of children in age groups six to 10 (Panel A) and 11 to 15 (Panel B) in 2010/11 in the five schooling statuses, separately by (1) location (urban vs. rural), (2) gender, and (3) household wealth (lowest, middle, and highest quintiles). Private school
participation rates are substantially lower in rural areas than in urban areas; for example, for the six to 10 age group, it is 13 percent vs. 43 percent. In contrast, government school participation rates exhibit the opposite pattern: the rate is markedly higher in rural areas for the six to 10 age group (50 percent vs. 35 percent) and marginally higher for the 11 to 15 age group (48 percent vs. 44 percent).
For both age groups, private school participation rates are slightly lower (by two to three percentage points) for girls relative to boys. The size of the female disadvantage in private school participation rates contrasts with the much larger female disadvantage observed in government school participation rates. For example, for the six to 10 age group, the female-male gap in government school participation rates is –8 percentage points. Exploring further, the gender gap
10
in private school participation rates remains similarly small when we separately examine urban and rural children and children from poor (lowest wealth quintile) and nonpoor households. In contrast, the gender gap in government school participation rates is largely a result of the corresponding gender gap among rural and poor children.
12For both age groups, private school participation rates increase with household wealth quintiles. For example, for the six to 10 age group, the private school participation rate is 4 percent in the lowest wealth quintile, 20 percent in the middle quintile, and 57 percent in the highest quintile. In contrast, for both age groups, government school participation rates display an inverted-U shape in relation to household wealth, peaking for the middle quintile. In the lowest quintile, the out-of-school rate markedly exceeds the government school participation rate. In the highest quintile, the private school participation rate markedly exceeds the
government school participation rate for the six to 10 age group and marginally exceeds it for the 11 to 15 age group. These patterns are consistent with the likelihood of school participation increasing with household income and households with higher incomes purchasing higher- quality schooling, which tends to be supplied by the private market (Andrabi et al. 2008).
4. The extent of private school participation: Pakistan vs. India
While private school participation rates in Pakistan are significant in absolute terms, how do they compare to those in other parts of South Asia? We compare Pakistan to India (rather than to additional countries in South Asia) for two main reasons. First, the two countries shared a common administrative and institutional history under British rule until 1947. Second, we consider the common types of private schools in Pakistan to have sizeable counterparts in India than in other South Asian countries.
1312
Certain features of government schools may discourage poor and rural parents from sending their children—
especially their girls—to these schools. For example, private schools tend to be coeducational and staffed with female teachers (Andrabi et al. 2008, I-SAPS 2010). In contrast, a large share of government schools tends to be officially single-sex and staffed by female and male teachers accordingly. Where private or government schools are located within villages (on the periphery or centrally) also systematically differs (Andrabi et al. 2008). Poor and rural parents may be sensitive to these features, among others, contributing to the divergent results in the gender gap in school participation between the two school systems.
13
In South Asia, Bangladesh, India, Pakistan, and Sri Lanka were formerly under British rule. The representative private school in Bangladesh receives financial support from the government, which makes it different from the representative private school in Pakistan (Asadullah 2009). In Sri Lanka, virtually all private schools were nationalized in the early 1960s, and the private school system remains contained (Maurer 2012). See, for example, Dahal and Nguyen (2014) for a description of the types and prevalence of private schools in South Asian countries.
11
Comparing private school participation rates between provinces and states
Instead of comparing private school participation rates at the national level between the two countries, given that the household survey data we use are representative at a lower level, we compare the rates for provinces in Pakistan in 2010/11 to those for India’s states in 2009/10 (using the 2009/10 National Sample Survey (NSS)).
14Provinces and states can be viewed as equivalent administrative units and constitute a key level of government administration, with primary responsibility for education policy formulation and implementation. Comparing rates at the level of the province and state provides a more spatially-refined picture of observed
differences in rates between the two countries.
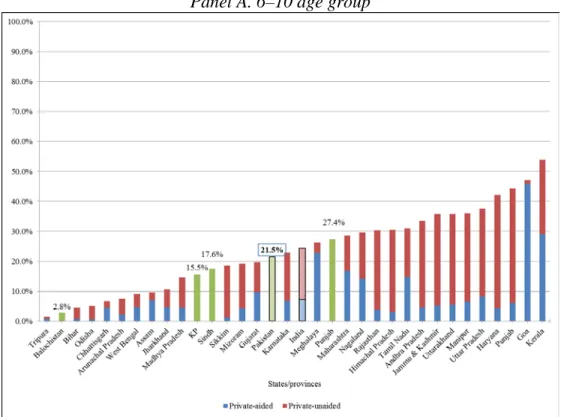
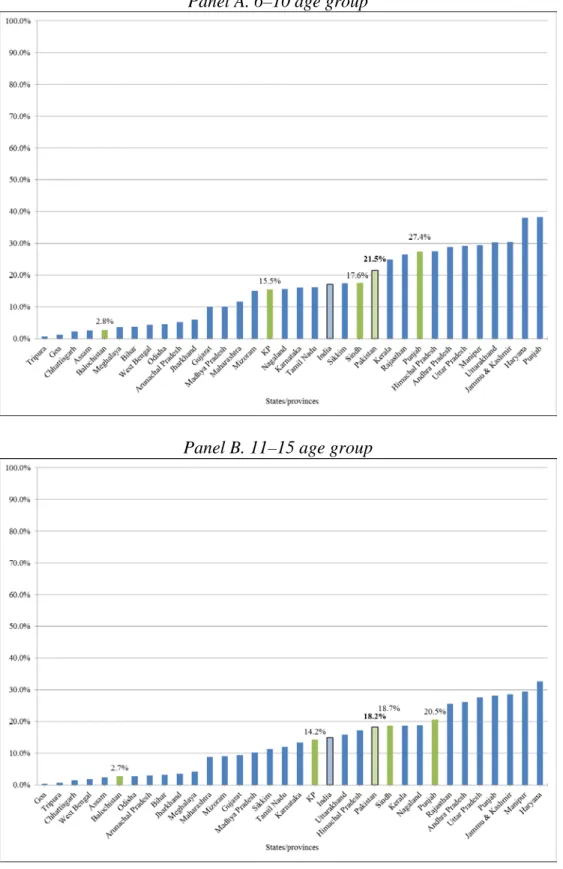
Figure 3 depicts private school participation rates for age groups six to 10 (Panel A) and 11 to 15 (Panel B), by province in Pakistan and by state in India. The states and provinces are organized in increasing order by rate. We define private schools in India as either unaided or aided. Aided schools receive financial support from the government for school salaries and nonsalary expenditures.
15The green bars depict the rates for the provinces, whereas the stacked blue-red bars—blue for aided and red for unaided—depict the rates for the states. The patterned bars with black borders depict the rates at the country level for Pakistan (green) and for India (blue-red). Similarly, Figure 4 depicts the private school participation rates for age groups six to 10 (Panel A) and 11 to 15 (Panel B), by province in Pakistan and state in India. However, here, we restrict the definition of private schools in India to unaided private schools only. The green bars depict the rates for the provinces and the blue bars the rates for the states, while the
patterned bars with black borders depict the rates at the country level for Pakistan and India. We prefer the comparison in Figure 4 because unaided private schools in India are likely to be largely equivalent to the typical types of private schools found in Pakistan.
1614
The data for India come from the Employment and Unemployment schedule of the National Sample Survey (NSS) 66th round, which is a state-representative household sample survey of 100,957 households conducted over the period from July 2009 to June 2010. Union Territories in India are excluded from the comparison.
15
Definitions for aided and unaided private schools are obtained from the NSS manual.
16
While comparing private school participation rates in Pakistan to unaided private school participation rates in India brings us closer to comparing apples to apples, differences in the school system environments between the two countries may work to drive a wedge in the comparison. The presence of an aided private school system in India may bias the size of the unaided private school system (i.e., its size may be different than if only—or largely—an unaided private school system existed in India). The size of the unaided private school system may be larger than otherwise, as, for example, unaided private schools may enter the education market seeking to become aided in the
12
When we compare private school participation rates for the provinces in Pakistan to those for states in India, where private schools in India consist of both unaided and aided schools, the rates for the provinces largely lie in the bottom half of the distribution of rates for states.
Specifically, the rate for Balochistan is at the bottom of the distribution of rates for states in India, the rates for KP and Sindh are roughly in the second quartile of the distribution, and the rate for Punjab is near the middle of the distribution. Aggregating up to the country level, the rate for Pakistan is lower than that for India. These patterns hold for both age groups.
Restricting the definition of private schools in India to unaided private schools only, the rates for provinces in Pakistan climb the ranks in the distribution of rates for states in India, and now are roughly between the bottom of the second quartile and the top of the third quartile of the distribution. In addition, aggregating up to the country level, the relative positions of the two countries reverse, with Pakistan’s rate higher than that of India. Again, these patterns hold for both age groups.
17Comparing urban and rural private school participation rates between provinces and states We also examine the distribution of private school participation rates between India’s states and Pakistan’s provinces separately for urban and rural areas. The same patterns noted above hold when we compare the countries using urban and rural rates at the province and state level.
However, relative to rural rates, the urban rates for Pakistan’s provinces move up the ranks more when we shift from examining them in the distribution of urban private school participation rates to examining them in the distribution of urban unaided private school participation rates for India’s states.
At the country level, rural and urban private school participation rates for Pakistan are below the corresponding private school participation rates for India. The rates become roughly identical between the two countries when the rural private school participation rate in Pakistan is
future. Conversely, the size of the unaided private school system may be smaller than otherwise, as, for example, aided private schools may create market conditions that hinder the entry, survival, and growth of unaided private schools. Both effects may be at play simultaneously, among others, making the net bias on size theoretically ambiguous.
17
The above findings are based on comparing private school participation rates between the two countries. The overall school participation rate is about 20 percentage points lower in Pakistan than in India. Given this, if the comparison was based on the private school shares of enrollment, the extent of private school participation in Pakistan would outstrip that of India, in both urban and rural areas.
13
compared to the rural unaided private school participation rate for India. The relative positions of the two countries switch and the gap in rates widens between the two countries when the urban private school participation rate for Pakistan is compared to the urban unaided school
participation rate in India. These findings hold for both age groups.
5. Characteristics of private school students and correlates of private school participation
Differences between private school students and other groups at the country level
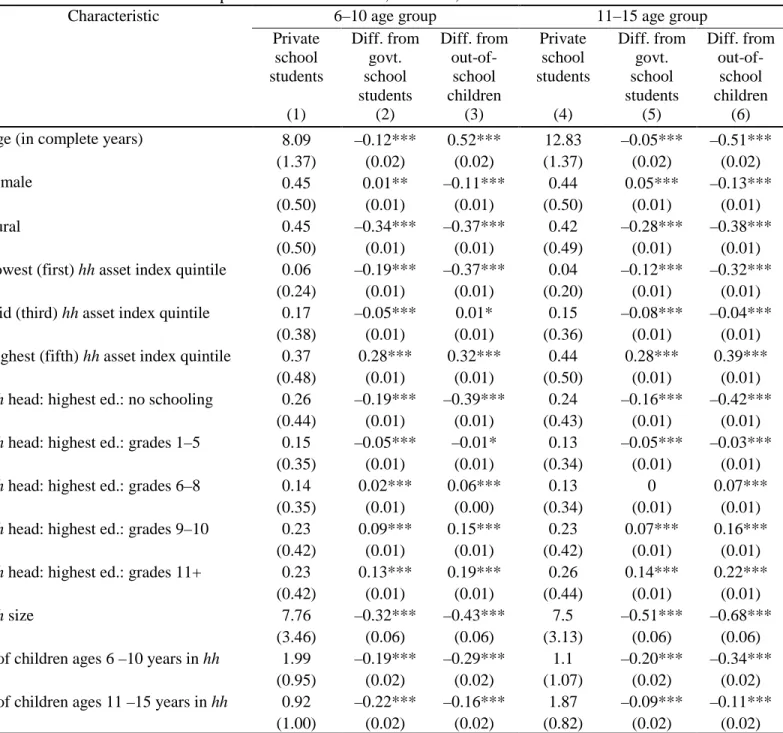
Table 2 reports estimated means and proportions for selected child and household characteristics for private school students, as well as the difference in these means and proportions from those of government school students and out-of-school children, separately for age groups six to 10 (Columns 1–3) and 11 to 15 (Columns 4 to 6), in the country as a whole. We find that private school students are more likely than out-of-school children to be male and to come from urban, wealthier, and more educated households. Private school students also come from on average smaller households and households with smaller numbers of children than do out-of-school children. The same patterns hold when we compare private school students to government school students. The one exception is gender: private school students are more likely to be female than are government school students. The size of the differences between private school students and government school students is generally smaller than between private school students and out-of- school children. These findings apply to both age groups.
Given that late entry into school is common and that the likelihood of schooling increases with age over primary school ages, for the six to 10 age group, the mean age of private school students is higher than for out-of-school children. Conversely, given that the likelihood of exiting school (dropping out) increases with age over secondary school ages, for the 11 to 15 age group, the mean age of private school students is lower than for out-of-school children. For both age groups, the mean age for private school students is lower than for government school students.
Differences between private school students and other groups across provinces
We also compare the characteristics of private school students to government school students and out-of-school children, separately by province (see Tables A1 to A4 in the Appendix). While the pattern of differences between private school students and out-of-school children that we
14
found at the country level is reflected in each of the provinces, the same does not hold true for the pattern of differences between private school students and government school students.
Country-level findings that the mean age of private school students is lower than for government school students and that private school students are more likely to be female than government school students are only consistently reflected in Punjab and Sindh, respectively. The country- level finding that private school students are less likely to come from less-educated households (no schooling, grades 1 to 5) and more likely to come from more educated households (grades 6 to 8, 9 to 10, 11+) than are government school students is reflected much less sharply in some provinces. For both age groups, the share of private school students from households with a
“mid” level of education (grades 6 to 8) is no different than for government school students in Punjab, KP, and Balochistan. Finally, the country-level finding that, on average, private school students come from smaller households than do government school students is only consistently reflected in Punjab and Sindh.
18Differences in the composition of private school students across provinces
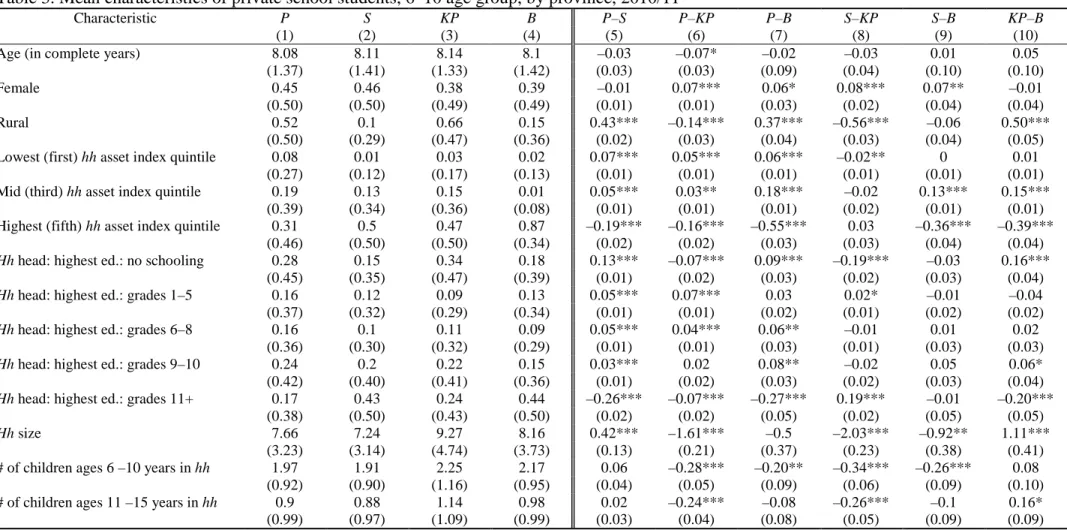
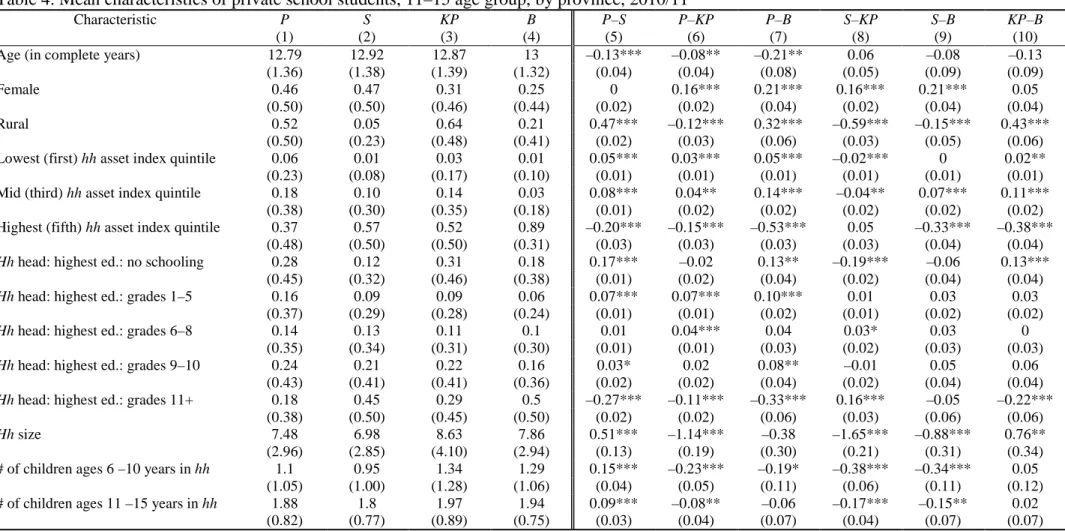
Tables 3 and 4 present estimated means and proportions of selected characteristics of private school students in age groups six to 10 and 11 to 15, respectively, in each of the four provinces, and compare the differences in these means and proportions between private school students in each of the provinces. Private school students are more likely to be female in Punjab and Sindh than in Balochistan and KP, and private school students are much more likely to come from rural households in Punjab and KP than in Sindh and Balochistan. Sindh is a particularly extreme case: only 10 percent or less of private school students in the six to 10 and 11 to 15 age groups come from rural households. Private school students in Punjab are more likely to come from households in the lower wealth quintiles than in each of the other provinces. Balochistan is
18
Although we do not provide tables with the estimated results in the paper, we also fit multinomial probit regression models via maximum likelihood to the data to examine child and household correlates of the conditional likelihood of (1) being a government school student or (2) being an out-of-school child relative to the base status of (3) being a private school student. The regressions are run separately by age group, for the country as a whole as well as for each of the provinces. We find several cases of weakening or absence of statistical significance in the conditional associations relative to the unconditional differences. We suspect that this may partly be due to the presence of multicollinearity in the multiple regressions, given the types of covariates we use, which would increase the likelihood that we fail to reject a false null hypothesis (Type-II error). We also find a few conditional associations pick up significance vis-à-vis the unconditional differences: for example, we are able to pick up more frequently that private school students are younger than government school students across the provinces.
15
considerably more top-heavy than the other provinces: close to 90 percent of private school students in the 6 to 10 and 11 to 15 age groups in the province come from households in the highest wealth quintile. Private school students in Punjab and KP are more likely to come from less-educated households than in Sindh and Balochistan. On one end, private school students in Sindh come from smaller households than in each of the other provinces; on the other end, private school students in KP come from larger households than in each of the other provinces.
To be sure, many of our findings on the pattern of inter-province differences in the composition of private school students apply to government school students as well. The inter- province differences in the composition of private school students are however much larger than the inter-province differences in the composition of government school students with respect to certain characteristics, such as location (urban vs. rural), household wealth, and household head’s education level.
6. The distribution of private school students across districts
In Section 3, we examined the differences in private school participation rates across provinces and between urban and rural areas and found that the private school participation rate is highest in Punjab and higher in urban than rural areas. In this section, we further explore the spatial distribution of private school participation by measuring the distribution of private school students across districts, which is the lowest level of representativeness of our survey data.
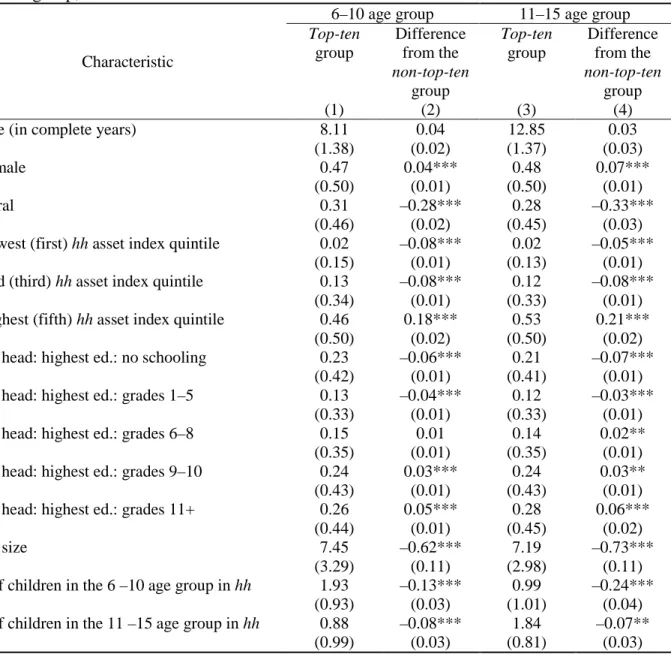
In examining the share of private school students at the district level, we find that private school participation is highly concentrated in Pakistan. Ten districts (out of the 113 districts in the four provinces) account for over 50 percent of private school students in the six to 10 and 11 to 15 age groups in the country. Table 5 reports summary statistics on the socioeconomic
characteristics of these “top-ten” districts (referred to as the top-ten group), and compares them to the remaining districts as a whole (referred to as the non-top-ten group). For both age groups, private school participation is substantially overrepresented in the top-ten group: the group’s collective share of the total private school student population is roughly double its collective share of the total child population in the country. Consequently, private school participation rates are higher in the top-ten group relative to the non-top-ten group for both age groups. In contrast, government school participation rates are lower in the top-ten group relative to the non-top-ten group for both age groups. In terms of socioeconomic characteristics, the top-ten group is more
16
urban and wealthier (measured by the mean value of the household asset index) than the non-top- ten group. District-level information on the percent of private school students, the private school participation rate, the percent of the child population, and other selected socioeconomic
characteristics are provided in Tables A5 and A6 in the Appendix for age groups six to 10 and 11 to 15, respectively.
While it may not necessarily be the case, the systematic differences in the socioeconomic characteristics of districts between the top-ten group and the non-top-ten group are accompanied by similar systematic differences in the socioeconomic characteristics of private school students between the top-ten and non-top-ten groups. Table 6 reports estimated means and proportions for selected characteristics of private school students in the top-ten group, and the difference in these means and proportions from those of private school students in the non-top-ten group, separately for age groups six to 10 (Columns 1–2) and 11 to 15 (Columns 3–4). For both age groups, private school students in the top-ten group (1) are more likely to be female, (2) are more likely to come from urban, wealthier, and more educated households, and (3) come from smaller households than their counterparts in the non-top-ten group. For both age groups, the mean age of private school students is however not statistically different between the top-ten and non-top- ten groups.
The districts in the top-ten group are themselves spatially concentrated. Apart from Karachi and Peshawar (which are in Sindh and KP, respectively), the remaining districts in the top-ten group are in Punjab. With the exception of Multan, the districts in the top-ten group in Punjab are largely clustered in the northeastern part of the province. Figures 5 and 6 depict the districts in Pakistan divided into three groups for private school students in age groups six to 10 and 11 to 15, respectively: (1) top-ten districts, (2) non-top-ten districts where the individual district shares of private school students are equal to or greater than 1 percent, and (3) non-top- ten districts where the individual district shares of private school students are less than 1 percent.
In general, spatial patterns point to the predominance of districts in Punjab in accounting for the location of private school students: the first two groups (top- ten and ≥1 percent groups) are largely composed of districts from Punjab, while the third group (<1 percent group) is largely composed of districts from the other three provinces.
7. Distribution of private school participation among children within households
17
Thus far in the paper, we have described private schooling for all households with children in our age groups of interest, abstracting a child’s own schooling status from that of other children in her household. In the ensuing analysis, we restrict our attention to households with multiple children in the age groups of interest and examine the schooling decisions of these households for their children, specifically in terms of the extent of private schooling among children within households.
19Decomposition 1: Between- and within-household breakdown of the variation in private school participation among children
Table 7 presents standard analysis-of-variance estimates of the extent to which differences in school participation among children is attributable to differences among children across households (between-household variation) vs. differences among children within households (within-household variation), separately by school type (private vs. government) and by
province, for age groups six to 10 (Panel A) and 11 to 15 (Panel B).
20Estimations are performed on samples of households with at least two children in the relevant age group and at least one of them in school. For decomposing the variation in private school participation among children, the outcome variable is set equal to one if a child goes to private school, and to zero if otherwise.
Likewise, for decomposing the variation in government school participation among children, the outcome variable is set equal to one if a child goes to government school, and to zero if
otherwise.
Private school participation is largely a phenomenon that varies from one household to the other rather than within households. At the country level, 82 percent and 79 percent of the variation in private school participation among children in the six to 10 and 11 to 15 age groups, respectively, is due to between-household variation (i.e., most parents choose to send all or none
19
The analysis does not strictly examine the distribution of private schooling among siblings, because the PSLM survey only provides information on the relation of household members to the household head. Thus, we cannot ascertain the sibling relations of children in the household that are not children of the household head.
20
The extent of total variation in school participation due to between-household variation is likely to be underestimated, as the extent due to within-household variation subsumes statistical noise. Elbers, Lanjouw, Mistiaen, and Ozler (2008) argue that between-group inequality for a certain decomposition should not be benchmarked against total inequality (which is equivalent to between-group inequality when all groups are simply individuals or households) but against a “maximum” between-group inequality that is derived when the number and relative sizes of groups for that decomposition are unchanged; this maximum between-group inequality would always be weakly smaller than total inequality. This, too, would imply that the extent of total variation in school participation due to between-household variation is likely to be underestimated.
18
of their children to private school instead of sending some of their children to private school). In comparison, at the country level, relatively lower shares of the variation in government school participation among children—specifically, 66 percent and 60 percent for the six to 10 and 11 to 15 age groups, respectively—are due to between-household variation (i.e., the percentage of parents that send all or none of their children to private school exceeds the percentage of parents that do the same in relation to government schooling). These findings are qualitatively similar across provinces and age groups. The difference in the percentage due to between-household variation between private school participation and government school participation is smallest in Punjab and largest in Balochistan. In Balochistan, the percentage of total variation in private school participation for the six to 10 age group due to between-household variation is 88 percent, while the corresponding statistic with respect to government school participation is 44 percent, which represents a minority share.
Decomposition 2: Breakdown of households by the extent of private school participation among children within households
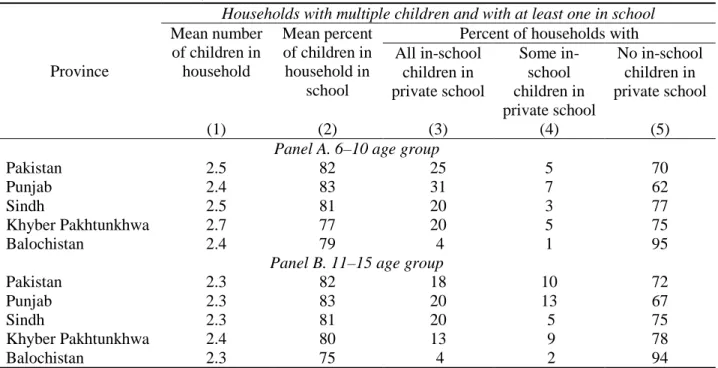
We also examine the distribution of households in terms of the extent of private school participation among in-school children. Table 8 presents estimated shares from decomposing households with multiple children and at least one child in school into three mutually-exclusive groups based on the extent of private school participation among children that are in school, separately for age groups six to 10 (Panel A) and 11 to 15 (Panel B) and by province. The three groups are (1) all in-school children in the relevant age group go to private school, (2) some in- school children in the relevant age group go to private school (and the other children go to government school), and (3) none of the in-school children in the relevant age group go to private school (all of the in-school children go to government school). The three groups are denoted by type A (A for all), type S (S for some) and type N (N for none), respectively.
This alternative decomposition basically reproduces the earlier finding that private school participation varies mainly among households. When households with multiple children send at least one child to school, they tend to send more than one child to school. Examining the six to 10 age group, 25 percent, 5 percent, and 70 percent of households are type-A, type-S, and type-N, respectively. The same pattern of the relative shares of household types holds for the 11 to 15 age group and in each of the provinces. The distribution of households by type varies across
19
provinces, particularly between Punjab and Balochistan. For example, for the six to 10 age group, 31 percent and 7 percent of households are type-A and type-S in Punjab, respectively; the corresponding statistics for Balochistan are 4 percent and 1 percent, respectively.
Differences among households in types A, S, and N
Table 9 reports estimated means and proportions for selected household-level characteristics for the three types of households in Pakistan, separately for age groups six to 10 (Columns 1–3) and 11 to 15 (Columns 4–6). In moving from type-A to type-S to type-N, households tend to become progressively more rural, more poor (lowest wealth quintile), less rich (highest wealth quintile), more poorest educated (no schooling), and less highest educated (secondary schooling and higher). These patterns apply to both age groups. Although we do not provide the statistics in the paper, the country-level findings are also generally reflected in each of the provinces.
The pattern noted above is broadly consistent with the pattern of change in the socioeconomic characteristics of children when we shift from private school students to
government school students as noted in Section 5. This similarity underscores the predominant role of household-level differences in driving child-level differences across schooling statuses.
Correlates of private school participation within households
Finally, we examine whether the age and gender of the child are associated with private school participation when we examine the conditional relationship between the two variables within households. Table 10 reports parameter estimates for age and gender by estimating private school participation regressions via Ordinary Least Squares (Limited Probability Model), first accounting for differences in household location, wealth, household head’s education, size, and numbers of children in different age groups, and second with household-fixed effects. These regressions are run for age groups six to 10 (Panel A) and 11 to 15 (Panel B), separately, both for the country as a whole and by province. The outcome variable is set equal to one if the child goes to private school, and to zero if otherwise. Note that, under this definition, zero denotes both government schooling and out-of-school status in the outcome variable.
At the country level, accounting for differences in household-level covariates, girls in both age groups tend to have a lower likelihood of private school participation and older children in the six to 10 (11 to 15) age group tend to have a higher (lower) likelihood of private school
20
participation. The same patterns remain when the associations are identified by looking among children within their households only.
21Examining the associations separately by province, the findings at the country level related to the conditional female disadvantage in private school participation are reflected in Balochistan, KP, and Punjab. The size of the conditional female disadvantage in private school participation is largest in KP.
22Depending on the age group and province, the percent of total variation in private school participation explained by the regressions rises from 10 to 37 percent when we include
household-level covariates, and 55 to 80 percent when we include household-fixed effects, suggesting that a substantial portion of the variation in private school participation is explained by factors (both observed and unobserved) that vary at the household level and higher. This finding is consistent with what we discovered earlier from the decompositions of the extent and pattern of variation in private school participation among children within households.
8. Evolution of private school participation rates over the 2000s
In this section, we turn to an exploration of how the extent and nature of private school participation has evolved in the 2000s. Table 11 presents the change in overall school
participation rates and the change in private school participation rates (both in percentage point terms), as well as the contribution of the change in private school participation rates to the change in overall school participation rates (constructed as a ratio and expressed in percent terms) over the twelve-year period from 1998/99 to 2010/11. The statistics are estimated for the country, by province (Panel A), and by socioeconomic subgroup (Panel B), for age groups six to 10 (Columns 1–3) and 11 to 15 (Columns 4–6). Note two measurement-related points. First, we refer to the absolute percentage point change in rates as “growth.” Second, the growth is in net terms, as there are flows both into and out of (private) school participation status at any given point in time.
21
Our finding that the significant female disadvantage in private school participation continues to hold when we examine the relationship between gender and private school participation within households updates and confirms Aslam’s (2009) finding of a female disadvantage in private school participation within households using national household sample survey data from 2001/02.
22
We also ran regressions with household-fixed effects where the outcome variable was set equal to one if the child goes to private school and to zero if the child goes to government school, and found a similar pattern of a conditional female disadvantage in private school participation in Balochistan, KP, and Punjab. The size of the conditional female disadvantage was particularly large for both age groups in KP and for the 11 to 15 age group in Balochistan.
21
The table is accompanied by figures in the Appendix (Figures A1 to A4) that plot the change in overall vs. private school participation rates over the period 1998/99 to 2010/11 using eight rounds of national household sample survey data (PIHS and PSLM surveys), separately for the country as a whole, by province, and by selected socioeconomic subgroup (female, male, rural, urban). In the figures, actual rates are denoted by hollow circles. The trend lines are estimated via a locally-weighted least-squares smoother.
Growth in private school participation rates
We first examine the growth in overall and private school participation rates over the period 1998/99 to 2010/11 at the country level and for each province. At the country level, overall school participation rates grew by 17 and 14 percentage points for the six to 10 and 11 to 15 age groups, respectively. Over the same period, private school participation rates grew by 9
percentage points for both age groups. In KP, Punjab, and Sindh, overall and private school participation rates grew markedly. In Balochistan, while the overall school participation rate for the six to 10 age group grew significantly (12 percentage points), the corresponding rate for the 11 to 15 age group grew much less (4 percentage points). In addition, private school participation rates in Balochistan were virtually stagnant (1 percentage point) for both age groups.
At the country level, depending on the age group, the growth in private school participation rates contributed equally—or more so than the growth in government school participation rates—to the growth in overall school participation rates over the period. At the province level, the growth in private school participation rates accounts for the majority of the growth in overall school participation rates in Punjab for both age groups, in Sindh for the 11 to 15 age group, and in KP for the six to 10 age group. In Balochistan, Punjab, and Sindh, the contribution of the growth in the private school participation rate to the growth in the overall school participation rate is higher for the 11 to 15 age group than for the six to 10 age group.
Next, we examine the growth in rates over the period 1998/99 to 2010/11 by selected socioeconomic subgroups. Except for households in the highest wealth quintile (where overall school participation rates were relatively high to begin with), overall school participation rates grew by 10 to 20 percentage points for all subgroups, with higher growth for rural relative to urban households, girls relative to boys, and households in the middle wealth quintile relative to those in the lowest and highest wealth quintiles.
22
All socioeconomic subgroups also saw a significant increase in private school participation rates. However, in contrast to the finding for overall school participation rates, private school participation rates grew more for boys, urban households, and households in the highest wealth quintile—subgroups which are traditionally more socioeconomically advantaged.
In the case of urban households and households in the highest wealth quintile, depending on the age group, the growth in the private school participation rates accounts for almost all or more than the growth in school participation rates, suggesting net gains to the private school system from students shifting from government to private schooling. Finally, the contribution of the growth in the private school participation rate to the growth in the overall school participation rate is roughly the same or larger across socioeconomic subgroups for the 11 to 15 age group relative to the six to 10 age group.
Change in the composition of private school students
Given the significant growth in private school participation rates in certain parts of the country and across the selected socioeconomic subgroups, we examine whether the composition of private school students has systematically changed over the period. Table 12 reports estimated means and proportions of selected characteristics of private school students, the changes in means and proportions over the twelve-year period from 1998/99 to 2010/11, as well as the changes in means and proportions in the last half of the period, from 2004/05 to 2010/11, separately for age groups six to 10 (Columns 1–3) and 11 to 15 (Columns 4–6).
For both the six to 10 and 11 to 15 age groups, the share of private school students from rural households rose, while the share from households in the highest wealth quintile (rich households) fell. Although we found earlier that the private school participation rates grew more for urban than for rural households and more for rich than for nonrich households, urban and rich households represent a minority of the total household population. As a result, the growth in private school participation rates among rural and nonrich households was sufficient to lead to a less unequal composition of private school students.
We also find that the share of private school students from households with the lowest level of education fell, while the share from households with the highest level of education rose, with both changes occurring in the later 2000s. These findings are probably attributable to some extent to the increasing education level of households in general over the period, with changes
23
concentrated at the low and high ends of the education attainment range. In addition, we find that the average number of members and number of children in the households to which private school students belong declined. This may be explained to some extent by declining household fertility rates in Pakistan in general. We do not find a change in the share of private school students that are female. All of these findings hold for both age groups.
Finally, we examine the ways in which the socioeconomic characteristics of private school students have changed, separately by province (see Tables A7 to A11 in the Appendix).
For Balochistan, we only estimate changes for the period 2004/05 to 2010/11, as the 1998/99 household survey is only representative at the province level and does not provide sufficient observations to obtain reliable estimates for the subgroups. The patterns of change at the country level are mainly reflected in Punjab. They are, however, not consistently observed in other provinces, where the changes are at times smaller and not statistically significant. Contrary to the finding at the country level of no change in the female share of private school students, for the 11 to 15 age group, the corresponding share rose in Sindh, whereas it fell in Balochistan (in the period 2004/05 to 2010/11).
9. The role of private school supply
The private (government) participation rate reflects the equilibrium point between the levels of private (government) schooling demanded and supplied. Using data from the 2005 National Education Census (NEC), a survey conducted by the Pakistan Ministry of Education and the former Federal Bureau of Statistics, which attempted to capture some basic information on all government and private schools in the country, we examine whether patterns in the spatial variation in school supply by school type may be related to the patterns in the spatial variation of school participation rates (equilibrium values) by school type.
23Before turning to the findings, we note that both market and policy explanations are potentially behind the observed spatial distribution of private and government schools. For example, the Pakistan government has had a longstanding policy of expanding school availability by constructing government schools across registered communities that meet
23