Report No: 32273-BT
Bhutan
Human Development Indicators: Analysis of Current Situation Using the BLSS
May 16, 2005
Human Development Unit South Asia Region
Document of the World Bank
Public Disclosure AuthorizedPublic Disclosure AuthorizedPublic Disclosure AuthorizedPublic Disclosure Authorized
CURRENCY EQUIVALENTS US$1.0 = 43 Nu
FISCAL YEAR July – June
ABBREVIATIONS AND ACRONYMS ALMP Active labor Market Program BHU Basic Health Unit
BLSS Bhutan Living Standard Survey FYP Five Year Plan
GRE Gross Enrollment Rates
ILO International Labour Organization MDG Millennium Development Goal MMR Maternal Mortality Rate MOE Ministry of Education MOH Ministry of Health MOF Ministry of Finance MOL Ministry of Labour NER Net Enrollment Rates NFE Non Formal Education
NPPF National Pension and Provident Fund PCR Primary Completion Rates
RGOB Royal Government of Bhutan
UNDP United Nations Development Program UPE Universal Primary Education
U5M Under Five Mortality WFP World Food Program
Vice President : Praful C. Patel Country Director : Alastair McKechnie Sector Director : Julian Schweitzer Sector Manager : Mansoora Rashid Task Team Leader : Corinne Siaens
TABLE OF CONTENT
PREFACE...6
ACKNOWLEDGEMENTS...7
EXECUTIVE SUMMARY ...8
CHAPTER 1. EDUCATION ...15
I. OVERALL PROFILE AND OBJECTIVES ...15
II. SUPPLY SIDE: WHAT ARE THE PROBLEMS AT SCHOOL? ...23
III. DEMAND SIDE: REASONS FOR NOT ATTENDING CLASSES ...25
IV. DETERMINANTS OF SCHOOL ATTENDANCE AND PRIMARY SCHOOL COMPLETION...27
V. RETURNS TO EDUCATION...30
VI. PRIVATE EDUCATION EXPENDITURE ...32
VI. SUMMARY...32
CHAPTER 2. HEALTH ...34
I. CHILD HEALTH ...34
II. MATERNAL MORTALITY AND HEALTH ...39
III. NUTRITION...43
IV. SUPPLY AND DEMAND OF PUBLIC HEALTH SERVICES ...45
V. SUMMARY...50
CHAPTER 3. SOCIAL PROTECTION ...52
I. POVERTY INCIDENCE AND PROFILE ...52
II. DETERMINANTS OF POVERTY ...55
III. POOR AND VULNERABLE GROUPS...58
IV. COPING STRATEGIES ...70
VIII. SUMMARY ...74
REFERENCES ...76
ANNEX 1: Education ...78
ANNEX 2: Health...87
ANNEX 3: Social protection ...89
LIST OF TABLES Table 1: Reported literacy rates in any language, by age and gender, 2003 ...17
Table 2: Reported literacy rates for children and adults above 6 years in any language, by area and consumption quintile, 2003...17
Table 3: Entry rates, net and gross enrollment rates by area, gender and levels of schooling, 2003 ...18
Table 4: Entry rates, net and gross enrollment rates by region and levels of schooling...19
Table 5: Entry rates, net and gross enrollment rates by consumption quintiles and levels of schooling ...21
Table 6: School attendance and share of students in right level for their age, by area, gender and age groups, 2003 ...22
Table 7: Primary completion rates by age group, area and gender...22
Table 8: Problems at school, by education level, area and public/private (in percent) ...24
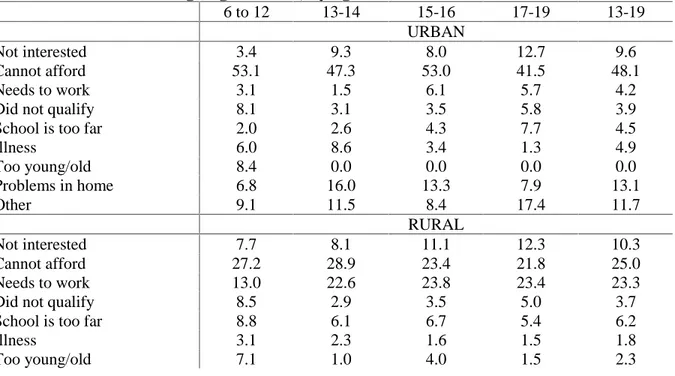
Table 9: Reasons for not going to school, by age and area ...25
Table 10 Reasons for not going to school, by age and gender ...26
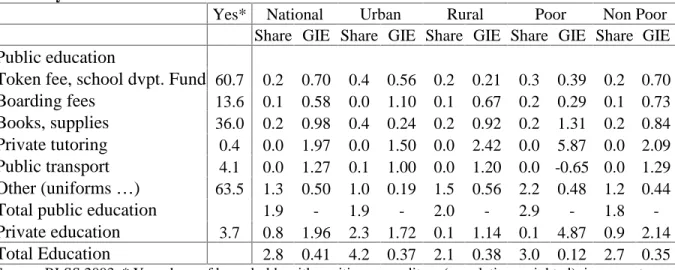
Table 11: Share of education expenditure in total consumption (in percent) and Gini Income Elasticity. ...32
Table 12: Incidence of child mortality, per 1000 live births, 1984, 1994, 2000 ...34
Table 13: Incidence of stunting and underweight, nationally, boys and girls. ...35
Table 14: Causes of death in children under five years of age, in percentage, 2000...35
Table 15: Access to energy, by area and by poor/non poor (in percent), 2003 ...36
Table 16: Access to safe water, by area and by poor/non poor (in percent), 2003...37
Table 17: Access to sanitation, by area and by poor/non poor, 2003 ...38
Table 18: EPI coverage, in percentage ...38
Table 19: Reasons for incomplete immunization or no immunization...39
Table 20: Incidence of child mortality, per 1000 live births, 1984, 1994, 2000 ...40
Table 21: Prenatal care and place of delivery, 2003...40
Table 22: Complications during pregnancy, in percentage. ...42
Table 23: Use of modern contraception methods, 2003 ...42
Table 24: Methods of contraception used in Bhutan ...43
Table 25: Share of households suffering from hunger and nutritional deficiencies. ...44
Table 26: Share of different food items in total budget and food budget (in percent) ...44
Table 27: Demand for health care, by area and by poor/non poor ...48
Table 28: Determinants of demand for health care, marginal impact ...49
Table 29: Satisfaction towards BHUs or hospitals, by area and by quintile (in percent) ...50
Table 30: Poverty incidence for selected groups, by characteristics of the household head. ...52
Table 31: Poverty incidence, by region and district. ...53
Table 32: Incidence of poverty in rural areas for those living more than an hour away from different facilities. ...54
Table 33: Number of hectares of land, by characteristics of the household head. ...54
Table 34: Use and satisfaction towards public transport, by area and quintile, in percent...57
Table 35: The most important action the government should take...58
Table 36: Status, by age, area and gender (in percent) ...61
Table 37: Sector of activity, by age, area and gender (in percent) ...62
Table 38: Share of children working and type of activity by age, area and gender ...62
Table 39: Impact of work on schooling, children 15-19...63
Table 40: Share of households suffering from hunger and self assessment, by area. ...63
Table 41: Poverty and activity, by age group ...64
Table 42: Characteristics of the 20-25 years old ...65
Table 43: Determinants of employment, 17-25 years, marginal impact ...68
Table 44: Characteristics of the elderly (60+) ...69
Table 45: Three main sources of income of the elderly ...69
Table 46: Importance and use of transfers...71
Table 47: Share of people who temporarily migrate, by area, gender and quintile...72
Table 48: Characteristics of the migrants (above 15 years)...73
Table 49: Sources of credit and share of population with debts (in percent) ...74
Table 50: Problems at school, by age group and area ...78
Table 51: Problems at school, by age group and gender ...78
Table 52: Problems at school, by age group and consumption quintile ...79
Table 53: Reasons for not going to school, by age and consumption quintile ...80
Table 54: Determinants of School attendance and Primary school completion, by age group
and area. ...82
Table 55: Determinants of ever entering the school system, by area. ...85
Table 56: Incidence of stunting and underweight...87
Table 57: Prevalence of Underweight, 1990-2002 ...88
Table 58: Poverty incidence, by district. ...89
Table 59: Impact of household composition on per capita consumption (in logarithm), on poverty and on hunger ...92
Table 60: Impact of education on per capita consumption (in logarithm), on poverty and on hunger ...93
Table 61: Impact of employment characteristics on per capita consumption (in logarithm), poverty and hunger ...93
Table 62: Impact of location and remoteness on per capita consumption (in logarithm), poverty and hunger ...94
LIST OF FIGURES Figure 1: School attendance, by age and area, 2003...19
Figure 2: School attendance, by age and gender, Bhutan 2003 ...20
Figure 3: Share of the population having access to safe drinking water ...37
Figure 4: Number of medical staff, BHUs and hospital beds, 1989-2002...45
Figure 5: Number of medical staff and hospital beds per 10,000 persons, 1989-2002 ...46
Figure 6: Male and Female Population by Age, 2003 ...59
Figure 7: Incidence of work, 10 to 19 years old, by gender and area...60
Figure 8: Activities of 20-25 years old men, urban rural areas ...66
LIST OF BOXES Box 1: The Bhutan Living Standard Survey...9
Box 2: The Ninth Five Year Plan and the Education Sector ...15
Box 3: Statistical capacity and reporting on education indicators...16
Box 4: Statistical capacity and reporting on maternal health indicators...41
Box 5: The Ninth Five Year Plan and the Health Sector...46
Box 6: The Ninth Five Year Plan and Poverty ...55
Box 7: The Ninth Five Year Plan and Employment ...67
Box 8: The use of multivariate regressions to analyze the determinants of poverty ...90
PREFACE
This report lays out the challenge of Human Development in Bhutan. It is based on the first nationally-representative household survey, the Bhutan Living Standard Survey (BLSS), collected between April 2003 and June 2003.
Initially, this work was intended to take the form of a Millennium Development Goal (MDG) report, integrated in the series of MDG reports for the South Asia Region. However, after a mission to Thimphu in October 2004, and in consultation with sector and country management, it was decided that the report would become a situation analysis of some human development indicators instead of an MDG report. There were two main reasons for this change in scope. First, Bhutan had already released an MDG report in 2002 in collaboration with UNDP. Second, the BLSS offered new information on some education, health and poverty issues which had not yet been analyzed in the MDG report and the analysis of which was considered useful for informing the Bank’s work in Bhutan.
The report’s primary objective is to inform the Bank of the current situation regarding some human development indicators. The report is partly filling in the knowledge gap on key human development indicators in Bhutan and will hopefully guide future policy directions.
Some sections of the report have already been used as an input for the Country Assistance Strategy (CAS). On the demand side, the Ministry of Education in Bhutan had requested World Bank’s assistance to help cost the Education MDG and other sector objectives. This analysis was competed and delivered in Thimphu in January 2005 (and the analysis of the education sector laid out in the first chapter of this report formed an integral part of this presentation). The Ministry of Health did not express interest in the Bank’s assistance in the analysis of the health sector using the BLSS data. However, the RGOB did express interest in Bank input addressing old age security and emerging youth unemployment and the report constitutes an initial step informing the dialogue.
The Monitoring and Evaluation unit of the Department of Planning is currently updating the 2002 MDG report with the help of UNDP. It is still possible that the present report can provide some input to this work, though the RGOB has not yet formally requested our assistance.
ACKNOWLEDGEMENTS
This Report was prepared by Corinne Siaens (TTL) under the overall guidance of Mansoora Rashid (Manager, Social Protection, SASHD), Julian Schweitzer (Sector Director, SASHD) and Alastair McKechnie (Country Director for Afghanistan, Bhutan and Maldives). The education chapter of this report benefited greatly from the extensive comments received from the staff of the Policy and Planning Division of the Ministry of Education in Thimphu at a dissemination seminar. The report could not have been written without the National Statistical Bureau for their assistance in providing the Bhutan Living Standard Survey to the team. Inputs from Kin Bing Wu, Mark La Prairie, Mariam Claeson and Hnin Hnin Pyne are gratefully acknowledged. Gertrude Cooper provided excellent assistance to finalize this report.
EXECUTIVE SUMMARY
Introduction
1. Bhutan has achieved enormous progress and witnessed unparalleled political, social and economic reforms since its opening to the modern world a few decades ago. Thanks to hydropower, donor support and prudent macroeconomic management, GDP has grown at an average rate of 6 percent a year over the past twenty years. But more important than the prospect for economic growth, the guiding philosophy of the country, “National Happiness”, has ensured that the country would respect a natural balance between the creation of material prosperity and the respect of spiritual, cultural and social values. With this vision and deep commitment to human development, Bhutan has expanded access to education, health, information and markets. His Majesty the King has initiated a decentralization process in 1981 whereby the Bhutanese people are always more empowered; a process which will culminate soon when Bhutan becomes a constitutional monarchy. Peace and preservation of the natural resources and cultural heritage have always been among the priorities.
2. Bhutan now faces many challenges of nation-building and of overcoming the deprivations affecting the lives of the poor. The Ninth Five Year Plan (also accepted as the Poverty Reduction Strategy) lays out a strategy up to 2007 for addressing these challenges with five overriding objectives: (i) Improving quality of life and income, especially of the poor; (ii) Ensuring good governance; (iii) Promoting private sector growth and employment generation; (iv) Preserving and promoting cultural heritage and environment conservation;
and (v) Achieving rapid economic growth and transformation. Bhutan’s geography, rugged terrain and widely dispersed population, presents a particular challenge for the Government, as it is difficult to facilitate market based job creation and provide quality education and health services in these areas. Another challenge is that statistical capacity has also typically been weak, limited the ability of the Government to monitor progress and provide guidance to policy makers.
3. The main objective of this report is to inform the Bank on the current state of some human development indicators in the education, health and social sectors in order to better support the Government’s efforts in implementing and monitoring its development policy.
The report exploits the first nationally representative household survey in Bhutan. It builds on the current and limited literature which includes the 2002 MDG report and the 2004 Report on Poverty and Inequality. Using this data, the report is able to go beyond description and to provide an analysis of the determinants of selected outcomes such as poverty, school enrollment and completion, demand for health care or employment. In particular, the report tries to identify some links between those different sector issues.
Box 1: The Bhutan Living Standard Survey
4. However, this report does not aspire to be a comprehensive analysis of human development in Bhutan. It is also neither a full policy review, nor a detailed strategy for human development. While the coverage of the issues is broad, the focus is on providing a baseline for benchmarking progress in the future. A number of important gaps remain, resulting from lack of data or the desire to avoid duplication. In particular, there is no separate chapter on empowerment, dealing with the institutional framework for decentralization and civil society and community participation. The report also discusses only briefly the issues in setting up a statistical and monitoring system. The source of data for analysis on a particular sector is simply explained in a Box in the corresponding chapter.
Despite those limitations, the report provides some of the first piece of household level analytical work on human development, which can help inform our policy dialogue in this area.
5. To facilitate the use of this report, the evidence presented is linked to policies and strategies. In each chapter, a Box summarizes the main strategies from the Ninth Five Year Plan. At the end of these chapters, we highlight the key results of the findings and emphasize
The main source of data used to write this report is the Bhutan Living Standard Survey (BLSS) 2003, conducted by the National Statistical Bureau (NSB) with the support of the Asian Development Bank (ADB). Data was collected between April 2003 and June 2003. The BLSS is the first nationally representative household survey in Bhutan and follows the second Household Income and Expenditure Survey (HIES) of 2000 (the first HIES of 1992 having never been published). The HIES results have always been considered as preliminary because the survey could not fully take the seasonality of consumption into account. The HIES had also collected very few data besides income and consumption. Hence, the broad objective of the BLSS was to collect detailed information about the economic and social conditions of the households. The survey also had as specific objectives to provide useful inputs for the compilation of national accounts, to be a basis for updating the weights of the CPI and to provide inputs in the estimation of the poverty profile for the country and various poverty indicators.
In the absence of census data, the National Statistical Bureau (then CSO) uses a list of households by gewog for the entire country which is updated whenever a new fieldwork is done for a particular survey. This type of “administrative census” is less precise as an up-to-date
“statistical census”.
The different areas were divided into seven strata: four urban strata (Thimphu city, rest of Western, Central and Eastern) and three rural strata (Western, Central and Eastern). The survey is representative at the strata level. Two rural areas, Sarpang and Samdrup Jongkhar were dropped out in the sample due to security reasons.
The sample size for the survey is 4120 households. This sample represents a total extrapolated population of 547,178 people. This figure is an estimate based on the sample frame, which does not cover the whole population of the Kingdom. The population coverage included all households in the country except households of expatriates, residents of hotels, boarding and lodging houses, monasteries including nunneries, school hostels, orphanages, rescue homes, vagrant houses, and under-trail in jails, indoor patients of the hospitals, nursing homes, etc.; and barracks of military and paramilitary forces including the police.
issues that deserve attention in future research. Furthermore, the conclusion pulls together many of the main messages.
6. The report is organized as follows. The first chapter describes the education sector and discusses some of its challenges. The second chapter discusses a few issues in the health sector to which the BLSS has brought new information since the publication of the last MDG report and the 2000 Annual Health Survey. The third chapter is an attempt to better identify who is poor or likely to become poor in Bhutan and briefly describes some of the current strategies, formal and informal, to address the difficulties of life. This chapter gives a particular attention to the children, the youth and the elderly.
7. The key results and main conclusions of the report are described below.
Education
8. Thanks to the high priority that the RGOB has historically given to education, as reflected by considerable investments and a progressive policy environment, substantial progress has been achieved in school enrollment. Progress is, for instance, visible in the increase in literacy rate from 23 percent to 80 percent for the 55 to 59 years old men, and the 10 to 14 year olds, respectively. The change is even more spectacular for women, whose literacy rates increased from 1 percent to 70 percent for the same age groups. These numbers are also the expression of a significant evolution towards gender equality.
9. However, the country still faces many challenges in educating its population. Despite progress, entry rates, enrollment rates and completion rates remain relatively low, particularly in rural areas. Primary gross enrollment rate was estimated at 93 percent nationally and at 88 percent in rural areas. Secondary gross enrollment rates are as low as 29 percent in rural areas. Net enrollment rates are considerable lower because of late entry and high repetition rates. The enrollment gap between urban and rural areas is large. Girls still have a lower chance to enter the school system and to receive a secondary education. There are also significant differences in enrollment rates between consumption quintiles, even though education is free. Approximately, only 70 percent of the children who ever started school will ever complete the primary cycle. Drop out is a major issue. School attendance rates are the highest at the age of 11 after which they start to decline. At the age of 15, only 44 percent of the girls and 55 percent of children in rural areas are still in school.
10. Over-crowdedness and high pupil-teacher ratios are considered to be the most important problem at school. In rural areas, about 37 percent of the primary level students live more than 45 minutes away from the school. Distance to school, however crucial, is not quoted as the main important reason for why children do not attend classes. The main reason is household poverty and the necessity to work. Education is free in Bhutan but poor households need the help of their children for works on the field, in their shops, at home or as domestics. Further, despite public education being free, hidden costs such as uniform, transport and informal boarding arrangements are prohibitive for the poor.
Health
11. Some data from WHO and from the National Annual Health Bulletins suggest that child malnutrition and child mortality have decreased over the last decade. Reasons for this progress include the expansion of the safe water and sanitation networks as well as the expansion of the immunization coverage.
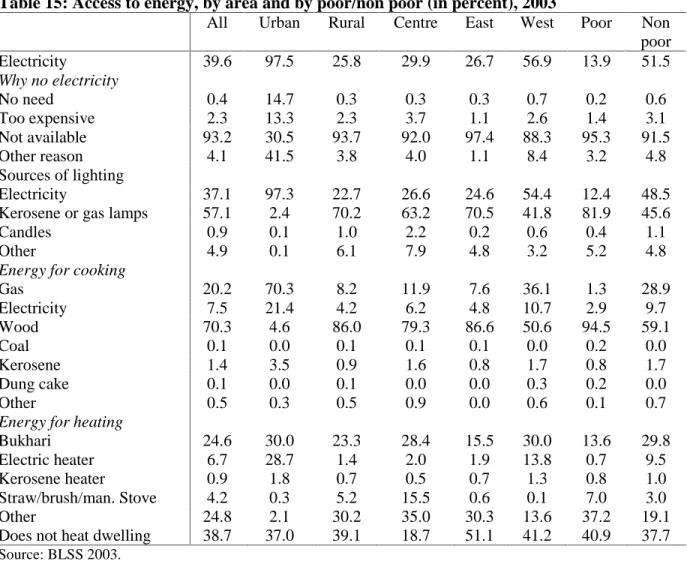
12. However, some factors strongly correlated with child health remain weak. First, access to safe water and sanitation is still not universal. According to the BLSS, access to safe drinking water within a distance of 100 meters was estimated to be 98.5 percent in urban areas in 2003, but only 77 percent in rural areas. Access is only 71 percent for the poor.
About nine percent of the poor and eight percent of those living in the East do not have access to sanitation. Second, unsafe cooking practices remain and can cause respiratory illnesses, identified as the first cause of child death. For instance, in rural areas, women use wood (86 percent) or gas (8 percent), sometimes on open fires, in poorly ventilated houses. Third, some households are still not aware of the importance of immunization and its coverage is still relatively low. In 2001, only 65 percent of the less than one year olds had received valid doses.
13. Finally, there are pockets of hunger and malnutrition in the country. Using the BLSS and nutrition conversion factors, it was estimated that about 48 percent of households, most of which live in rural areas, do not meet the minimum caloric requirements (2,124 Kcal). This share is 62 percent in the Eastern region and 73 percent for the poor1. Iron deficiency is also a problem in Bhutan, often resulting in anemia. The consumption of fruits and vegetables is also too small relative to international requirements.
14. The 2002 MDG Progress Report also suggests a decrease in maternal mortality between 1990 and 2000. Monitoring is however very difficult as the majority of the births occur outside of formal institutes and as adequate registration systems are not in place. For example, assistance by skilled personnel is still very low in Bhutan. In rural areas, only 49 percent of the deliveries are medically assisted and only 28 percent of the deliveries occur in a hospital or a maternity. The picture is better in urban areas but even there, a quarter of the deliveries still occur at home without any medical assistance. The share of non-attended deliveries at home is particularly high for the poor; namely at 64 percent. Only 66 percent of pregnant women in rural areas received prenatal care in 2003. Maternal health care indicators are significantly lower in rural than in urban areas.
15. The RGOB increased the supply of health facilities and programs over the last decade, with a particular focus on rural areas and basic health care. However, despite the increase in absolute numbers, the number of medical staff per person has not increased and the number of hospital beds per person has even decreased. On the demand side, even though health care is almost entirely free in Bhutan, there are still obstacles to utilization of existing health facilities and services. Regressions indicate that distance is an obstacle in rural areas, but it is probably not the only factor explaining why people look or not for medical assistance: poverty and cultural values also play a role.
1This analysis is subject to a number of caveats as the BLSS was not designed for nutrition analysis (see Bhutan Human Development Report, 2005, draft).
Social Protection
16. Poverty. According to the 2004 Report on Poverty and Inequality, the share of the population living under the poverty line in 2003 is 31.7 percent nationally. Poverty is essentially a rural phenomenon: the incidence of poverty is 4 percent in urban areas and 38 percent in rural areas (in which 80 percent of the population lives). Poverty is more prevalent in the eastern part of the country and in some selected districts.
17. The analysis confirms the importance of a pillar of the Ninth Five Year Plan: access to goods and services. Controlling for education, employment and other household characteristics, households living in remote areas have an expected level of per capita consumption lower by 9 percent in rural areas and a probability to be hungry higher by 3 percent. Other factors such as the sector of activity or the education level are also associated with poverty. Econometric analysis confirms results from simple correlations: illiteracy or lack of education increases the likelihood to be poor. Households in agriculture are also more likely to have lower levels of per capita consumption, to be poor and hungry.
18. Currently, the incidence of poverty is similar across all age groups in Bhutan2. However, poverty of the household is perhaps most onerous for children, who have to forgo school, have to work and face hunger. Nationally, about 11 percent of the households declare suffering from hunger for two or three months per year, mostly in rural areas. The BLSS indicates that some children are employed in the informal as well as in the formal sector, especially in rural areas. In urban areas, the majority of working children are employees in the service sector while, in rural areas, child labor is essentially family work in agriculture.
With schools being far away from home and school schedules not being adapted to seasonal obligations, it is extremely difficult for children to combine work and schooling.
19. The changing demographics of Bhutan, urbanization of the country, and economic developments, also have potential future impact on poverty rates for particular groups, e.g.
young adults and the elderly. As the level of education increases in Bhutan—a positive development for the country—and as the new generation leaves the villages in search for white collar jobs, unemployment is rising in urban centers because the private sector is not developing fast enough to absorb this newly educated workforce. This affects mainly the young adults. In urban areas, about 11 percent of the 20 to 25 years old men are unemployed and 5.4 percent are looking for work. At present, unemployment of the youth is not
necessarily related to poverty as many young men and women still live with their parents.
However, continued unemployment will jeopardize their future.
20. The elderly (60 years and above) constitute less than 10 percent of the Bhutanese population but demographic projections suggest that their share will increase overtime.
Currently, the elderly live with their extended family. Old age income security in Bhutan is mainly provided through support from the family, with the exception of the National Pension and Provident Fund (NPPF) that covers civil servants and the military and provides an annuity, and a lump-sum payment at retirement. As education, income and urbanization
2Using per capita consumption.
increase in Bhutan, traditional family systems may become less reliable as a source for support and the elderly may increasingly become vulnerable to poverty.
21. Coping Strategies. In the absence of a formal social protection system and safety nets (outside of formal pensions for civil servants), Bhutanese rely on different strategies to cope with the difficulties of life. Inter-household transfers in cash or in kind are one way for Bhutanese to redistribute to those in need, especially from urban to areas. Migration is another strategy to increase one’s income and employment possibilities. Nationally, about 12 percent of the population above 15 years of age spends more than a month per year away from the household, probably for work reasons. It seems that those who migrate are more educated than those who do not migrate. The poor, the illiterate and those working in agriculture are less able to take advantage of this coping strategy. Borrowing is another way for households to cope with poverty. About 42 percent of the Bhutanese have access to formal credit.
Access is lower but still significant for those at the bottom of the income distribution with only 37 percent having access to private banks credits in the first quintile, against 50 percent in the top quintile. Borrowing from relatives is very common, particularly for the poor.
Conclusion
22. Bhutan has accomplished tremendous progress on all its human development indicators. The gender gap in education has been reduced, enrolment rates have increased, child and maternal mortality rates have dropped. However, there are more challenges ahead.
In education, girls have lower school entry and enrollment rates than boys, early school drop out is a major issue, and literacy rates remain relatively low. In health, some factors correlated to child health are still weak. Access to safe water and sanitation is not universal, unsafe cooking practices persist, awareness towards immunization could be increased and some households do not meet nutritional requirements. Further decrease in maternal mortality is a particular challenge for Bhutan given the difficulty to reach remote households. In rural areas, only two thirds of the women receive prenatal care and half of them deliver at home without medical assistance. In social protection, the report identified some emerging issues.
Child labor and hunger do exist in Bhutan. Unemployment is growing in the urban areas, mostly affecting the youth, a result of a large youth cohort, growing number of school graduates, and absence of jobs. Increased urbanization, modernization and break up of traditional support systems, and longer term demographic trends—as the base of the age pyramid shrinks because of decline in the fertility rate—all have the potential to make elderly more vulnerable in the future.
24. These challenges are interlinked. Poor children are less likely to go to school and to complete their basic education, even when controlling for distance to school, and despite education being free. Those who prematurely drop out of school jeopardize their future; they decrease their expected lifetime income and their likelihood to find a job in urban areas.
Later, they may have to withdraw their own children from school, perpetuating in that way poverty from one generation to the next. Poor health is another channel through which poverty is maintained. Poor households face nutrition problems and consume less health services than the non poor, even when controlling for distance to health facilities. This affects
particularly the physical and cognitive development of the children and undermines their future.
25. The impact of the second hydro-electric power plant is expected to boost economic growth and could decrease the level of poverty to nine percent if income distribution is unchanged. However, there are three concerns in that respect. First, the poor may be less able to benefit from growth than the non-poor. They appear to be less mobile to go to those places where remunerative jobs are created and public services are made available. The poor also have somewhat lower access to credit which may cause inequality to increase, dampening the effect of growth on poverty. Second, the additional income generated by the hydro-power sector may not automatically generate more employment, depending on the labor market structure and the availability of skills. Third, and probably most important, higher growth is not a guarantee for improvements in the education and health sectors.
Worldwide experience shows that the recent acceleration in the growth rates of developing countries and the improvement in their macro-economic performance have been accompanied by a decrease in poverty but not necessarily by progress on the other MDGs. This is because the education and health MDGs are most sensible to the issues of service delivery, which are not directly related to growth.
26. As the country is now embarking in the Tenth Year Plan (2007-2012), several questions remain. How can the objectives in the next Plan be simultaneously stimulating and realistic? How could we increase enrollment rates and improve the quality of education?
What is the strategy to improve health outcomes? How should the RGOB prioritize between the needs of numerous vulnerable groups, for instance, the children and the elderly, given the current fiscal constraints? How should one approach the question of migration from rural to urban areas? Should the RGOB encourage settlement in the urban centers or encourage rural communities by making access to services easier for them? What can be done to stimulate the growth of the private sector and create new employment possibilities? How should the government think about formalizing and expanding safety nets for poor to alleviate hunger, or training, entrepreneurship for young unemployed? Should demand-side interventions be designed to help poor households to use education and health facilities? There are many more questions which will require additional research and efforts to strengthen the statistical and monitoring capacities.
27. To the question “What is the binding constraint for Bhutan?”, it is very tempting to answer “Distance to goods and services”. This is certainly true in the sense that, all else being equal, households in remote areas are poorer, experience hunger, hardly send their children to school and make less use of health facilities. However, in the short run, it is not clear that decreasing distance to a particular public service will be enough to increase the use of this service and to improve outcomes. Building a school, for instance, will not necessarily increase enrollment rates as there are other factors than distance that keep children out of school. In other words, the condition for an improvement of the human development indicators in Bhutan is simultaneously growth, physical access to services, progress in service delivery, and, consistent with the Ninth Plan, improving the living standards, particularly of the very poor. Fortunately, Bhutan is strongly committed to removing all obstacles to the happiness of its people and one has all the reasons to be hopeful.
CHAPTER 1. EDUCATION
This chapter describes the considerable progress done by the RGOB over the last five decades and discusses some of the challenges still faced by the country. It gives a particular attention to the determinants of schooling. A first section presents the overall profile of the education sector and the objectives of the RGOB. The second and third sections will sequentially present the problems at school and the reasons for not attending classes, as reported in the last household survey. A fourth section will tackle the determinants of schooling using multivariate regressions. The fifth section approaches the question of the returns to education. The sixth section relates to the link between schooling and child labor.
The eighth and ninth sections will briefly present the profile of private education expenditure.
I. OVERALL PROFILE AND OBJECTIVES
1.1 Thanks to the high priority that RGOB has historically given to education, as reflected by considerable investments and a progressive policy environment, substantial progress has been achieved in school enrollment and gender equality. Enrollment in primary schools has increased at an annual rate of 6-7 percent since 1991. According to the publication of the Ministry of Education, gross enrollment rate has increased from 55 percent in 1991 to 81 percent in 2003. Taking into account the number of children in monastic schools, the gross enrollment rates was even estimated at 82.8 percent in 2003. The net enrollment rate was estimated at 62 percent. The gender gap has substantially decreased; in 2001, girls constituted 46 percent of enrollment across all school levels.
Box 2: The Ninth Five Year Plan and the Education Sector
Access to education is a priority for the RGOB. The objectives laid out in the 9FYP are the following:
- Providing support mechanisms for early childhood care (0 to 6 years) - Increasing primary net enrollment rate to 90-95 percent by 2007
- Enhancing the quality of education comparable to international standards - Expanding youth guidance and career counseling
- Increasing the basic level from class VIII to X
- Increasing promotion rate from class X to XI from 38 to 56 percent by 2007 - Developing a higher education system under the National University
- Enhancing the literacy rate from 54 percent to 80 percent and establish a system of continuing and life long education opportunities
- Establishing a program of inclusive education for children with disabilities
- Strengthening the education management system with particular emphasis on the school level management
- Developing a more sustainable education system through the introduction of private participation and cost sharing measures.
The Plan also addresses the need to expand vocational education and training.
1.2 The Royal Government of Bhutan (RGOB) endorsed the Millennium Declaration but its objectives are even more ambitious. The Millennium Development Goals (MDGs) launched in September 2000 set Universal Primary Education (UPE) as one of the objectives to be reached in 2015. The RGOB endorsed the Millennium Declaration convinced of the relevance of the goals and in-line with its own objectives set prior to the year 2000. In the Ninth Five-Year Plan (9FYP) from 2002-2007, the objective is to enhance primary enrollment rates to 90-95 percent and to achieve full enrolment at Junior High School by the end of the plan period. The objective to be reached at the end of the 10th FYP is full enrollment of high school.
1.3 Lack of data makes analyzing education indicators over time difficult. Because the country never conducted a census, there is always considerable uncertainty regarding the population numbers. The denominators for education indicators are therefore estimates only.
Even though Net Enrollment Rates have been estimated, the RGOB mainly relies on gross enrollment rates to describe the progress achieved in the education sector. The objectives are also not always well defined, which makes monitoring difficult. For instance, reaching UPE is sometimes understood as having a gross enrollment rate close to 100 percent while in reality UPE should be associated to high net enrollment rates combined with high completion rates. The use of gross enrollment rates is however useful in Bhutan given the difficulty for many children to start schooling at the official age of six years because of long walking distances to school. The absence of repeated cross-section data makes it difficult to monitor progress in the sector. One way to circumvent this issue though is to look at education indicators such as literacy rates, for different age cohorts within the BLSS.
Box 3: Statistical capacity and reporting on education indicators
1.4 Literacy rates have considerably increased over the last 50 years thanks to the immense efforts towards basic education in the entire Kingdom. Table 1 indicates literacy rates, as reported during the BLSS survey, in any language, by age and by gender. As a proof
Education indicators and statistics are reported on a yearly base by the Ministry of Education (MOE). Those reports include gross enrollment, repetition, drop out and promotion rates. They are based on direct reporting by every school. Currently, the MOE’s main difficulty to monitor progress in the sector is the absence of a population baseline to which education indicators such as enrollment rates are particularly sensible. For instance, the gross enrollment rate published by the Ministry of Education in its 2003 report was 81 percent while it is estimated at 92.4 percent in the BLSS. Using the National Statistical Bureau‘s official population baseline of 734,340 for 2003 the gross enrollment rate would only be 68 percent.
Net enrollment rates, entry rates or completion rates are not reported by the MOE. Other official publications sometimes have mentioned a NER of 62 percent or a primary completion rate of 70 percent for 2003 without disaggregating or explaining the methodology and the sources.
The census will be very beneficial to the Education sector and will certainly be an important step in the monitoring and evaluation of Universal Primary Education and other sector objectives.
of the remarkable progress, literacy rates for the population aged 10 to 14 is 75.3 percent against only 12.8 percent for the population above 60.
Table 1: Reported literacy rates in any language, by age and gender, 2003
Male Female Total
Total (Aged 6+) 53.9% 32.8% 42.9%
6-9 50.1% 44.9% 47.6%
10-14 80.0% 71.1% 75.3%
15-19 77.5% 58.6% 67.7%
20-24 59.1% 39.2% 48.0%
25-29 58.8% 26.0% 39.5%
30-34 52.3% 18.4% 34.5%
35-39 53.2% 13.9% 31.1%
40-44 43.5% 8.0% 25.6%
45-49 36.3% 4.0% 20.7%
50-54 40.6% 3.5% 21.5%
55-59 23.2% 1.0% 11.7%
60+ 22.1% 1.8% 12.8%
Source: BLSS 2003
1.5 Despite this progress, despite high entry rates into the education system and relatively high enrollment rates, literacy rates are still low. The BLSS indicates that literacy rates could be lower than what is traditionally believed. According to the BLSS, the reported adult literacy rate is 32.8 percent for women and 53.9 for men and the total adult literacy rate is 42.9 percent. Table 2 provides estimates of literacy rates by consumption quintiles and area. As we can see, there are considerable differences between urban and rural areas as well as between consumption quintiles. Literacy rates increase systematically as the level of household consumption increases. In urban areas, for instance, the literacy rate is only 60 percent for the individuals in the poorest quintiles against 79.6 percent for those in the highest consumption group.
Table 2: Reported literacy rates for children and adults above 6 years in any language, by area and consumption quintile, 2003
Urban Rural
Total 70.4% 36.5%
Quintile 1 60.0% 30.2%
Quintile 2 67.5% 32.4%
Quintile 3 69.7% 35.5%
Quintile 4 74.3% 38.4%
Quintile 5 79.6% 45.4%
Source: BLSS 2003
1.6 The Bhutan Living Standard Survey indicates a gross enrollment rate of 92.6 percent and a net enrollment rate of 69 percent in 2003. According to the BLSS, the overall net enrollment rate corresponding to the age group of the 6 to 12 year olds is 69 percent and the gross enrollment rate is 92.6 percent. The difference between net and gross enrollment rates is due to two factors. First, many children start schooling later than the
official entry age (six years) because of the long walking distance to the school. Second, repetition rates are relatively high so that older children stay in lower education levels. The discrepancy between gross and net enrollment rates also indicates the need to be very precise when fixing sector objectives. In its five-year plan, what does Bhutan really mean by “full enrollment”? Using gross enrollment rates only as performance indicators can be misleading.
Net enrollment rates better reflect the status of the education system than gross enrollment rates but should nevertheless be used simultaneously with completion rates to assess the performance of the system. Further, completing primary education is not necessarily a guarantee that the child has received a good quality education.
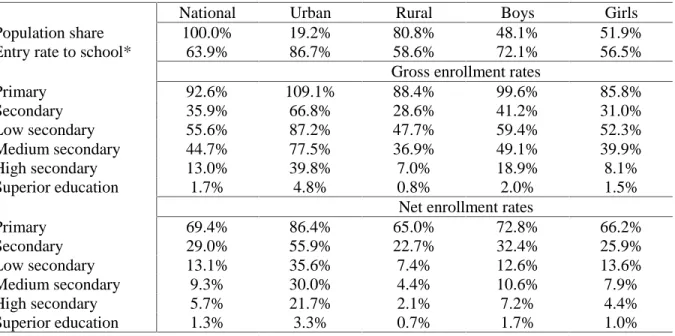
Table 3: Entry rates, net and gross enrollment rates by area, gender and levels of schooling, 2003
National Urban Rural Boys Girls Population share 100.0% 19.2% 80.8% 48.1% 51.9%
Entry rate to school* 63.9% 86.7% 58.6% 72.1% 56.5%
Gross enrollment rates
Primary 92.6% 109.1% 88.4% 99.6% 85.8%
Secondary 35.9% 66.8% 28.6% 41.2% 31.0%
Low secondary 55.6% 87.2% 47.7% 59.4% 52.3%
Medium secondary 44.7% 77.5% 36.9% 49.1% 39.9%
High secondary 13.0% 39.8% 7.0% 18.9% 8.1%
Superior education 1.7% 4.8% 0.8% 2.0% 1.5%
Net enrollment rates
Primary 69.4% 86.4% 65.0% 72.8% 66.2%
Secondary 29.0% 55.9% 22.7% 32.4% 25.9%
Low secondary 13.1% 35.6% 7.4% 12.6% 13.6%
Medium secondary 9.3% 30.0% 4.4% 10.6% 7.9%
High secondary 5.7% 21.7% 2.1% 7.2% 4.4%
Superior education 1.3% 3.3% 0.7% 1.7% 1.0%
Source: BLSS 2003. * Defined as the share of 13 to 19 years children who have attended school at least once in their life.
1.7 Despite considerable progress, net enrollment rates remain relatively low, especially in rural areas. The net enrollment rate for primary education, estimated using the BLSS, is 65 percent in rural areas. For low, medium and high secondary levels, it is only 7.4 percent, 4.4 percent and 2.1 percent respectively, in rural areas. Net enrollment rates are higher in urban areas.
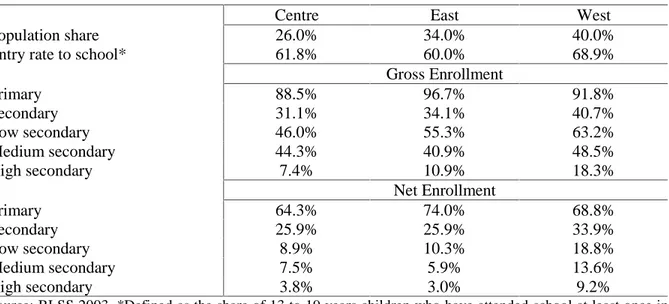
Table 4:Entry rates, net and gross enrollment rates by region and levels of schooling.
Centre East West Population share 26.0% 34.0% 40.0%
Entry rate to school* 61.8% 60.0% 68.9%
Gross Enrollment
Primary 88.5% 96.7% 91.8%
Secondary 31.1% 34.1% 40.7%
Low secondary 46.0% 55.3% 63.2%
Medium secondary 44.3% 40.9% 48.5%
High secondary 7.4% 10.9% 18.3%
Net Enrollment
Primary 64.3% 74.0% 68.8%
Secondary 25.9% 25.9% 33.9%
Low secondary 8.9% 10.3% 18.8%
Medium secondary 7.5% 5.9% 13.6%
High secondary 3.8% 3.0% 9.2%
Source: BLSS 2003. *Defined as the share of 13 to 19 years children who have attended school at least once in their life.
Figure 1: School attendance, by age and area, 2003
0%
10%
20%
30%
40%
50%
60%
70%
80%
90%
100%
5 6 7 8 9 10 11 12 13 14 15 16 17 18 19 20 21 22 23 24 25 Urban Rural
Source: BLSS 2003
1.8 Despite improvements, there are still considerable gender disparities:
• Bhutan is a country without any explicit discrimination towards girls or women, but traditional roles still apply. When parents are constrained economically and must make a choice between sending their son or their daughter to school, they will give
their preference to the boy. Parents are also reluctant to send their daughters to school for security reasons or for fear of early pregnancy.
• Table I.1 (on page 2) reports entry rates and enrollment rates by gender. The net enrollment rates for primary and secondary levels are respectively 72.8 and 32.4 percent for boys against 66.2 and 25.9 percent for girls. The proportion of children who will never go to school is higher for girls than for boys by 15.6 percentage points.
As we can see from Figure 2, school attendance is on average 9.5 percentage points higher for boys than for girls. The difference is wider for the age group 15-18.
• In some cases, parents believe that Non Formal Education (NFE) is sufficient for girls.
NFE provides basic reading, writing and numeric skills. It is less costly and more flexible since it allows girls to attend classes in the evening when all the household chores have been accomplished. Sometimes, NFE takes the form of a mobile teaching unit, which goes from one village to the other, and is seen as an attractive alternative to schools for very remote areas.
Figure 2: School attendance, by age and gender, Bhutan 2003
0%
10%
20%
30%
40%
50%
60%
70%
80%
90%
100%
5 7 9 11 13 15 17 19 21 23 25
Boys Girls
Source: BLSS 2003
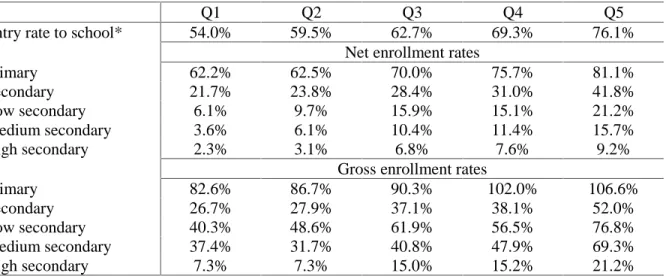
1.9 Despite the fact that education is free, there are large differences in enrollment between consumption groups. Even in the case of primary education, where the opportunity cost of school is supposed to be less constraining than for older children, there are large differences between consumption groups, as reported in Table 5. Net primary enrollment is only 62.2 percent for the poorest households, against 81.1 for the households in the highest consumption quintile. The difference is even higher for the net secondary enrollment rates.
Table 5: Entry rates, net and gross enrollment rates by consumption quintiles and levels of schooling
Q1 Q2 Q3 Q4 Q5 Entry rate to school* 54.0% 59.5% 62.7% 69.3% 76.1%
Net enrollment rates
Primary 62.2% 62.5% 70.0% 75.7% 81.1%
Secondary 21.7% 23.8% 28.4% 31.0% 41.8%
Low secondary 6.1% 9.7% 15.9% 15.1% 21.2%
Medium secondary 3.6% 6.1% 10.4% 11.4% 15.7%
High secondary 2.3% 3.1% 6.8% 7.6% 9.2%
Gross enrollment rates
Primary 82.6% 86.7% 90.3% 102.0% 106.6%
Secondary 26.7% 27.9% 37.1% 38.1% 52.0%
Low secondary 40.3% 48.6% 61.9% 56.5% 76.8%
Medium secondary 37.4% 31.7% 40.8% 47.9% 69.3%
High secondary 7.3% 7.3% 15.0% 15.2% 21.2%
Source: BLSS 2003. * Defined as the share of 13 to 19 years children who have attended school at least once in their life. Quintiles are defined separately for urban and rural areas.
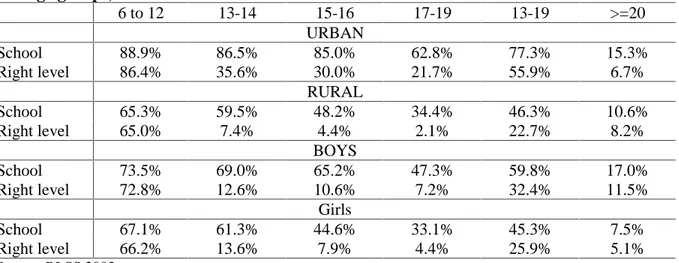
1.10 Early drop out constitutes a major problem, especially for girls and children living in rural areas. As shown in Table 6, school attendance rates are the highest for children at the age of 11, after which they progressively decrease, especially in urban areas.
This is particularly worrying because no child is able to complete the primary cycle at the age of 11 (unless the child started school at the age of 5). Drop out accelerates after the age of 16, which corresponds to the transition to higher secondary education3. This is particularly visible in urban areas, as shown in Figure 1. The 2003 UNICEF report on the status of access to primary education of the girl indicates that drop-out rates are relatively similar for boys and girls at the primary level, but girls seem to perform less well than boys later on. In particular, girls do less well than boys on the selection exams towards higher secondary education. One of the reasons could be that girls have less time at home than boys to study because parents impose more household chores on them than on boys. More will be said about the potential reasons for the gender difference in the section devoted to the reasons for drop-out.
3In Bhutan, free education is provided to anybody until grade 10, which corresponds to the end of the medium secondary level. In order to be admitted in a free, public high secondary school, students must take tests and compete because the number of seats is limited.
Table 6: School attendance and share of students in right level for their age, by area, gender and age groups, 2003
6 to 12 13-14 15-16 17-19 13-19 >=20 URBAN
School 88.9% 86.5% 85.0% 62.8% 77.3% 15.3%
Right level 86.4% 35.6% 30.0% 21.7% 55.9% 6.7%
RURAL
School 65.3% 59.5% 48.2% 34.4% 46.3% 10.6%
Right level 65.0% 7.4% 4.4% 2.1% 22.7% 8.2%
BOYS
School 73.5% 69.0% 65.2% 47.3% 59.8% 17.0%
Right level 72.8% 12.6% 10.6% 7.2% 32.4% 11.5%
Girls
School 67.1% 61.3% 44.6% 33.1% 45.3% 7.5%
Right level 66.2% 13.6% 7.9% 4.4% 25.9% 5.1%
Source: BLSS 2003.
1.11 Children rarely complete primary education on time and some children never complete the cycle, especially in rural areas. Completion rates seem higher for girls than for boys. Many children drop out of school even before having completed the primary cycle, especially in rural areas. Table 7 indicates completion rates by gender and area.
Primary completion is defined as the share of children having started school who actually completed primary education. Because the age at which children may complete primary school varies a lot in Bhutan, Table 7 reports primary completion rates for different age groups. On-time completion would relate to the 13 to 15 years old and is relatively low, but completion at older ages is as high as 90 percent in urban areas. Rural areas always lag behind with a completion rate not higher than 73 percent. Very interestingly, girls seem to have higher completion rates as boys.
Table 7: Primary completion rates by age group, area and gender
National Urban Rural Boys Girls
13-15 31.2% 54.9% 23.0% 29.3% 33.4%
13-17 44.0% 66.3% 36.1% 41.7% 46.7%
15-19 67.4% 85.8% 60.9% 65.9% 69.2%
17-21 77.4% 90.1% 72.7% 78.1% 76.7%
19-23 75.0% 89.0% 68.2% 74.2% 75.9%
Source: BLSS 2003.
1.12 Repetition rates are very high. Boys tend to repeat more than girls. The MOE reports a decrease in repetition rates for class 1 from 15.1 percent in 1997 to 11 percent in 2004. Despite this slight progress, repetition remains a problem in Bhutan. According to the same report, the incidence of repetition seems particularly high in the districts of Trashiyangtse and lowest in Ha although the information could be biased because of the small sample size in those two districts. Repetition rates also vary by grade. They tend to be the highest for grade I as teachers want to make sure students acquire basic skills before progressing in the education system. Repetition rates also tend to be higher in grade IV. This may be explained by several different factors. One factor is that many children from remote