Comparative Indicators of Education in the
United States and Other G-8 Countries: 2002
U.S. Department of Education Institute of Education Sciences NCES 2003–026
U.S. Department of Education Institute of Education Sciences NCES 2003–026
Comparative Indicators of Education in the
United States and Other G8 Countries: 2002
May 2003
Joel D. Sherman Steven D. Honegger Jennifer L. McGivern
American Institutes for Research
Mariann Lemke
Project Officer National Center for Education Statistics
U.S. Department of Education Rod Paige
Secretary
Institute of Education Sciences Grover J. Whitehurst
Director
National Center for Education Statistics Val Plisko
Associate Commissioner
The National Center for Education Statistics (NCES) is the primary federal entity for collecting, analyzing, and reporting data related to education in the United States and other nations. It fulfills a congressional mandate to collect, collate, analyze, and report full and complete statistics on the condition of education in the United States; conduct and publish reports and specialized analyses of the meaning and significance of such statistics; assist state and local education agencies in improving their statistical systems; and review and report on education activities in foreign countries.
NCES activities are designed to address high priority education data needs; provide consistent, reliable, complete, and accurate indicators of education status and trends; and report timely, useful, and high quality data to the U.S. Department of Education, the Congress, the states, other education policymakers, practitioners, data users, and the general public.
We strive to make our products available in a variety of formats and in language that is appropriate to a variety of audiences. You, as our customer, are the best judge of our success in communicating information effectively. If you have any comments or suggestions about this or any other NCES product or report, we would like to hear from you. Please direct your comments to:
National Center for Education Statistics Institute of Education Sciences U.S. Department of Education 1990 K Street NW
Washington, DC 20006–5651 May 2003
The NCES World Wide Web Home Page address is http://nces.ed.gov
The NCES World Wide Web Electronic Catalog is: http://nces.ed.gov/pubsearch Suggested Citation
U.S. Department of Education, National Center for Education Statistics. Comparative Indicators of Education in the United States and Other G8 Countries: 2002, NCES 2003–026, by Joel D. Sherman, Steven D. Honegger, and Jennifer L. McGivern. Project Officer: Mariann Lemke.
Washington, DC: 2003.
For ordering information on this report, write:
U.S. Department of Education ED Pubs
P.O. Box 1398
Jessup, MD 20794–1398 Or call toll free 1–877–4ED–Pubs Content Contact:
Mariann Lemke (202) 502–7314 mariann.lemke@ed.gov
iii
ACKNOWLEDGMENTS
The authors wish to thank all those who contributed to the production of this report, including Marianne Perie for her work in identifying an initial set of possible indicators, Bernhard Streitwieser for his work in analyzing and writing initial draft text for the indicators, and Alexandra Gerson and Heather Hill for compiling indicator data and creating initial graphics for the indicators. From the International Studies Center at Boston College, we wish to thank Eugenio Gonzalez for providing additional information on the Third International Mathematics and Science Study.
Eugene Owen at the National Center for Education Statistics (NCES) initiated this report based on a similar publication produced by the French Ministry of Education. Several other NCES staff
members provided valuable advice throughout the project, particularly Tom Snyder, Patrick Gonzales, Val Plisko, and Mariann Lemke. Chris Calsyn from the Education Statistics Services Institute (ESSI) also provided input. Technical advice was provided by Shelley Burns (NCES), David Miller, Michael Regnier, and Jason Sellers (ESSI) and reviewers for the publication: Christopher Cross (Center on Education Policy), Peg Goertz (University of Pennsylvania), Jeffrey Owings (NCES), Andreas Schleicher (Organization for Economic Cooperation and Development), and Linda Zimbler (NCES). Karen O’Conor served as the adjudicator for this publication.
v
TABLE OF CONTENTS
Page
ACKNOWLEDGMENTS ... iii
INTRODUCTION ... 1
HIGHLIGHTS ... 9
INDICATORS PART I: Context of Education ... 15
Indicator 1: Youth Population ... 16
Indicator 2: Educational Attainment ... 18
Indicator 3: Enrollment in Formal Education ... 20
Indicator 4: Enrollment in Private Schools and Higher Education Institutions ... 22
INDICATORS PART II: Preprimary and Primary Education ... 25
Indicator 5: Early Childhood Enrollment ... 26
Indicator 6: Student/Teacher Ratios in Primary Education ... 28
Indicator 7: Public School Teachers’ Salaries in Primary Education ... 30
Indicator 8: Instructional Strategies in Primary Education ... 32
Indicator 9: Primary Students’ Attitudes Towards Mathematics and Science ... 34
Indicator 10: Mathematics and Science Achievement in Primary Education ... 36
INDICATORS PART III: Secondary Education ... 39
Indicator 11: Enrollment in Upper Secondary Education ... 40
Indicator 12: Student/Teacher Ratios in Secondary Education ... 42
Indicator 13: Public School Teachers’ Salaries in Upper Secondary Education ... 44
Indicator 14: Frequency of Behavior Problems ... 46
Indicator 15: Secondary Students’ Attitudes Towards Mathematics and Science ... 48
Indicator 16: Mathematics and Science Achievement in Secondary Education ... 50
vi CONTENTS
Indicator 17: Reading Performance of Secondary School-Age Youth ... 52
Indicator 18: Civic Participation ... 54
Indicator 19: Civic Achievement ... 56
Indicator 20: Upper Secondary School Graduation Rates ... 58
Indicator 21: Expenditures per Student for Primary and Secondary Education ... 60
Indicator 22: Expenditures for Primary and Secondary Education as a Percent of GDP ... 62
Indicator 23: Sources of Public Funding for Primary and Secondary Education ... 64
INDICATORS PART IV: Higher Education ... 67
Indicator 24: Higher Education Enrollment ... 68
Indicator 25: First University Degrees ... 70
Indicator 26: First University Degrees in Science ... 72
Indicator 27: Expenditures per Student for Higher Education ... 74
Indicator 28: Expenditures for Higher Education as a Percent of GDP ... 76
Indicator 29: Sources of Public Funding for Higher Education ... 78
INDICATORS PART V: Education and the Labor Force ... 81
Indicator 30: Labor Force Participation Rates ... 82
Indicator 31: Education and Earnings ... 84
GLOSSARY ... 87
CLASSIFICATION OF COUNTRIES’ EDUCATION SYSTEMS ... 93
SUPPLEMENTAL NOTES ... 105
APPENDIX TABLES ... 109
TABLES
Table A. Overview of education systems in the G8 countries ... 6Table 10a. Mean mathematics achievement scores of fourth-grade students, by country: 1994-95 ... 37
Table 10b. Mean science achievement scores of fourth-grade students, by country: 1994-95 ... 37
vii CONTENTS
Table 16a. Average scale scores of eighth-grade students in mathematics achievement, by country: 1999 ... 51
Table 16b. Average scale scores of eighth-grade students in science achievement, by country: 1999 ... 51
Table 16c. Percentage of eighth-grade students reaching the top 10 percent benchmarks of the TIMSS-R International Benchmarks of mathematics and science achievement, by country: 1999 ... 51
Table 17. Mean reading literacy performance scores of 15-year-olds, by country: 2000 ... 53
Table 19a. Average achievement scores of 14-year-olds in total civic knowledge, by country: 1999 ... 57
Table 19b. Average achievement scores of 14-year-olds in civic skills, by country: 1999 ... 57
Table 19c. Average achievement scores of 14-year-olds in civic content, by country: 1999 ... 57
Table B. Classification of education programs in the G8 countries into the International Standard Classification of Education (ISCED) ... 95
FIGURES
Figure 1a. Percentage of the total population ages 5 to 19, by country: 1992 and 1999 ... 17Figure 1b. Percentage change in the population ages 5 to 19, by country: 1992 to 1999 ... 17
Figure 2a. Percentage of the population ages 25 to 64 that has completed at least an upper secondary education, by age group and country: 1999 ... 19
Figure 2b. Percentage of the population ages 25 to 64 that has completed at least a first university degree, by age group and country: 1999 ... 19
Figure 3a. Percentage of the population ages 5 to 29 enrolled in formal education, by age group and country: 1999 ... 21
Figure 3b. Percentage of the population ages 18 and 19 enrolled in secondary and higher education, by age group and country: 1999 ... 21
Figure 4a. Percentage of primary and secondary enrollment in private schools, by country: 1999 ... 23
Figure 4b. Percentage of higher education enrollment in private institutions, by program type and country: 1999 ... 23
Figure 5a. Percentage of children ages 3 to 5 enrolled in preprimary education, by country: 1999 ... 27
Figure 5b. Percentage of children ages 3 to 5 enrolled in preprimary and primary education, by selected age and country: 1999 ... 27
Figure 6. Ratio of full-time-equivalent students to full-time-equivalent teachers in public and private primary schools, by country: 1999 ... 29
Figure 7. Public primary teachers’ average salaries in U.S. dollars, by level of experience and country: 1999 ... 31
viii CONTENTS
Figure 8a. Percentage of fourth-grade students whose mathematics teachers reported using selected
organizational approaches in most or every lesson, by country: 1994-95 ... 33 Figure 8b. Percentage of fourth-grade students whose science teachers reported using selected
organizational approaches in most or every lesson, by country: 1994-95 ... 33 Figure 9a. Percentage of fourth-grade students with positive or strongly positive attitudes towards mathematics,
by country: 1994-95 ... 35 Figure 9b. Percentage of fourth-grade students with positive or strongly positive attitudes towards science,
by country: 1994-95 ... 35 Figure 11. Percentage of the population ages 16 to 19 enrolled in public and private upper secondary education
and higher education, by selected age and country: 1999 ... 41 Figure 12. Ratio of full-time-equivalent students to full-time-equivalent teachers in public and private
secondary schools, by country: 1999 ... 43 Figure 13. Public upper secondary general teachers’ average salaries in U.S. dollars, by level of experience
and country: 1999 ... 45 Figure 14a. Percentage of eighth-grade students whose principals reported that behavior threatening a safe
and orderly environment occurs at least weekly, by selected behavior and country: 1999 ... 47 Figure 14b. Percentage of eighth-grade students whose principals reported that behavior threatening a safe
and orderly environment is a serious problem, by selected behavior and country: 1999 ... 47 Figure 15a. Percentage of eighth-grade students with “high” scores on the index of positive attitudes towards
mathematics, by country: 1999 ... 49 Figure 15b. Percentage of eighth-grade students with “high” scores on the index of positive attitudes towards
science, by country: 1999 ... 49 Figure 17. Percentage of students performing at given proficiency levels on the combined reading literacy scale,
by country: 2000 ... 53 Figure 18. Percentage of 14-year-olds who expect to participate in various civic activities, by country: 1999 ... 55 Figure 20. Upper secondary school graduation rates, by sex and country: 1999 ... 59 Figure 21a. Total expenditures per student in public and private primary schools, in current U.S. dollars converted
using Purchasing Power Parities (PPPs), by country: 1994 and 1998 ... 61 Figure 21b. Total expenditures per student in public and private secondary schools, in current U.S. dollars converted
using Purchasing Power Parities (PPPs), by country: 1994 and 1998 ... 61 Figure 22a. Public expenditures for primary and secondary education as a percent of Gross Domestic Product (GDP),
by country: 1994 and 1998 ... 63 Figure 22b. Public and private expenditures for primary and secondary education as a percent of Gross Domestic
Product (GDP), by country: 1994 and 1998 ... 63
ix CONTENTS
Figure 23. Percentage of initial public funds for primary and secondary education, by government level
and country: 1997 ... 65
Figure 24a. Percentage of the population ages 18 to 29 enrolled full-time and part-time in higher education, by country: 1994 and 1999 ... 69
Figure 24b. Percentage of the population ages 18 to 29 enrolled full-time and part-time in higher education, by selected age group and country: 1999 ... 69
Figure 25a. Graduation rates in higher education, by length of program and country: 1999 ... 71
Figure 25b. Graduation rates in higher education, by type of program and country: 1999 ... 71
Figure 26a. Percentage of first university degrees awarded in science, by country: 1999 ... 73
Figure 26b. Percentage distribution of first university science degrees awarded, by science content area and country: 1999 ... 73
Figure 27. Expenditures per student in public and private institutions of higher education, in current U.S. dollars converted using Purchasing Power Parities (PPPs), by country: 1995 and 1998 ... 75
Figure 28a. Public expenditures for higher education as a percent of Gross Domestic Product (GDP), by country: 1994 and 1998 ... 77
Figure 28b. Public and private expenditures for higher education as a percent of Gross Domestic Product (GDP), by country: 1994 and 1998 ... 77
Figure 29. Percentage of initial public funds for higher education, by level of government and country: 1997 ... 79
Figure 30a. Labor force participation rates of the adult population ages 25 to 64, by level of education and country: 1999 ... 83
Figure 30b. Labor force participation rates of the male and female adult population ages 25 to 64, by level of education and country: 1999 ... 83
Figure 31a. Relative earnings of the adult population ages 25 to 64 who have completed less than upper secondary education compared to adults who have completed upper secondary education, by country: 1997, 1998, or 1999 ... 85
Figure 31b. Relative earnings of the adult population ages 25 to 64 who have completed higher education compared to adults who have completed upper secondary education, by country: 1997, 1998, or 1999 ... 85
APPENDIX TABLES
Table A-1a. Percentage of the total population ages 5 to 19, by country: 1992 and 1999 ... 111Table A-1b. Percentage change in the population ages 5 to 19, by country: 1992 to 1999 ... 111
Table A-2a. Percentage of the population ages 25 to 64 that has attained at least an upper secondary education, by age group and country: 1999 ... 111
x CONTENTS
Table A-2b. Percentage of the population ages 25 to 64 that has attained at least a first university degree,
by age group and country: 1999 ... 112
Table A-3a. Percentage of the population ages 5 to 29 enrolled in formal education, by age group and country: 1999 ... 112
Table A-3b. Percentage of the population ages 18 to 19 enrolled in secondary and higher education, by age group and country: 1999 ... 112
Table A-4a. Percentage of primary and secondary enrollment in private schools, by country: 1999 ... 113
Table A-4b. Percentage of higher education enrollment in private institutions, by program type and country: 1999 ... 113
Table A-5a. Percentage of children ages 3 to 5 enrolled in preprimary education, by country: 1999 ... 113
Table A-5b. Percentage of students enrolled in preprimary education, by selected age, and country: 1999 ... 114
Table A-5c. Percentage of students enrolled in primary education, by selected age and country: 1999 ... 114
Table A-6. Ratio of full-time-equivalent students to full-time-equivalent teachers in public and private primary schools, by country: 1999 ... 114
Table A-7. Public primary teachers’ average salaries in U.S. dollars, by level of experience and country: 1999 ... 115
Table A-8a. Percentage of fourth-grade students whose mathematics teachers report using selected organizational approaches in most or every lesson, by country: 1994-95 ... 115
Table A-8b. Percentage of fourth-grade students whose science teachers’ reported using selected organizational approach in most or every lesson, by country: 1994-95 ... 115
Table A-9a. Percentage of fourth-grade students with positive or strongly positive attitudes towards Mathematics, by country: 1994-95 ... 116
Table A-9b. Percentage of fourth-grade students with positive or strongly positive attitudes towards science, by country: 1994-95 ... 116
Table A-10. Mean mathematics and science achievement scores for fourth-grade students, by country: 1994-95 ... 116
Table A-11a. Percentage of the population ages 16 to 19 enrolled in public and private uppersecondary education, by selected age and country: 1999 ... 117
Table A-11b. Percentage of the population ages 16 to 19 enrolled in public and private upper secondary and higher education, by selected age and country: 1999 ... 117
Table A-11c. Percentage of the population ages 16 to 19 enrolled in public and private higher education, by selected age and country: 1999 ... 117
Table A-12. Ratio of full-time-equivalent students to full-time-equivalent teachers in public and private secondary schools, by country: 1999 ... 118
xi CONTENTS
Table A-13. Public upper secondary general teachers’ average salaries in U.S. dollars, by level of experience
and country: 1999 ... 118 Table A-14a. Percentage of eighth-grade students whose principals reported that behavior threatening a safe
and orderly environment occurs at least weekly, by selected behavior and country: 1999 ... 119 Table A-14b. Percentage of eighth-grade students whose principals reported that behavior threatening a safe
and orderly environment is a serious problem, by selected behavior and country: 1999 ... 119 Table A-15. Percentage of eighth-grade students with “high” scores on the index of positive attitudes towards
mathematics and science, by country: 1999 ... 120 Table A-16a. Average scale scores of eighth-grade students in mathematics and science achievement,
by country: 1999 ... 120 Table A-16b. Percentage of eighth-grade students reaching the top 10 percent benchmark of the TIMSS
International Benchmarks of mathematics and science achievement, by country: 1999 ... 120 Table A-17a. Mean reading literacy performance scores of 15-year-olds, by country: 2000 ... 121 Table A-17b. Percentage of students performing at given proficiency levels on the combined reading literacy scale,
by country: 2000 ... 121 Table A-18. Percentage of 14-year-olds who expect to participate in various civic activities, by country: 1999 ... 121 Table A-19. Average achievement scores of 14-year-olds in total civic knowledge, civic skills, and civic content,
by country: 1999 ... 122 Table A-20. Upper secondary school graduation rates, by sex and country: 1999 ... 122 Table A-21a. Expenditures per student in public and private primary schools, in current U.S. dollars converted
using Purchasing Power Parities (PPPs), by country: 1994 and 1998 ... 122 Table A-21b. Expenditures per student in public and private secondary schools, in current U.S. dollars converted
using Purchasing Power Parities (PPPs), by country: 1994 and 1998 ... 123 Table A-22a. Public expenditures for primary and secondary education as a percent of Gross Domestic Product (GDP),
by country: 1994 and 1998 ... 123 Table A-22b. Public and private expenditures for primary and secondary education as a percent of Gross Domestic
Product (GDP), by country: 1994 and 1998 ... 124 Table A-22c. Private expenditures for primary and secondary education as a percentage of Gross Domestic
Product (GDP), by country: 1994 and 1998 ... 124 Table A-23. Percentage of initial public funds for primary and secondary education, by government level
and country: 1997 ... 124
xii CONTENTS
Table A-24a. Percentage of the population ages 18 to 24 enrolled full-time and part-time in higher education,
by country: 1994 and 1999 ... 125
Table A-24b. Percentage of the population ages 18 to 29 enrolled full-time and part-time in higher education, by age group and country: 1999 ... 125
Table A-25a. Graduation rates in higher education, by length of program and country: 1999 ... 125
Table A-25b. Graduation rates in higher education, by type of program and country: 1999 ... 126
Table A-26a. Percentage of first university degrees awarded in science, by country: 1999 ... 126
Table A-26b. Percentage distribution of first university degrees awarded in science, by science content area and country: 1999 ... 126
Table A-27. Expenditures per student in public and private institutions of higher education, in current U.S. dollars converted using Purchasing Power Parities (PPPs), by country:1995 and 1998 ... 127
Table A-28a. Public expenditures for higher education as a percent of Gross Domestic Product (GDP), by country: 1994 and 1998 ... 127
Table A-28b. Public and private expenditures for higher education as a percent of Gross Domestic Product (GDP), by country: 1994 and 1998 ... 128
Table A-29. Percentage of initial public funds for higher education, by level of government and country: 1997 ... 128
Table A-30a. Labor force participation rates of the adult population ages 25 to 64, by level of education and country: 1999 ... 129
Table A-30b. Labor force participation rates of the male and female adult population ages 25 to 64, by level of education and country: 1999 ... 129
Table A-31. Relative earnings of the adult population ages 25 to 64, by level of education and country (upper secondary set to 100): 1997, 1998, and 1999 ... 129
Introduction
3
INTRODUCTION
With the emergence and growth of the global economy, policymakers and educators have turned to international compari- sons to assess how well national systems of education are per- forming. These comparisons shed light on a host of policy issues, from access to education and equity of resources to the quality of school outputs. They provide policymakers with the opportunity to compare different aspects of countries’ education systems, to assess systems’ performances, and to identify potential strategies to improve student achievement and system outputs.
For more than a decade, the United States has participated ac- tively in international projects that are designed to provide key information about the performance of the American education system compared to other countries. These projects include the Indicators of National Education Systems (INES) at the Organi- zation for Economic Cooperation and Development (OECD), the international assessments conducted by the International Asso- ciation for the Evaluation of Educational Achievement (IEA), and more recently, the OECD’s Program for International Student Assessment (PISA). This report, Comparative Indicators of Edu- cation in the United States and Other G8 Countries: 2002, draws on the most current information produced by these projects avail- able at the time of production of this report (summer 2002) to present a set of education indicators that describes how the U.S.
education system compares with those in other economically developed countries. Updated information from these various projects will be incorporated in subsequent reports.
Although the three international education projects cited above involve many countries worldwide, the primary comparisons in this report are with the Group of Eight or G8 countries. These are the eight most industrialized countries in the world, whose rep- resentatives meet regularly to discuss economic and other policy issues: Canada, France, Germany, Italy, Japan, the Russian Fed- eration, the United Kingdom, and the United States. These coun- tries were selected for comparison because they are relatively simi- lar to the United States in their economic development and because they are among our major economic competitors. When data are not available for the entire United Kingdom, the indica- tors may include comparisons with component jurisdictions of
the United Kingdom such as England or Scotland. Some indica- tors also include comparisons with a smaller grouping of G8 coun- tries based on availability of data.
EDUCATION LEVELS USED FOR THE INDICATORS
The indicators presented in the report are organized around four education levels—preprimary education, primary education, sec- ondary education, and higher education. To ensure comparabil- ity in the indicators across countries, each country restructured its national education data to correspond with the definitions of education levels that were developed in the 1997 revision of the International Standard Classification of Education (ISCED) (UNESCO 1997). Complete definitions of all education levels in the ISCED are provided in the glossary at the end of this report; a brief overview is presented here to provide the reader with a frame of reference to understand what levels of education are included in each of the indicators. The following two paragraphs highlight the key features of education programs from (1) preprimary through secondary education and (2) higher education programs.
Preprimary education includes programs of education for chil- dren at least 3 years of age that involve organized, center-based instructional activities; in most countries, preprimary education is not compulsory. Primary education includes programs that are designed to give students a sound basic education in reading, writing, and mathematics, along with an elementary understand- ing of other subjects such as history, geography, science, art, and music. In the international classification, primary education usually begins at the start of compulsory education (around age 6) and lasts for 6 years. Secondary education encompasses two stages: lower secondary education and upper secondary educa- tion. Lower secondary education includes programs that are de- signed to complete basic education; the standard duration in the international classification is 3 years. Upper secondary educa- tion is designed to provide students with more in-depth knowl- edge of academic or vocational subjects and to prepare them for higher level academic or vocational studies or entry into the la-
4 INTRODUCTION
bor market. The standard duration of upper secondary education in the international classification is 3 years.
Higher education includes two education levels.1 The first level con- tains two types of programs: vocational programs and academic programs. The vocational programs provide a higher level of techni- cal and vocational education that is designed to prepare students for the labor market. In the international classification, these programs are between 2 and 4 years in duration. Academic programs at the first level of higher education are intended to provide sufficient qualifica- tions for gaining entry into advanced research programs and profes- sions with high skill requirements. The international classification includes programs of medium length that are less than 5 years in duration and long programs that are 5 to 7 years in duration. The second level of higher education includes doctoral studies and usu- ally requires the completion of a research thesis or dissertation.2
MAPPING G8 COUNTRIES’ EDUCATION SYSTEMS TO THE ISCED
Differences in the structure of countries’ education systems often make international comparisons difficult. People in the United States, for example, might think that secondary education in other coun- tries is equivalent to high school in the United States or that a first university degree is equivalent to an American bachelor’s degree.
This may be the case in some countries, but not in others. To improve the comparability of education indicators, OECD worked with countries to standardize their education systems into the ISCED, as described above. Table A provides brief descriptions of how each G8 country’s education system was mapped to the ISCED. These descriptions should help the reader obtain a better understanding of the indicators that follow. A more detailed map-
ping of G8 countries’ education systems is provided at the end of this report, after the glossary.3
ORGANIZATION OF THE REPORT
Comparative Indicators of Education in the United States and Other G8 Countries: 2002 begins with a section that highlights key findings and then presents 31 indicators that compare differ- ent aspects of education systems in the United States and the seven other G8 countries. The 31 indicators are organized into the following sections:
Demographic and Socioeconomic Context of Education Preprimary and Primary Education
Secondary Education Higher Education
Education and the Labor Force
The section on the context of education presents indicators that suggest the potential demand for education in countries as mea- sured by the size of the youth population and countries’ current levels of educational attainment. It also contains one indicator on enrollment in education over the life cycle and one on the distribution of enrollments in public and private schools in pri- mary, secondary, and higher education.
The sections on preprimary and primary education, secondary education, and higher education begin with indicators that per- tain to access to education, generally measured by enrollment rates at each education level. The next set of indicators examines school resources such as pupil-teacher ratios, teachers’ instruc- tional strategies, and students’ attitudes toward subjects such as mathematics and science. The third group of indicators com- pares student outcomes, such as test scores on international as- sessments, and system outcomes such as graduation ratios. The sections conclude with a comparison of countries’ financial in- vestments in education.
Finally, the section on education and the labor force examines the relationship between educational attainment and labor force participation and earnings.
1In the international classification, more advanced education is generally referred to as tertiary education. In this report, the term “higher education” is used because this term is more familiar to American readers.
2It should be noted that the international classification includes an education level that straddles the boundary between secondary and higher education:
postsecondary nontertiary education. This program of study—which is primarily vocational in nature—is generally taken after the completion of secondary school, but the subject content is not more advanced than the content of secondary school courses. This level of education is included in indicators of primary and secondary education in all other countries except the United States. In the United States, postsecondary, nontertiary education is not included in the enrollment indicators; expenditures for this education level are partially included in indicators of expenditures of higher education.
3For more complete mappings of the G8 countries’ education systems to the ISCED, see Classifying Educational Programs: Manual for ISCED-97 Implementation in OECD Countries (OECD 1997).
5 INTRODUCTION
Each indicator is presented in a two-page format. The first page presents key findings that highlight how the United States com- pares with the other G8 countries on the indicator. The key findings are followed by a short section that defines the indicator and de- scribes key features of the methodology used to produce the indi- cator. The second page presents graphics that support the key find- ings, sources of data for the indicator, and more detailed notes on interpreting the results.
Most of the indicators included in the report present a snapshot of the U.S. education system at a point in time during the late 1990s, although earlier data are used for some indicators where these are the most current data available on the topic. However, a number of indicators, particularly in the area of education finance, examine changes over time—generally between the mid- and late-1990s.
While longer term trends would also be of interest to policymakers, the lack of comparable data in earlier years makes it difficult to extend the trend analysis further back in time.
Finally, it should be noted that most indicators related to enrollment in education use 1999 as the reference year. In the United States, this designation applies to the 1998–99 school year; indicators are based on enrollment data collected in October 1998. Finance indicators use 1998 as the reference year. In the United States, this designation applies to the 1997–98 school year; indicators are based on expendi- tures for the period from mid-1997 to mid-1998.
DATA SOURCES
There are three main sources of data for this report. The first is the OECD’s Indicators of National Education Systems (INES) project. Most of the OECD data are from tables in Education at a Glance (2001) or the OECD 2001 database. Additional data are from the 1996 and 2000 editions of Education at a Glance.
The second data source is the assessments conducted by the International Association for the Evaluation of Educational Achievement (IEA). These include the 1995 Third International Mathematics and Science Study (TIMSS), the 1999 Third Inter- national Mathematics and Science Study—Repeat (TIMSS-R), and the 1999 Civic Education Study (CivEd).
The third data source is the Program for International Student Assessment (PISA), conducted by the OECD in 2000.
Data for the indicator on youth population are from the International Database of the U.S. Census Bureau.
It should be noted that indicator data from different editions of Edu- cation at a Glance and the OECD database are derived from annual data collections carried out by the OECD. Data from member coun- tries come from a variety of national data sources. These include administrative data collections, school surveys, household surveys, and national financial reports. Most of the indicator data for the United States come from the NCES Common Core of Data (CCD), the NCES Integrated Postsecondary Education Data System (IPEDS), the Current Population Survey (CPS) of the U.S. Census Bureau, and the NCES Schools and Staffing Survey (SASS). It should further be noted that at the time of production of this report, during spring and summer 2002, these sources provided the latest available data on each of the topics included in this report. Information from a new edition of Education at a Glance (2002) or other more recent informa- tion was unable to be included because of production deadlines.
STATISTICAL TESTING
The majority of indicators presented in this report are derived either from administrative records that are based on collections from the universe of respondents or from national sample sur- veys, for which standard errors of national estimates were not available. Consequently, for these indicators, no tests of statisti- cal significance were conducted to establish whether the observed differences from the U.S. average were statistically significant.
However, for the nine indicators derived from the international assessments (Indicators 8 to 10 and 14 to 19), standard t tests were used to determine whether the U.S. estimates were statisti- cally different from other G8 countries’ estimates. Differences were reported if they were found to be statistically significant at the .05 level, using two-tailed tests of significance.
OTHER INTERNATIONAL INDICATOR PUBLICATIONS
The National Center for Education Statistics participates in numer- ous international education activities through the International Ac- tivities Program. More information about the program and other reports published by NCES can be found at http://nces.ed.gov/
surveys/international.
6 INTRODUCTION
Table A. Overview of education systems in the G8 Countries G8 country Overview of system
Preprimary education is offered in kindergartens, nursery schools, and preschools, for children ages 4 and 5. Compul- sory education begins with primary education for children who are 6 years of age and lasts for 5 to 6 years in different provinces. Secondary education is divided into two stages. Lower secondary education lasts 3 to 4 years; upper secondary education lasts 4 to 5 years, includes both general and vocational programs, and leads to a secondary school or high school diploma after 12 years of study in most provinces. Postsecondary, nontertiary education includes university transfer programs in Quebec and short vocational programs (6 months to 2 years). Vocational/technical higher education programs of 1.5 to 3 years duration are offered at community colleges and lead to community college diplomas. Academic higher education includes intermediate programs of 1 to 2 years that permit transfer to 4-year colleges and universities; bachelor’s programs of 4 years’ duration that result in a first university degree; master’s, postgraduate, and first-professional degree programs that award a second university degree; and doctoral programs that culminate in the award of a Ph.D.
Canada
Preprimary education is offered in preschools for children ages 2 through 5. Compulsory school begins with primary education for children who are 6 years of age and lasts for 5 years. Secondary education is divided into two cycles: lower and upper secondary education. Lower secondary education (Collège) lasts 4 years and leads to the award of a Brevet.
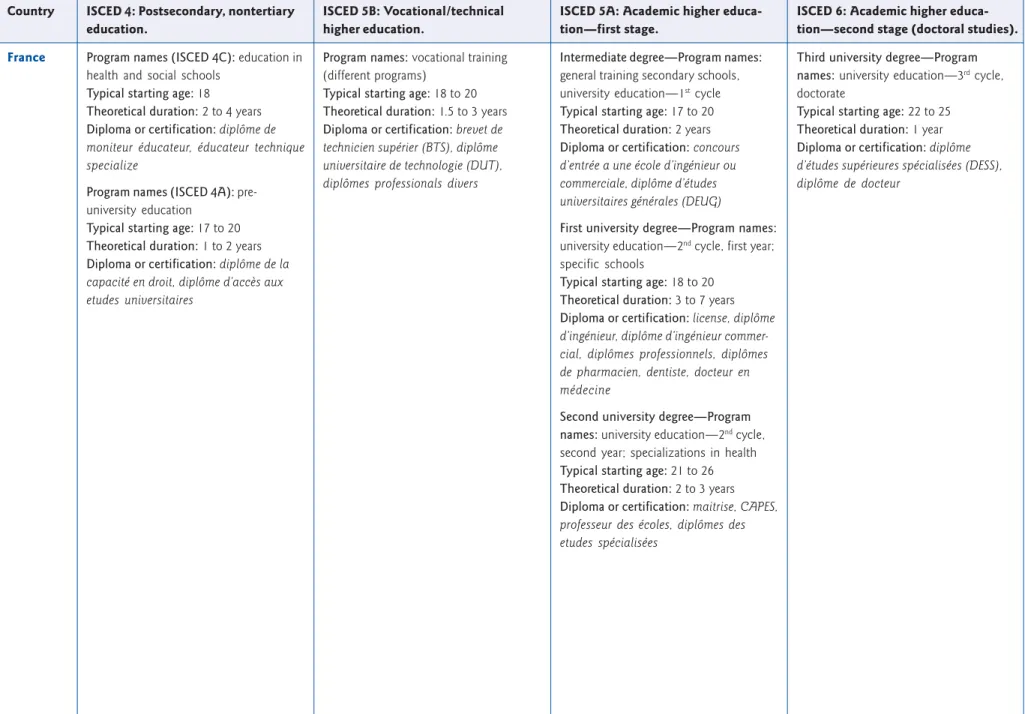
Upper secondary education includes separate vocational and general programs of study. Vocational/technical education programs have a theoretical duration of 1 to 3 years and lead to several different professional certifications. These programs permit entry into higher level vocational and technical education and provide a qualification for entry into the labor market. General programs that permit entry into university studies are of 3 years’ duration and lead to a general or technological baccalauréat. Postsecondary, nontertiary education includes pre-university education and vocational education programs of 2 to 4 years in health and social schools that lead to a diplôme. Vocational/technical higher education programs are of 1.5 to 3 years’ duration and lead to a variety of certifications. Academic higher education includes intermediate programs of 2 years’ duration that lead to a diplôme d’études universitaires générales (DEUG), first university programs of 3 to 7 years’ duration that lead to a license and other specialized diplomas, second university degrees that lead to a maitrise and specialized diplomas, and third university degrees that culminate in the award of a diplôme d’études supérieures spécialisées (DESS) or a diplôme de docteur.
France
Preprimary education in Germany is offered in kindergartens and preschool classes, for children ages 3 to 6. Compulsory education begins at age 6 in primary education and lasts 4 years. Secondary education is divided into two levels: lower and upper secondary education. Lower secondary education lasts 6 years and leads to either a Hauptschulabschluss or a Realschulabschluss. Upper secondary education includes separate vocational and general programs of study. Vocational and technical education programs are offered in specialized vocational schools, typically last from 1 to 3 years, and lead to several different diplomas or certificates. These programs permit entry into higher level vocational and technical education and provide a qualification for entry into the labor market. General programs that permit entry into university studies are offered at Gymnasien and specialized vocational schools and lead to the award of an Abitur and other specialized certificates. Postsecondary, nontertiary education includes second-cycle vocational programs that lead to several specialized certifications. Vocational/technical higher education programs are offered in specialized academies, trade and technical schools, and colleges of public administration; are 2 to 4 years in length; and lead to a range of certificates and diplomas. Academic higher education or university studies last 4 to 5 years and lead to the award of a Diploma. Doctoral education lasts 2 years and leads to the award of a Promotion.
Germany
Preprimary education in Italy begins at age 3 and lasts for 3 years. Compulsory education starts in primary education at age 6, lasts for 5 years, and leads to the award of a licenza elementare. Secondary education is divided into two levels:
lower and upper secondary education. Lower secondary education lasts for 3 years and leads to the award of a licenza media. Upper secondary education includes separate vocational and general programs of study. Vocational education is offered in regional vocational and technical institutes and in art high schools. Programs last for 2 to 4 years and lead to the award of professional certificates and a muturità artistico. General programs that permit entry into university studies last for 5 years and lead to a diploma di maturità classica, scientifica, linguistica, and tecnica. Postsecondary,
nontertiary education is offered in regional education schools, has a duration of 0.5 years, and leads to a second-level vocational qualification. Vocational/technical higher education programs are offered in sports, fine arts, and dramatics, last for 3 to 4 years, and lead to the award of diplomas in these areas. Academic higher education includes first university programs of 3 to 6 years, which lead to a diploma di laurea; second university programs of 2 to 5 years’
duration, which lead to a diploma di specializzazione; and doctoral programs of 3 to 5 years, which lead to the award of the titulo di dottore di recerca.
Italy
7 INTRODUCTION
Table A. Overview of education systems in the G8 countries—Continued G8 country Overview of system
Japan Preprimary education is offered in Japan in day nurseries and kindergartens for children ages 3 to 5 and has a duration of 1 to 3 years. Compulsory education begins with primary education for children who are 6 years of age and lasts for 6 years. Secondary education is divided into two stages: lower and upper secondary education. Lower secondary school lasts 3 years. Upper secondary education includes separate programs of vocational and general education. Vocational education lasts 3 years and leads to a certificate of graduation that provides a qualification for the labor market. General education that leads to university studies also lasts 3 years and leads to a certificate of graduation. Vocational/technical higher education programs offered at junior colleges and specialized training colleges last 2 to 3 years and lead to the award of an associate’s or a technical associate’s diploma. Academic higher education includes first university degree programs that last for 4 to 6 years and lead to the award of a bachelor’s degree; second university programs of 2 years’
duration that lead to the award of a master’s degree; and graduate and professional programs that culminate with the award of a doctor’s degree.
Russian Federation
Preprimary education in the Russian Federation begins for children age 3 and lasts 3 years. Compulsory school begins with primary education for children who are 6 to 7 years of age and lasts for 4 years. Secondary education is divided into two cycles: basic and upper secondary education. Basic education lasts for 5 years and leads to the award of a certificate I.
Upper secondary education includes separate vocational and general programs of study. Vocational/technical education programs last 2 to 3 years and lead to a certificate 2 or a diploma I. These programs provide a qualification that leads to direct entry into the labor market. General programs that permit entry into university studies last 2 years and lead to the award of an attestat. Postsecondary nontertiary education programs are of 1 to 2 years’ duration and lead to a certificate 2. Vocational/technical higher education programs last for 3 years and lead to a specialist’s diploma 1. Academic higher education includes intermediate programs of 2 years’ duration that lead to an attestat or a specialist’s diploma I; first university programs of 4 to 7 years’ duration that lead to a bachelor’s degree or a specialist’s diploma 2; second university programs of 1 to 2 years’ duration that lead to a master’s degree or an internatura; and doctoral programs of 2 to 3 years’
duration that lead to a kandidat nauk or a doctor nauk.
United Kingdom
Primary education in the United Kingdom is offered in nursery schools and classes, play groups and day nurseries, and reception classes, for children ages 2 to 4. Compulsory education begins at age 5 in primary education and lasts 5 years.
Secondary education is divided into two levels: lower and upper secondary education. Lower secondary education lasts 3 years. Upper secondary education includes separate vocational and general programs of study. Vocational and technical education programs are offered in a variety of programs, typically last for 1 to 2 years, and lead to the award of a general national vocational qualification (GNVQ) and other certificates. These programs permit entry into higher level vocational and technical education and provide a qualification for entry into the labor market. General programs that permit entry into university studies last 1 to 2 years and lead to the General Certificate of Education (GCE) A level or equivalent and other certifications. Postsecondary, nontertiary education is offered in health education access courses, which are of varied length and do not lead to a diploma or certification. Vocational/technical higher education programs are offered in a variety of programs, last for 1 to 3 years, and lead to various level 4 and 5 qualifications. Academic higher education (university studies) includes first university programs that last 2 to 5 years and lead to a bachelor’s degree; second university programs that last 1 to 2 years and lead to a master’s degree and postgraduate diplomas and certificates; and doctoral programs that last 3 years and lead to the award of a Ph.D.
United States Preprimary education is offered in prekindergarten and kindergarten classes in public and private elementary schools and in early childhood development programs in private nursery schools and early childhood education centers for children ages 3 to 5. Primary education is offered in elementary schools, begins at age 6, and lasts for 6 years. Secondary education is divided into two levels. Lower secondary education lasts 3 years and is offered in grades 7 to 9 in middle schools or junior high schools and grade 9 in high schools. Upper secondary education lasts 3 years and includes grades 10 to 12 in high schools. Postsecondary, nontertiary education is offered in community colleges and private for-profit trade schools and includes vocational certification programs of 6 months to 1 year. Vocational/technical higher educa- tion is offered at community colleges, is typically about 2 years in length, and results in an associate’s degree. Academic higher education includes first university programs that last 4 years and lead to the award of a bachelor’s degree; second university programs that lead to a master’s degree, a professional certificate, or a professional degree in fields such as medicine and law; and doctoral programs that lead to a Ph.D.
Highlights
11
HIGHLIGHTS
INTRODUCTION
This report is designed to describe how the U.S. education sys- tem compares with the education systems in the Group of Eight or G8 countries. These countries, which include Canada, France, Germany, Italy, Japan, the Russian Federation, the United King- dom, and the United States, are among the world’s most eco- nomically developed economies. Comparative Indicators of Edu- cation in the United States and Other G8 Countries: 2002 draws on the most current information about education from the Indi- cators of National Education Systems (INES) project at the Orga- nization for Economic Cooperation and Development (OECD), the international assessments conducted by the International Association for the Evaluation of Educational Achievement (IEA), and more recently, the OECD’s Program for International Student Assessment (PISA). The main findings of this report are high- lighted below. The highlights are organized around the five ma- jor sections of the report.
CONTEXT OF EDUCATION
Potential Demand for Education
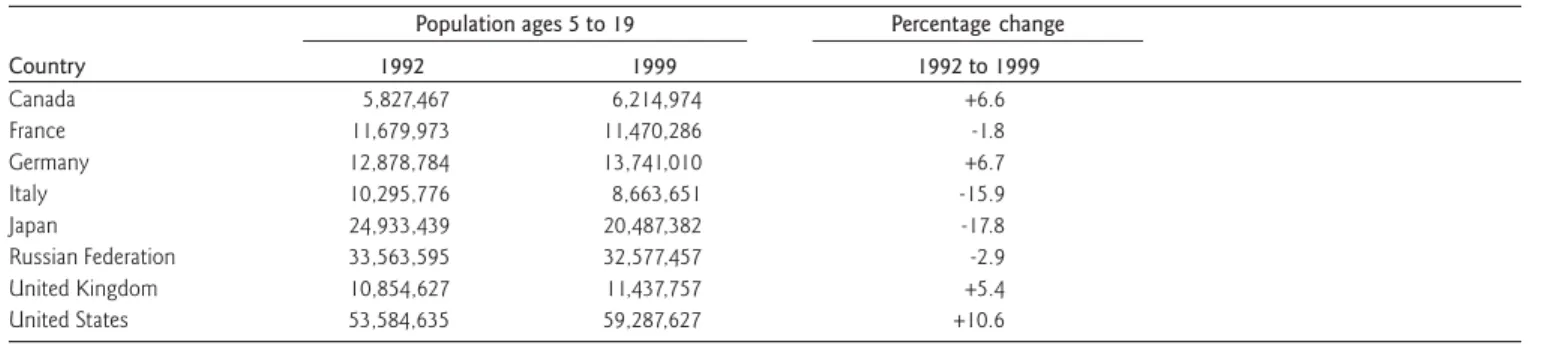
Relative Size of the School-Age Population. Primary and second- ary school-age children (between the ages of 5 and 19) repre- sented a larger proportion of the total population in the United States than in all seven other countries presented except the Russian Federation. The United States was one of only three G8 countries whose school-age population grew in absolute number between 1992 and 1999—the other two being the United King- dom and Germany. (Indicator 1)
Educational Attainment of the Population
Completion of Upper Secondary Education. In 1999, the propor- tion of adults who completed at least an upper secondary educa- tion was higher in the United States than in the six other coun- tries presented. Among younger adults (ages 25 to 34), the upper secondary completion rate was still higher in the United States than in five of the six other countries presented, despite broad- ened access to upper secondary education in these countries.
Only Japan had a higher upper secondary school completion rate for people in this age group than the United States. (Indicator 2) Completion of Higher Education. Similarly, in 1999, the United States had a higher proportion of all adults (ages 25 to 64), as well as younger adults (ages 25 to 34), who had completed a first university degree than the six other countries presented. How- ever, the difference in the proportion of younger adults (ages 25 to 34) and older adults (ages 55 to 64) who had completed a first university degree was smaller in the United States than in Japan and Canada, suggesting that these two countries have expanded access to higher academic education to a larger segment of their populations in recent years. (Indicator 2)
PREPRIMARY AND PRIMARY EDUCATION
Access to Preprimary Education
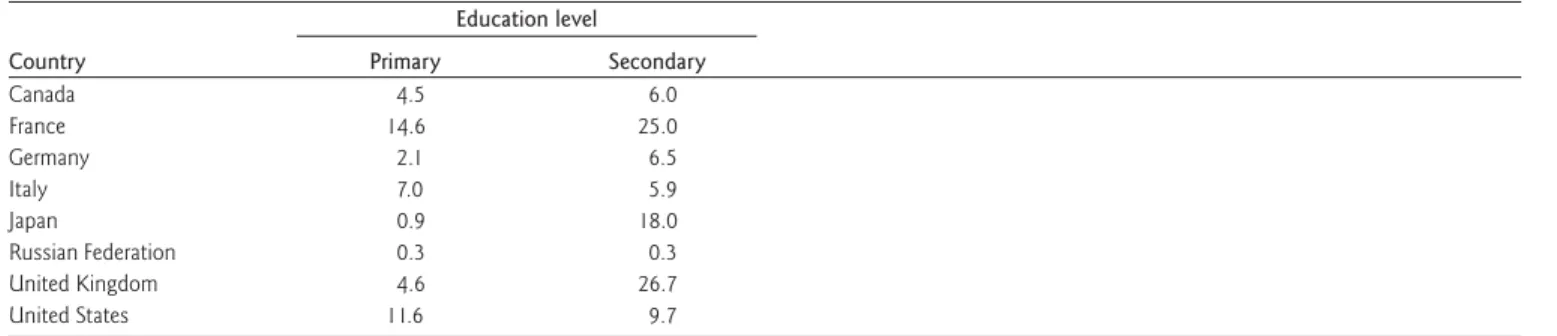
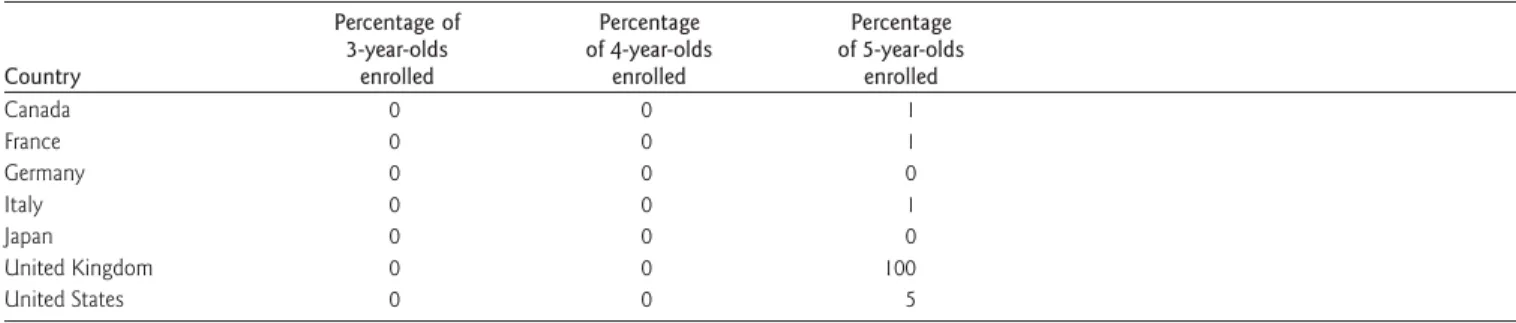
Participation in Preprimary Education. In 1999, enrollment rates of children ages 3 to 5 in preprimary education were lower in the United States than in France, Germany, Italy, and Japan. France and Italy had nearly universal enrollment of 3- to 5-year-olds in preprimary education. The United States had lower enrollment rates of 3- and 4-year-olds in preprimary education than all other countries presented except Canada and lower enrollment rates of 5-year-olds in preprimary and primary education than all other countries presented except Canada and Germany. (Indicator 5)
Human Resources in Primary Education
Student/Teacher Ratios in Primary Education. The United States had the second-lowest student/teacher ratio in primary educa- tion of the countries presented in 1999. Only Italy had a lower student/teacher ratio. (Indicator 6)
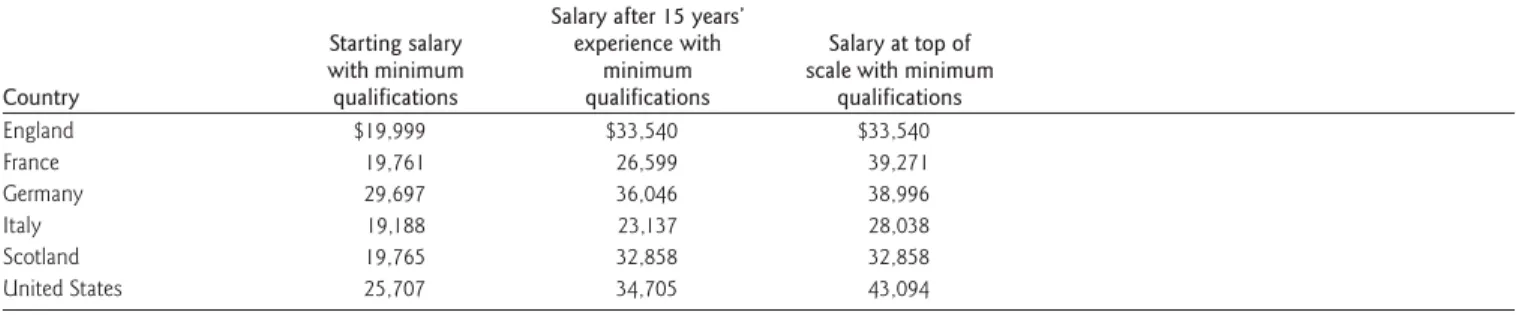
Teachers’ Salaries in Public Primary Education. In 1999, primary school teachers in the United States with minimum qualifications had higher average starting salaries than teachers in France, Italy, England, and Scotland, but lower average starting salaries than teachers in Germany. U.S. primary teachers with minimum quali- fications at the top of the salary schedule had higher average sala- ries than their counterparts in all of these countries. (Indicator 7)
12 HIGHLIGHTS
Achievement of Primary School Students
Achievement in Mathematics and Science. According to the Third International Mathematics and Science Study conducted in 1994–
95, American fourth-graders had higher average scores in both mathematics and science than their counterparts in Canada, En- gland, and Scotland, but lower average scores in mathematics than Japanese students. No differences were detected in Japa- nese fourth-grade students’ average scores in science relative to American students’ average scores. (Indicator 10)
SECONDARY EDUCATION
Human Resources in Secondary Education
Student/Teacher Ratios in Secondary Education. In contrast with primary education, in 1999, the United States had the second- highest student/teacher ratio in secondary education of the eight countries presented—second only to Canada. (Indicators 6 and 12)
Teachers’ Salaries in Public Upper Secondary Education. Similar to teachers’ salaries in primary education, in 1999, public upper secondary teachers in the United States with minimum qualifi- cations had higher average starting salaries than teachers in France, Italy, England, and Scotland, but lower starting salaries than teach- ers in Germany. U.S. public upper secondary teachers with mini- mum qualifications at the top of the salary schedule had higher average salaries than teachers in all other countries reporting data except Germany. (Indicators 7 and 13)
Achievement of Secondary School Students
Achievement in Mathematics and Science. According to the Third International Mathematics and Science Repeat (TIMSS-R) Study conducted in 1999, American eighth-grade students had lower average scores in both mathematics and science than Japanese and Canadian students, but higher average scores than Italian students. Students from the Russian Federation also scored higher on average in mathematics, but no differences were detected in the scores of Russian and U.S. students in science. No differ- ences were detected in the mathematics scores of English and U.S. students, but U.S. students had lower average mathematics scores than their English counterparts. (Indicator 16)
Proficiency in Reading. In 2000, American 15-year-olds had lower average scores than their Canadian counterparts on the PISA read- ing literacy scale, but no difference was detected between aver-
age U.S. 15-year-olds’ performance compared to the performance of 15-year-olds in France, Italy, Germany, Japan, or the United Kingdom. The proportion of 15-year-olds performing at the high- est level was higher in the United States than in Italy and the Russian Federation, but no difference was detected between the United States and Canada, France, Germany, Japan, and the United Kingdom. (Indicator 17)
Achievement in Civic Education. American 14-year-olds had higher scores on the assessment of total civic knowledge (comprised of a civic content and civic skills set of questions) than their counterparts in England, Germany, and the Russian Federation on the Civic Educa- tion Study (1999). No difference was detected in the scores of Ameri- can and Italian 14-year-olds. (Indicator 19)
Completion of Upper Secondary Education
Graduation Rates from Upper Secondary Education. In 1999, the United States had a lower secondary school graduation rate than Japan, Germany, and France, but a higher rate than Italy.
(Indicator 20)
Expenditures for Primary and Secondary Education
Expenditures per Student for Primary Education. Expenditures per student for primary education were higher in the United States than in the five other countries presented in 1994 and 1998.
(Indicator 21)
Expenditures per Student for Secondary Education. Expenditures per student for secondary education were also higher in the United States than in the other five countries that reported data in 1994 and 1998. (Indicator 21)
Expenditures for Primary and Secondary Education as a Percent of Gross Domestic Product (GDP). While the United States had higher expenditures per student for primary and secondary edu- cation compared to the other countries presented, the United States placed in the middle of the countries presented based on public expenditures for primary and secondary education as a percent of GDP in 1998. With the addition of private expendi- tures for primary and secondary education, the United States still placed in the middle of the countries presented based on total public and private expenditures as a percent of GDP, falling behind France and Canada, about the same as in Germany, and ahead of Italy and Japan. (Indicator 22)
13 HIGHLIGHTS
HIGHER EDUCATION
Access to Higher Education
Participation in Higher Education. The enrollment rate in higher education was higher in the United States than in the six coun- tries presented in 1999. While the net enrollment rate in higher education was relatively stable in the United States, France, and Germany between 1994 and 1999, the rate increased in the United Kingdom. (Indicator 24)
Completion of Higher Education
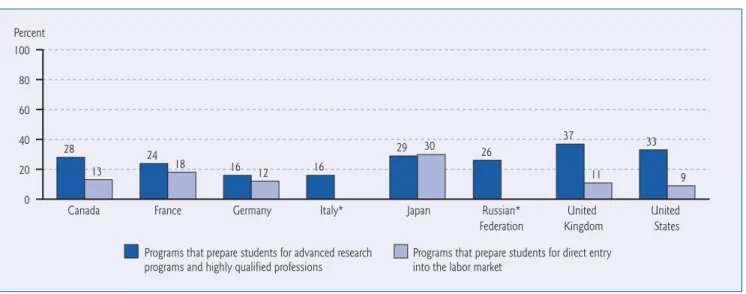
Graduation from First University Programs of Higher Education. In 1999, the graduation rate from first university programs of me- dium length (3 to less than 5 years) was higher in the United States than in all G8 countries except the United Kingdom. In the United States, the graduation rate from first university programs that prepare students for advanced research training and highly qualified professions was more than three and a half times the graduation rate from technical and vocational programs that pre- pare students for direct entry into the labor market. (Indicator 25)
Science and Mathematics Degrees
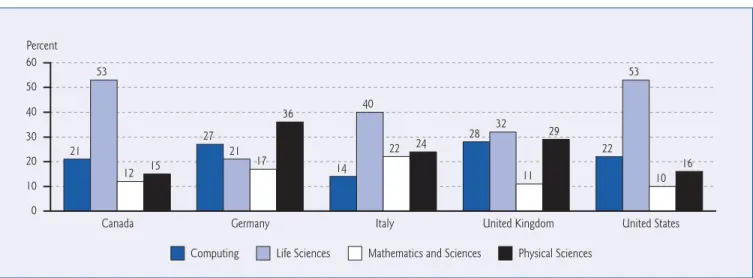
First University Degrees in Science and Mathematics. In 1999, the United States awarded a smaller percentage of first university degrees in science than Canada, France, Germany, and the United Kingdom. About 10 percent of all first university degrees awarded in science in the United States were in mathematics and statis- tics—the lowest percentage of the five countries presented.
(Indicator 26)
Expenditures for Higher Education
Expenditures per Student for Higher Education. In 1998, expendi- tures per student for higher education were higher in the United States than in all countries presented—more than twice as high as in Germany, Japan, and the United Kingdom, and more than two and one half times the expenditures per student in France.
Between 1995 and 1998, all countries presented showed increases in average expenditures per student for higher education. During this period, the gap widened in average expenditures per student for higher education between the United States and the other countries presented. (Indicator 27)
Expenditures for Higher Education as a Percent of GDP. In 1998, public expenditures for higher education as a percent of GDP were higher in the United States than in the six other countries pre- sented, except Canada. With the addition of private expendi-
tures, the United States replaced Canada as the country with the highest expenditures for higher education as a percent of GDP.
This contrasts with the position of the United States (in the middle of the six countries) for expenditures on primary and secondary education as a percent of GDP. (Indicators 22 and 28)
EDUCATION AND THE LABOR FORCE
Labor Market Outcome of Education
Labor Force Participation Rates. In 1999, adults ages 25 to 64 in the United States who completed upper secondary education (high school or its equivalent) had a higher labor force participa- tion rate than high school noncompleters. The difference in la- bor force participation rates between upper secondary school completers and noncompleters was smaller in the United States than in Canada, Germany, Italy, and the United Kingdom, about the same as in France, and greater than in Japan. (Indicator 30) Labor Force Participation Rates. In 1999, adults ages 25 to 64 in the United States, who completed a program of academic higher education had a labor force participation rate that was 8 percent- age points higher than the participation rate of adults who com- pleted high school or its equivalent. The difference in labor force participation rates between completers of academic higher edu- cation and completers of upper secondary education (high school in the United States) was smaller in the United States than in Germany, Italy, and Japan, about the same as in the United King- dom, and greater than in Canada and France. (Indicator 30) Average Earnings. In 1999, adults ages 25 to 64 in the United States who completed less than an upper secondary education (high school) earned, on average, about 67 percent of the earn- ings of adults who completed upper secondary education. The earnings disadvantage for noncompleters of upper secondary education was smaller in the United States than in the United Kingdom and Italy, but greater than in Germany, Canada, and France. (Indicator 31)
The average earnings of adults, ages 25 to 64 in the United States, who completed a program of academic higher education were, on average, about 180 percent of the earnings of completers of upper secondary education. The relative advantage of U.S. higher education completers over upper secondary education completers was greater than in the other four countries presented, although in every country represented those who completed academic higher education earned more than those who completely only upper secondary education. (Indicator 31)
indicators part i
Context of Education
16 INDICATORS PART I: CONTEXT OF EDUCATION
Key Findings: Canada, France, Germany, Italy, Japan, Russian Federation, United Kingdom, United States
In 1999, the population ages 5 to 19 (children of primary- and secondary-school age) represented nearly 22 percent of the total population in the United States. The youth percentage of the to- tal population in the United States was equal to that in the Rus- sian Federation, but was higher than the youth population in all other G8 countries. The range in these countries was from 15 percent in Italy to 20 percent in Canada (figure 1a).
The youth population ages 5 to 19 grew by 11 percent in the United States between 1992 and 1999. The growth rate was higher
in the United States than in the three other countries that experi- enced growth in this age group over this period—
7 percent in Germany and Canada, and 5 percent in the United Kingdom (figure 1b).
In contrast with the United States, the youth populations in France, the Russian Federation, Italy, and Japan declined over this pe- riod—by 2 percent, 3 percent, 16 percent, and 18 percent, respectively (figure 1b).
Definition and Methodology
The percent of the population ages 5 to 19 in 1992 and 1999 is calculated by dividing the population ages 5 to 19 by the total population for each respective country. The percent change in
population ages 5 to 19 is calculated by subtracting the popula- tion ages 5 to 19 in 1992 from this population in 1999 and divid- ing by the 1992 population ages 5 to 19.
YOUTH POPULATION
17 INDICATORS PART I: CONTEXT OF EDUCATION
indicator1
20 20
Canada
20 19
France
16 17
Germany
18 15
Italy
20 16
Japan
23 22
Russian Federation
19 19
United Kingdom
21 22
United States Percent
0 10 20 30
1992 1999
NOTE: The United Kingdom includes England, Northern Ireland, Scotland, and Wales.
SOURCE: U.S. Census Bureau, International Database, 2001.
Figure 1a. Percentage of the total population ages 5 to 19, by country: 1992 and 1999
-30 -20 -10 0 10 20 30
+7
-2
+7
-16 -18 -3
+5
+11 Percent
Canada France Germany Italy Japan Russian
Federation
United Kingdom
United States
NOTE: The United Kingdom includes England, Northern Ireland, Scotland, and Wales.
SOURCE: U.S. Census Bureau, International Database, 2001.
Figure 1b. Percentage change in the population ages 5 to 19, by country: 1992 and 1999
18 INDICATORS PART I: CONTEXT OF EDUCATION
EDUCATIONAL ATTAINMENT
Key Findings: Canada, France, Germany, Italy, Japan, United Kingdom, United States
In 1999, 87 percent of the adult population ages 25 to 64 in the United States had completed at least an upper secondary educa- tion—a higher percentage than in all other countries presented.
While at least 75 percent of the adult population had completed at least an upper secondary education in Canada (79 percent), Japan (81 percent), and Germany (81 percent), the proportions were lower in the United Kingdom (62 percent), France (62 per- cent), and Italy (42 percent) (figure 2a).
In the United States, the proportion of younger adults (ages 25 to 34) that had completed at least an upper secondary education was about 7 percentage points higher than the proportion of older adults (ages 55 to 64). This relatively small difference (88 percent compared to 81 percent) reflects the fact that the United States has provided a relatively high level of access to upper secondary education for many years (figure 2a).
In contrast, several other countries presented have increased ac- cess to secondary education to a larger segment of their popula- tions over the last few decades. This is evident in the larger differ- ences in the proportion of older and younger adults who completed at least an upper secondary education in 1999—34 percentage points in France and Italy, 33 percentage points in Japan, and 25 percentage points in Canada (figure 2a).
As a result of increased access to secondary education in the other countries presented, the United States is in a different position on the proportion of young adults (ages 25 to 34) who completed at least an upper secondary education. For this age group, the 88 percent completion rate in the United States in 1999 was lower
than the rate in Japan (93 percent). However, the proportion of secondary school completers in the young adult population was still a little higher in the United States than in Canada (87 per- cent) and Germany (85 percent), and much higher than in France (76 percent), the United Kingdom (66 percent), and Italy (55 percent), despite broadened access to secondary education in these countries (figure 2a).
Comparisons of completion rates in higher education for the coun- tries presented are very similar to completion rates in upper sec- ondary education. In 1999, the United States had the highest proportion of adults ages 25 to 64 that had completed a first uni- versity degree (27 percent) among the countries presented. The completion rate in Canada (19 percent), with the second-highest completion rate of all countries presented, was 8 percentage points lower than the completion rate in the United States (figure 2b).
As with secondary education, most countries presented also in- creased access to higher education to a larger segment of their populations in recent years. Although the United States still had the highest proportion of adults ages 25 to 34 who had com- pleted at least a first university degree in 1999 (29 percent), the gaps between the United States and Japan and between the United States and Canada was smaller for younger adults than for older adults. With Japan, the gap was 14 percentage points for adults ages 55 to 64 but only 6 percentage points for adults ages 25 to 34. Similarly, with Canada the gap was 9 percentage points for adults ages 55 to 64, but only 6 percentage points for adults ages 25 to 34 (figure 2b).
Definition and Methodology
This indicator shows the percent of the population ages 25 to 64 that completed a secondary education in 1999, and the percent of the population ages 25 to 64 that completed a degree in higher education. In the United States, the percentage of individuals who
completed a secondary education includes individuals who re- ceived a high school diploma and individuals who obtained a General Educational Development (GED) award.