Stability of Tall Buildings
DAVID GUSTAFSSON & JOSEPH HEHIR
Department of Civil and Environmental Engineering Master’s Thesis 2005:12 Division of Structural Engineering
Concrete Structures
CHALMERS UNIVERSITY OF TECHNOLOGY Göteborg, Sweden 2005
MASTER’S THESIS 2005:12
Stability of Tall Buildings
DAVID GUSTAFSSON & JOSEPH HEHIR
Department of Civil and Environmental Engineering Division of Structural Engineering
Concrete Structures
CHALMERS UNIVERSITY OF TECHNOLOGY Göteborg, Sweden 2005
Stability of Tall Buildings
DAVID GUSTAFSSON & JOSEPH HEHIR
© DAVID GUSTAFSSON & JOSEPH HEHIR, 2005
Master’s Thesis 2005:12
Department of Civil and Environmental Engineering Division of Structural Engineering
Concrete Structures
Chalmers University of Technology SE-412 96 Göteborg
Sweden
Telephone: + 46 (0)31-772 1000
Cover:
Deformation figure from a FE-analysis of a multi storey structure subjected to twisting.
Reproservice / Department of Civil and Environmental Engineering Göteborg, Sweden 2005
CHALMERS Civil and Environmental Engineering, Master’s Thesis 2005:12 I Stability of Tall Buildings
DAVID GUSTAFSSON & JOSEPH HEHIR
Department of Civil and Environmental Engineering Division of Structural Engineering
Concrete Structures
Chalmers University of Technology
ABSTRACT
The methods used for stability calculations of columns, solid shear walls, pierced shear walls, coupled and uncoupled components, cores, single storey structures and multi storey structures have been examined. The examination performed in order to ascertain short comings or advantages for different stabilising components and systems.
Analyses were made of deflection and buckling combining bending and shear for columns, solid shear walls and pierced shear walls. Calculation methods for single and multi storey structures concerning deflection and buckling due to translation, rotation or a combination of the two are analysed and the results are compared with finite element analyses results. The importance of pure torsion is somewhat neglected in these methods and therefore a method was devised for including a components torsional resistance in the calculations.
The calculation methods are computer assisted through the use of Mathlab, Mathcad and Excel. Comparisons of results are made between the calculation methods and Finite Element Analysis performed with a programme called SOLVIA.
Vianello’s method for calculating critical buckling loads, of columns and solid shear walls, due to bending has proven its worthiness. The method for calculating stability of pierced shear walls, according to studied, has proven itself to be in need of improvements. The use of the polar moment of inertia has proven to give inaccurate results. The result comparison of the single storey structures concerning translation, rotation and combined rotation and translation show that the calculation methods are satisfactory. Concerning multi storey structures subjected to translation or rotation a question arose concerning the interaction between the stabilising components and the floor slabs. The inclusion of a central cores own torsional resistance into the calculation methods led to improved results.
The results showed that further investigation of the calculation methods concerning stability of tall buildings is advisable and that specifically methods for determining the interactive behaviour of stabilising systems joined by floor slabs should be researched.
Key words: Tall buildings; Stability; 2nd order effects; Global buckling; Vianello;
Shear angle; Stiffness; Torsion; Warping;
CHALMERS, Civil and Environmental Engineering, Master’s Thesis 2005:12
II
CHALMERS, Civil and Environmental Engineering, Master’s Thesis 2005:12 III
Contents
1 INTRODUCTION 1
1.1 Background 1
1.2 Aim and scope 1
1.3 Scientific approach 1
1.4 Methods presented 2
1.5 Limitations 2
2 TALL BUILDINGS 3
2.1 Evolution of tall buildings through the ages 3
2.2 Loads 10
2.2.1 Load distribution 11
2.2.2 Estimates concerning loads, environment and material 17
2.2.3 Loading assumptions 18
2.2.4 1st and 2nd order theory 20
2.3 Buckling and torsional phenomena 20
2.3.1 Bending and shear 20
2.3.2 Torsion 21
2.4 Principles for stabilisation of tall buildings 26
2.4.1 Stabilising components 26
2.4.1.1 Columns 26
2.4.1.2 Towers 26
2.4.1.3 Shear walls 27
2.4.2 Situating of stabilising components 28
2.4.3 Guidelines for choosing stabilising systems 30
2.5 Reality versus model 32
2.5.1 Theory of linear elasticity 32
2.5.2 Young’s modulus 34
2.5.3 Long term effects 34
2.6 Problems concerning tall buildings 35
2.6.1 Comfort 36
2.6.2 Pierced shear walls 36
2.6.3 Load distribution 36
2.6.4 Twisting and open cross sections 37
2.6.5 Interaction between the soil and the foundation 37
2.6.6 Methods 38
2.6.7 Summation of the effect from approximation 39 3 CALCULATION METHODS FOR STABILISING COMPONENTS 40 3.1 Solid components – Columns and shear walls 40 3.1.1 Buckling load through bending – General calculations 40 3.1.2 Bending contribution of cantilever columns 43
CHALMERS, Civil and Environmental Engineering, Master’s Thesis 2005:12
IV
3.1.3 Shear contribution of cantilever columns 44
3.1.4 Combined bending and shear 45
3.1.5 Derivation of magnification factor 46
3.2 Pierced shear walls 48
3.2.1 Derivation of buckling load 49
3.2.1.1 Bending in the transversal part 50
3.2.1.2 Bending in the vertical part 50
3.2.1.3 Shear in the transversal part 51
3.2.1.4 Shear in the vertical part 51
3.2.2 Calculation method for deflection 52
3.3 Vianello’s method 55
3.4 Elastic restraint 64
4 CALCULATION METHODS FOR STABILISING SYSTEMS 67
4.1 Single storey system acting in a plane 67
4.1.1 Assumptions 67
4.1.2 Stiffness number 68
4.1.3 System of columns acting in one plane 69
4.1.4 Stiffness number for a non-stabilising unit 70 4.1.5 Horizontal load distribution among columns in a plane 71 4.1.6 Calculation method of moments on a single storey one plane system 72 4.1.7 Numerical example - Columns in one plane 75
4.2 Stabilisation systems – Buckling in space 79
4.2.1 General expression of translation and rotation 79 4.2.2 Derivation of critical buckling load through rotation 80 4.2.3 Calculation methods for establishing critical buckling load 82 4.2.3.1 Stiffness due to influence from shear 82
4.2.3.2 Location of the rotation centre 83
4.2.3.3 Simplification of stiffness numbers 83
4.2.3.4 Non stabilising units 84
4.2.3.5 Buckling load for single storey building – summation 85 4.2.3.6 Buckling load - Multi-storey expressions 86 4.2.4 Numerical example - Single storey structure 88
4.2.4.1 Buckling load through translation 89
4.2.4.2 Buckling load through rotation 91
4.2.5 Numerical example - Multi storey structure 93
4.3 Dimensioning forces and moments 96
5 INVESTIGATIONS 101
5.1 FE-analyses of solid shear walls 101
5.1.1 Check of FE-model 102
5.1.1.1 Modelling - Deflection of solid shear walls 102 5.1.1.2 Modelling - Buckling of solid shear walls 105
5.1.2 Results 108
5.1.2.1 Deflection 108
5.1.2.2 Buckling 109
CHALMERS, Civil and Environmental Engineering, Master’s Thesis 2005:12 V
5.2 Investigation of the Vianello method 110
5.2.1 Case 1: Even load, uneven stiffness 111
5.2.2 Case 2: Uneven load, uneven stiffness 113
5.2.3 Case 3: Slender wall - Uneven load, uneven stiffness 115 5.2.4 Case 4: Robust wall - Uneven load, uneven stiffness 117
5.2.5 Results 118
5.3 Investigation of pierced shear walls 119
5.3.1 Results of deflection and buckling load 121 5.3.2 Improvements for buckling load results 122 5.3.2.1 Altering the deformable length of the transversal 123
5.3.2.2 Shear factors 128
5.3.2.3 Shear angles 133
5.3.3 Stress distribution 136
5.3.3.1 Hand calculation methods 136
5.3.3.2 Results 139
5.3.4 Conclusions and recommendations 143
5.4 Investigation of the polar moment of inertia 144 5.5 Force distribution in single storey structures. 149
5.5.1 FE-model 149
5.5.2 Case 1 – Study of translation 150
5.5.3 Case 2 – Study of rotation 151
5.5.4 Case 3 – Study of combined translation and rotation 154
5.6 Study of the overall stiffness equation 158
5.6.1 Coupled and uncoupled approach 160
5.6.2 Case 1 - Coupled approach 161
5.6.3 Case 2 – Uncoupled approach 164
5.6.4 Conclusions 166
5.7 Force distribution in a multi storey structure 167
5.7.1 Modelling 167
5.7.2 Study of translation 169
5.7.2.1 Case 1a - Walls at the extremities 170
5.7.2.2 Case 1b - Walls close to RC 172
5.7.3 Study of twisting 174
5.7.3.1 Case 2a – Walls at the extremities 177
5.7.3.2 Case 2b – Walls close to the RC 179
5.7.3.3 Discussion 182
5.7.4 Torsional resistance in cores 183
5.7.4.1 Expression for including torsional stiffness of cores 185
5.7.4.2 Case 1 – U-shaped core 189
5.7.4.3 Case 2 – Closed rectangular core, load on top floor 190 5.7.4.4 Case 3 – Closed rectangular core, load on all ten floors 192
5.7.4.5 Results 193
5.7.5 Warping effects 194
6 CONCLUSIONS AND RECOMMENDATIONS 200
6.1 Conclusions 200
6.2 Recommendations 201
CHALMERS, Civil and Environmental Engineering, Master’s Thesis 2005:12
VI
6.3 Further studies 202
7 REFERENCES 203
APPENDIX A VIANELLO ITERATIONS
APPENDIX B RESULTS - PIERCED SHEAR WALLS
APPENDIX C FORCE DISTRIBUTION - SINGLE STOREY STRUCTURES APPENDIX D FORCE DISTRIBUTION - MULTI STOREY STRUCTURES APPENDIX E EQUATIONS FOR COUPLED COMPONENTS
APPENDIX F CALCULATION OF BUCKLING LOADS IN MATHCAD
CHALMERS, Civil and Environmental Engineering, Master’s Thesis 2005:12 VII
Preface
This thesis is the culmination of 4½ arduous years of study at Chalmers University of Technology, Sweden. It has been produced through the cooperation of Reinertsen Sverige AB and the Division of Structural Engineering at the Department of Civil and Environmental Engineering of Chalmers University of Technology.
Professor Björn Engström, the examiner, has provided continued assistance and invaluable insights on stability during the production of this work. Morgan Johansson, PhD, of Reinertsens has supervised this endeavour diligently. Morgan has helped considerable through his clarity, enthusiasm and his unselfish willingness to assist while directing this project.
Assistance, for which we are very thankful, with the FE-programme SOLVIA has been provided by Ginko Gueorguiev of Reinertsens.
Our opponents, Morgan Mathiasson & Nicklas Karlsson, have continually assisted with the development of this thesis and we thank them wholeheartedly. Good luck to both of you for the future.
Finally, but certainly not least, we wish to thank our families who have persevered with us through our studies at Chalmers. Without their love, patience, commitment and understanding this thesis would never have been completed. Maria, Anja, Erik, Sasha and Bonnie, we thank you for enduring with us.
Göteborg February 2005
David Gustafsson & Joseph Hehir
CHALMERS, Civil and Environmental Engineering, Master’s Thesis 2005:12
VIII
Notations
Roman upper case letters
A Cross sectional area, constant depending on load application
B Constant depending on shape of the 2nd order vertical load, bimoment Bx Stiffness value due to influence of shear in the x-direction
By Stiffness value due to influence of shear in the y-direction C Overall stiffness value
CDIR Directional coefficient CG Centre of gravity
CTEM Seasonal coefficient CALT Altitude coefficient
E Young’s modulus
Eef Young’s modulus due to long term effects G Shear modulus
H Horizontal force
n inclinatio
H Horizontal force due to unintended inclination I Moment of inertia
Ip Polar moment of inertia
It Moment of inertia in transversal part of pierced shear walls Iv Moment of inertia in vertical part of pierced shear walls K Factor used for determining deflections in pierced shear walls
4 , 3 , 2 ,
K1 Factors for determining warping conditions Kv Torsional stiffness cross section factor Kw Warping stiffness cross section factor L Height of a member
Lb Length of beam Lc Buckling length
Lh Total height of building or structure Lsec Storey/section height
M Moment
M0 Initial bending moment (1st order)
Md Total bending moment (2nd order included) Mer Restraint moment
Mtot Total moment (local moment included)
S twist
M , St. Venant moment contribution
V twist
M , Vlasov moment contribution
x twist
M , Total torsional moment
N Axial force
B
Ncr, Critical buckling load, considering bending
CHALMERS, Civil and Environmental Engineering, Master’s Thesis 2005:12 IX
col
Ncr, Critical buckling load considering a single column
elrest
Ncr, Critical buckling load considering elastic restraint
S
Ncr, Critical buckling load considering shear
sys
Ncr, Critical buckling load for a system in one plane without shear
tot
Ncr, Critical buckling load, considering both bending and shear RC Centre of rotation
V Shear force
Roman lower case letters
a Length of floor slab
b Breadth of floor slab, distance between the centres of each vertical part in a pierced shear wall
b0 Total breadth of pierced shear wall
c Deformable length of the transversal part of a pierced shear wall c0 Width of gap in pierced shear walls
e Eccentricity
ht Height of transversal in pierced shear walls j Stiffness number
k Factor concerning bending
kE Euler parameter concerning bending kV Vianello parameter concerning bending m Torque per unit height
n Number of storeys
qh Distributed horizontal load qv Distributed vertical load
qref Reference wind velocity pressure
−1
r Curvature of deflection
1 0−
r Initial curvature
−1
r∆ 2nd order curvature
t Thickness, time
w Displacement
x Distance from the structure’s rotational centre to the individual unit’s rotational centre in the x-direction
xRT x-coordinate that describes the position of the rotational centre of the structure
unit
xRT, Coordinate that describes the position of the rotational centre of a stabilising unit in relation to the defined origin, in the x-direction
xT Displacement of the structures rotational centre to the centre of gravity in the x-direction
CHALMERS, Civil and Environmental Engineering, Master’s Thesis 2005:12
X
y Deflection, distance from the structure’s rotational centre to the individual unit’s rotational centre in the y-direction
y0 1st order deflection, total deflection used in Vianello’s method
yRT y-coordinate that describes the position of the rotational centre of the structure
unit
yRT, Coordinate that describes the position of the rotational centre of a stabilising unit in relation to the defined origin, in the y-direction
ytot Total deflection (2nd order effects included)
yT Displacement of the structures rotational centre to the centre of gravity in the y-direction
'
y Angle of deflection (slope) ''
y Curvature of deflection vref Reference wind velocity
0 ,
vref Initial reference wind velocity
vtot Total deflection (2nd order effects included) Greek upper case letters
∆M Secondary moment (2nd order)
∆y 2nd order deflections N)cr
(Σ Total critical buckling load
B
N)cr,
(Σ Total critical load, considering bending
elrest
N)cr,
(Σ Total critical load, considering elastic restraint
S
N)cr,
(Σ Total critical load, considering shear
Greek lower case letters
α General symbol for angles, variable used in calculating deflections in pierced shear walls
αm Inclination factor
αS Angle of deflection due to shear
β Shape factor for magnification factor (A/B) βc Factor describing development of creep βs Factor describing development of strain γer Angle describing elastic restraint
bend
γt, Component of shear angle concerning bending in the transverse part of a pierced shear wall
shear
γt, Component of shear angle concerning shear in the transverse part of a pierced shear wall
bend
γv, Component of shear angle concerning bending in the vertical part of a pierced shear wall
CHALMERS, Civil and Environmental Engineering, Master’s Thesis 2005:12 XI
shear
γv, Component of shear angle concerning shear in the vertical part of a pierced shear wall
γtot Total shear angle for pierced shear walls
ε Strain
εcs Shrinkage strain
0 ,
εce Notational shrinkage coefficient ξ Shear reduction factor
σ Stress
σW Warping stress
τb Shear in partially connecting beam of a stabilising core
µ Variable used in calculating deflections, shear friction coefficient ϕ Change of angle, angle
ϕ0 Notional creep coefficient ϕef Creep factor
θ Twisting angle per unit height χ Rotation of the beam's cross section ψ Angle of rotation
ω Sectorial coordinate
Other indexes, such as left, right and centre, exist in this thesis in order to identify the situation of a specific parameter. Directions are represented by the subtexts x, y and z.
CHALMERS, Civil and Environmental Engineering, Master’s Thesis 2005:12 1
1 Introduction
1.1 Background
The increased demand for taller structures requires that a structural engineer is familiar with the buckling phenomena that can occur in such a building and so complete competent calculations. The engineer must have an understanding of workable calculation methods for designing this type of structure and must also be confident in using them.
Reinertsen Sverige AB were interested in instigating a Masters Thesis on this subject and The Division of Structural Engineering at The Department of Civil and Environmental Engineering at Chalmers University of Technology, Gothenburg, Sweden obliged. This thesis would provide the company with a deeper understanding of the phenomena that are involved in stability calculations and hopefully a workable method for future calculations.
1.2 Aim and scope
The aim of this thesis is to provide a concise and usable method for analysing stability of tall structures. The respective calculation methods published by Westerberg (1999) and Lorentsen et al. (2000) are standard works in Sweden which have been chosen for investigation. A basic understanding of the parameters involved in the calculations shall be provided. These existing calculation methods will be presented and analysed in order to identify discrepancies that may exist in the methods. Analytical calculations of components, individual and in combinations shall be demonstrated and FE-analysis will be performed to compare the results and in order to ascertain how much the results concur. This thesis is produced in a pedagogical format in order for it to be used educationally.
1.3 Scientific approach
A substantial literary study has been completed while obtaining relevant information on calculation methods for designing for stability in tall buildings. Numerical examples; of calculating buckling loads for single and multi storey structures; of deflections and buckling in solid shear walls; of deflections, buckling and stress distributions of pierced shear walls; of force distributions in single storey structures;
of coupled and uncoupled approach to calculating U-shaped core elements; of force distribution in a multi storey structure, are presented and compared with FE-results in order to draw conclusions on the reliability of the calculation methods.
CHALMERS, Civil and Environmental Engineering, Master’s Thesis 2005:12
2
1.4 Methods presented
Westerberg (1999) and Lorentsen (2000) approaches for considering the contribution from 2nd order effects for calculating stability on single and multi storey structures are examined.
The Vianello method for calculating critical buckling loads due to bending is introduced and compared with the approximate method and FE-analyses.
Regarding pierced shear walls, two methods are presented. One method is utilised for establishing the buckling load for the wall and a second method is used for deriving the top deflection of the wall subjected to a horizontal distributed load. Both methods are taken from Lorentsen et al. (2000)
Two methods concerning the calculation of a complete structure are investigated. One approach regards only the calculation of the critical buckling load for the whole structure. The second method is used for one storey structures and is more accurate as the load distribution is taken into account in a more exact manner.
A method for including torsional resistance in the stability calculations is devised by the authors of this thesis.
1.5 Limitations
Stability analysis of tall buildings is a huge subject which requires years of active study in order to attain a relatively complete understanding. In order to contain the thesis to a workable size it has been decided to limit the study to linear analysis. All of the concrete elements in this thesis are assumed to be uncracked and the effects of temperature, creep and shrinkage are not taken into account. Non-linear analysis may be investigated by a follow up group of graduate engineers. Dynamics is an advanced field of theory which shall not be dealt with here. This work shall concentrate on static problems. Stabilising systems consisting of frameworks, façades and tubes, are mentioned and their functionality is ascertained while calculations, on these types of stabilising elements, are not pursued. Methods concerning treatments of connections are not included in this thesis but the problems are brought up.
In this thesis the limitations has been drawn to study problems or inaccuracy concerning stabilising structures consisting of shear walls, towers and columns.
Problems concerning detailing, such as joints and connecting details, for transferring loads between different parts through a building are not studied in detail. Some of these problems are discussed as they are important to consider especially in cases where twisting occurs.
CHALMERS, Civil and Environmental Engineering, Master’s Thesis 2005:12 3
2 Tall buildings
To define a tall building it is best to decide from whose perspective one is looking. A bureaucrat may decide that anything over 5 storeys is a tall building and from this decision he may categorise accordingly and be very satisfied. For a structural engineer it is not so simple. A tall building is, from a structural engineer’s perspective, to be considered tall when, due to its height, the lateral forces suffered by the structure play a significant role in the design. [Smith and Coull (1991)]
2.1 Evolution of tall buildings through the ages
The great metropolises of the world share common dilemmas. Increased population densities due to the migration of people from the countryside to the cities, combined with the rising price of developable land and the environmental politics of the day provide the city councillors with no better solution than to build higher. Human nature also compels us to achieve that which has previously not been accomplished and all through history, from The Tower of Babel to The Empire State Building, has man endeavoured to reach the sky.
From an historical point of view it has been defence, power and religion that have driven humanity to build high. Defensive fortifications had to be high and robust in order to be effective. Figure 2.1 shows an Irish Round Tower, built by Christian Monks around 1000 AD, which stretched 30 meters into the sky and was used as a refuge for when the Vikings would come plundering. The material used is granite stones joined by mortar. Great respect is due the monks who built this tower because they built a stabile structure using little structural engineering knowledge and only using materials that were ready at hand. The choice of design is worth noting because these monks opted for a structure which is both aerodynamic and resistant to torsion, because of its uniform form. [Ireland Mid-West (2004)]
Figure 2.1: Kilmacduagh Round Tower Ireland, 30 metres high (circa 1000 AD).
[Interactive Interpretative Centre of the Burren (2004)]
CHALMERS, Civil and Environmental Engineering, Master’s Thesis 2005:12
4
Building tall to display power can be exemplified by the biblical story of the Tower of Babel, Figure 2.2, and how the descendents of Noe built a tower in the land of Sennar (modern day Iraq) in order to reach the skies and so show God how mighty they had become. Of course God was not happy about this and demolished the Tower and scattered the descendents of Noe across the globe. This was in prehistoric times, about
5,500 BC, so no real records survive. King Nebachadnezzer II of Babylon (605 – 562 BC) is reputed to have built a tower on the foundations of the original. His
tower is historically verifiable and he managed to build a tower 90 metres high using only baked bricks made of mud and straw, joined by a mortar made of bitumen, which is a mixture of tar like hydrocarbons which are derived from petroleum.
[Global Security (2004)]. Great rulers had to build great monuments to show how powerful they were. The victories of Nelson and Napoleon inspired the inauguration of tall monuments to show the world how great these men, and how powerful the nations they defended, were. Even today there is a certain respect given to the countries that can build the highest in that their ability to build high represents their might.
Figure 2.2: Bruegel’s depiction of The Tower of Babel. [Museum of unnatural mystery (2004)]
Religion has always inspired people to build tall structures. The pyramids of Egypt and Mexico are fine examples of this. The building of cathedrals in Europe, pagodas in Japan, mosques in The Middle East and temples in India have brought forth the ingenuity of the builders and have shone as beacons to their respective worshipers.
Looking at a wonderfully huge, graceful and artfully carved structure the believers were filled with awe for the power of the respective God/Gods who inspired the edifice. In Europe the construction of cathedrals led to the establishment of a quasi- religious status for the masons who were designing these amazing structures. Cologne Cathedral was begun in 1248, Figure 2.3, and the masons used their knowledge to build a structure that must have installed awe in all who looked upon her. They were
CHALMERS, Civil and Environmental Engineering, Master’s Thesis 2005:12 5 very secretive of there calculation methods, there chemical compositions of mortar and there methods of construction. The finances to build high came from the church but the knowledge came from the masons/engineers.
Figure 2.3: Cologne Cathedral, 156 metres high. [Service t-online (2004)]
Considering the buildings constructed for the common people it is best to start with the Romans. Before Nero’s fire of 64 AD, Rome had a multitude of four storey tenements built of wood. After the fire, the four storey wooden tenements were replaced by tenements built with new brick and concrete materials which were used to form arches and curved dome structures. Over the centuries there were no great leaps in material science so timber and masonry were the norm. The timber structures were not strong enough to build over five storeys and they were very susceptible to fire.
The masonry possessed high compressive strength and it was fire resistant but its lower supports could not take the weight of very high buildings. Most cities in Europe have experienced catastrophic fires because their buildings were mostly made of wood. The great fire of London in 1666 led to a possibility to rebuild the city in brick.
A similar fire occurred in Chicago in 1871 which also made way for construction in brick. The best that could be done, height wise, with masonry was achieved in 1891, in Chicago, when the 16 storey Monadok Building was erected by the engineers Burnham and Root. To build this structure the bottom floor had to have 2 m thick walls which quite depleted the usefulness of that floor. [Smith and Coull (1991)]
CHALMERS, Civil and Environmental Engineering, Master’s Thesis 2005:12
6
To build higher than this it was necessary for new materials to be produced and their properties examined. The industrial revolution provided the materials wrought iron and steel and also provided the social impetus for building higher as more workers from the countryside were required to work in the factories, so houses had to be provided for them. The necessity of having workers near at hand to the factories and that land was in short supply led to the solution of building higher. The term high-rise began to be used to describe tall buildings and with the development in steel production more and more, ever higher, buildings were being built. The first steel frame structure, Rand-McNally Building in Chicago Figure 2.4, was built in 1889 by Burnham and Root and was 10 storeys high. (Smith, Coull 1991)
Figure 2.4: Rand-McNally Building Chicago, 10 storeys, 1889. [American Institute of steel construction (2004)]
A mile stone was reached in 1891 when diagonal bracings, used to form vertical trusses, were used in the 22 storey Masonic Temple, Chicago Figure 2.5. This is the forefather of today’s shear wall and braced frame constructions. The engineers, Burnham and Root, decided on introducing the above mentioned diagonal bracings above the 10th floor. They chose steel for the rigid frames and wrought iron as the material for the bracings. This building remained the tallest in Chicago until the 1920’s because the city council enacted height restrictions after its inauguration.
[Smith and Coull (1991)]
One further important factor in building higher was the invention of the elevator. One could not expect people to spend time and energy climbing stairs and the rents for the top floors were actually lower than rents for the lower floors, so the elevator had to be incorporated into designs. The first elevator was installed in The Equitable Life Insurance Building in New York in 1870, designed by Gilman, Kendell and Post, led to the landlords being able to charge equal rents for the lower and upper floors as they were now equally accessible. The invention of the electric elevator in 1890 made it possible for landlords to build even higher buildings without having to worry about if
they could effectively rent out the floor space on the higher floors.
[Smith and Coull (1991)]
CHALMERS, Civil and Environmental Engineering, Master’s Thesis 2005:12 7 Figure 2.5: Masonic Temple, Chicago, 22 storeys, 1891. [The skyscraper museum
(2004)]
Design methods became more sophisticated and construction techniques were refined until in 1913 The Woolworth Building in New York, Figure 2.6, designed by Cass Gilbert (architect) and Gunvald Aus (structural engineer), reached a height of 58 storeys. This building remained the tallest building in the world until 1930. The structure was built to withstand winds of up to 360 km/h, it contained thirty elevators and it was the first building to have its own steam turbines installed. When building such a huge structure it is very important to envisage the foundation required for a soil consisting of alluvial mud and sand for depth of 30 m. Gunvald Aus chose pneumatic caissons (French for big box), which use air pressure to expel water, for founding the 66 concrete piers that would connect the structure to the ground. A caisson is a large hollow box, made of steel, which is driven into the ground, excavated and then filled with concrete. The basements themselves began at 16.5 m below ground level. In order to withstand the 360 km/h winds that the building was designed for Gunvald decided to have different stabilising systems in different parts of the building. The lower stories employed a portal system of braces, that is a combination of struts and ties which lie in the plane of the inclined braces, were used to transfer wind pressure from the upper parts of the trusses to an abutment. The tower construction was more complicated and girder and knee brace stiffening was chosen. Two design solutions, for the tower, that could have been better thought out were that the wall columns did not get direct column support from below and were therefore carried by girders and that where the columns were counterbalanced, the transfer of wind shear in the outer faces of the tower must have be made through the floor. [Smith and Coull (1991)]
[The skyscraper museum (2004)]
CHALMERS, Civil and Environmental Engineering, Master’s Thesis 2005:12
8
Figure 2.6: The Woolworth Building, New York, 1913.[ Kent State University (2004)]
The end of the skyscraper era was heralded by the building of The Empire State Building in New York (1931). A steel riveted frame was used and the building reached a height of 102 storeys which wasn’t surpassed until the raising of the first tower of the World Trade Centre in 1973. As The Empire State Building was the largest project undertaken up to that time, three structural engineering companies were employed. The structure was so well designed that, in 1945, it withstood the impact of a B-25 bomber on the 79th floor. Fourteen people were killed when one of the engines passed through the entire building but the structure held, only sustaining damage to the outer wall. [Emporis (2004)]
Height in storeys
0 20 40 60 80 100 120
185 0
1860 1870
1880 1890
190 0
1910 192
0 1930 Year
Storeys
Figure 2.7: Time line of structure height in storeys.
CHALMERS, Civil and Environmental Engineering, Master’s Thesis 2005:12 9 Figure 2.7 shows how building height increased from 1850 to 1930 in the USA. After 1931 and the construction of The Empire State Building, the United States fell into a depression and the consecutive commencement of World War II meant that further increase in building height was halted until 1973, when the first tower of The World Trade Centre was erected. [Smith and Coull (1991)]
The World Trade Centre, 110 storeys, used an innovative structural model designed by John Skilling and Les Robertson who chose a system that was simplistic but effective. This building was the first to use no brick or stonework. They used the steel façade as a wind bracer to provide the stability while the central core took all the self weight. The wind bracing façade, made of closely spaced steel columns, was attached to the central core by steel floor trusses. The central core itself contained the elevator shafts which were specially designed. The engineers were worried about the air pressure which could lead to buckling of the shafts, so the elevator designers created a system of elevators that was divided between a local and an express system. A traditional system would have meant that half the area of the lower stories would have been taken up by elevator shafts so stop off points for the elevators were installed on the 44th and the 78th floor. After the aeroplane collisions of the 11th of September 2001 it is widely assumed that the steel trusses connecting the façade to the central core over heated and lost their rigidity leading to a progressive collapse of the structure. It is although notable that the structures did withstand the impact of the passenger planes. [Department of Civil Engineering, University of Sydney (2004)]
After the cessation of combat in World War I reinforced concrete was used to imitate steel forms. The full potential of reinforced concrete had not been fully realised although The Exchange Building in Seattle, 1930, did reach 23 storeys. It was not until after World War II that radically new structural and architectural solutions were propagated through the realisation that reinforced concrete can be easily formed in
order to satisfy architectural specifications and structural integrity.
[Smith and Coull (1991)]
In the past, city councils have commissioned land on the outskirts of their cities for development but the advances in environmental science over the last decades have recognised the vital importance, for the atmosphere, of maintaining land in its natural state, plus the importance of arable farming for providing fresh provisions for the cities. The availability of fresh produce may not be so problematic in the western world, because of the advanced infrastructure, but the developing nations see this as a major quandary. The tides of human migration are as unstoppable as population growth but the cities of developing lands have to decide whether to commandeer more arable land or to build higher. Here, in the West, are many large urban areas that are slowly eating up the natural land which exists around them. Large conurbations such as the Ruhrgebeit in Germany and the Lille area of Northern France are facing health problems due to their difficulties in holding down pollution levels. One can especially look to South-East Asia where cities such as Hong Kong, Shanghai and Singapore have chosen to build higher, in order to accommodate their citizens, instead of succumbing to urban sprawl. Table 2.1 gives the heights achieved depending on the usage of the building in order to show that tall structures are not only office buildings.
[Emporis (2004)]
CHALMERS, Civil and Environmental Engineering, Master’s Thesis 2005:12
10
Table 2.1: The current highest buildings according to usage, and some Swedish buildings.
Usage Name City Height
(m) Floors Year Offices Taipei 101 Taipei 509 101 2004 Lodging Ryugyoug Hotel* Pyongyang 330 105 1992 Residential 21st Century
Tower Dubei 269 55 2003 Education Moscow
University Moscow 240 36 1953 Hospital Guy's Tower London 143 34 1974 Offices Kista Tower Stockholm 128 32 2001 Residential Turning Torso Malmö 190 54 2004 Lodging Gothia Tower W. Gothenburg 70 23 2001
* Structurally complete but not yet in use.
It is evident, due to the existence of tall buildings, like Kista Tower, that the skills and knowledge to build higher do exist in Sweden. Gothenburg is not as crowded as the cities of South-East Asia but it is hoped that the City Fathers are beginning to see the advantages of constructing taller buildings. To build further on the outskirts of Gothenburg means that more farm land and more forest will be lost. Gothenburg is still experiencing an increase in population due to economic migration of workers and so shall further accommodation, to work, to play and to live, be required. Obviously people who work in the city may also want to live near to their place of work in the city. This involves the economic aspect of supply and demand, where if there are enough customers who are willing to pay then industry will find a way to provide for them.
2.2 Loads
This chapter will discuss how loads are applied, the estimations and assumptions that have to be studied and the implications of 2nd order effects. The use of codes will be explained and the assumptions used for implementing service limit state, SLS, and ultimate limit state, ULS, will be clarified.
CHALMERS, Civil and Environmental Engineering, Master’s Thesis 2005:12 11 2.2.1 Load distribution
With tall buildings it is important to understand how and which loads are applied where on the building. The loads can be divided very simply between vertical and horizontal burdens. The vertical loads are the weight of the building, imposed load and snow load. The horizontal loads are wind and the unintended inclinations.
The vertical loads are taken up by the bearing walls, columns or towers and are led to the foundations. The loads occurring from the wind are first taken by the façades and are then further distributed to the slabs.
Figure 2.8: Multi-storey structure with applied wind load.
The floor slabs act as diaphragms and are often considered to be stiff in their plane and deformations in its plane is usually disregarded. The slabs are connected to the stabilising units, such as shear walls, towers or stabilising columns. Figure 2.8 shows a multi storey building with the wind loads applied as they are interpreted to be.
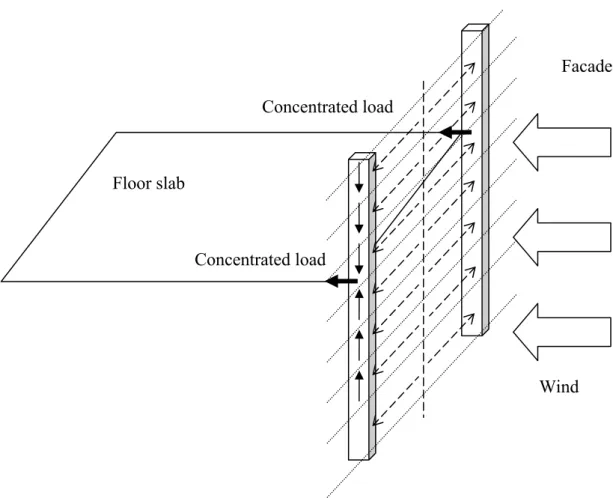
Some facades also have columns attached directly to them and in these cases the loads are first transferred to the columns resulting in concentrated loads on the floor slabs.
See Figure 2.9.
CHALMERS, Civil and Environmental Engineering, Master’s Thesis 2005:12
12
Figure 2.9: Wind load on facade causing concentrated loads in a floor slab.
If the façade which takes the wind load is supported by the floor slabs, then the floor slabs will be subjected to a distributed load, see Figure 2.10. Compared to Figure 2.9 the different load application causes a different stress distribution in the slab. The stress distributions have to be dealt with through careful planning of how the slabs and the facade are connected. Floor slabs are often considered to be stiff, and the horizontal load distribution through the building is due to the stiffness of the different stabilising components. If the floor slab is not stiff enough, or slip occurs in joints between slab elements in the same plane, then the displacement of the floor slab will not be the same along the loaded side of the floor slab, as in Figure 2.9. Stress distribution in floors depends on both loads and supports.
.
Facade
Floor slab
Wind Concentrated load
Concentrated load
CHALMERS, Civil and Environmental Engineering, Master’s Thesis 2005:12 13 Figure 2.10: Façade attached directly on the floor slab.
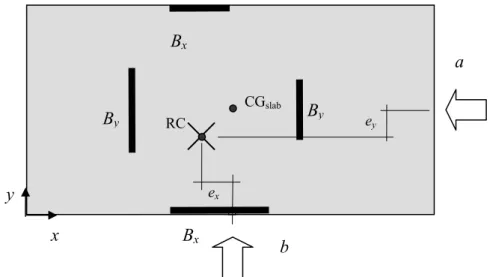
How the floor slab will react to a distributed load is shown in Figures 2.11 and 2.12. If the slab is assumed to be stiff then the load is distributed according to the stiffnesses of the stabilising units i.e. stiffer units will attract a greater part of the applied force than weaker units. Figure 2.11 describes a load case which assumes a uniform lateral movement seen from the top of the structure. The dotted line represents the original position of the slabs and the shear walls. This load situation can be compared to a stiff beam standing on spring supports and if the supports have equal stiffness then the load will be evenly divided among them, see Figure 2.11.
Figure 2.12 shows a load case where the slab is not assumed to be completely rigid and bending occurs due to the distributed load. Now a system is presented where the load distribution along the three supports is not only dependent on the stiffness of the supports. With normal beam theory it is assumed that the supports are endlessly stiff and the load is distributed among the supports according to elastic theory. In a case with 3 supports the middle support will attract 10/8 qL of the load and the outer supports will attract 3/8 qL. L refers to the span between the supports. Figure 2.12 shows a situation where the load distribution is hard to establish or predict. Here there is a combination of load distribution depending on both the stiffness of the supporting walls and the bending in the slab due to elastic theory.
Wind Floor slab
CHALMERS, Civil and Environmental Engineering, Master’s Thesis 2005:12
14
Figure 2.11: Load case which assumes a uniform lateral movement of the slab.
Figure 2.12: Load case where the slab is not assumed to be completely rigid and bending occurs due to the distributed load.
ji ji ji
ji ji ji
CHALMERS, Civil and Environmental Engineering, Master’s Thesis 2005:12 15 If the floor slabs are assumed to be stiff and the case shown in Figure 2.11 presents a model resembling the real structure, it is of vital importance to ascertain that bending does not occur in the slabs themselves. In Figure 2.12 it is shown that the middle wall is subjected to greater deflections than the outer walls, subtracting greater forces than it is dimensioned for.
The floor is supported by the stabilising units through a shear force distributed along the width of the wall. The walls are subjected to both bending and shear deformations but in low robust walls the bending contribution is negligible. See Figure 2.13. If slender units are used for stabilising then bending mainly occurs and shear deformation is negligible.
Figure 2.13: Bending and shear deformations.
When the entire structure is considered, even though shear walls are considered as low and robust in each floor, the shear wall becomes more slender in taller structures.
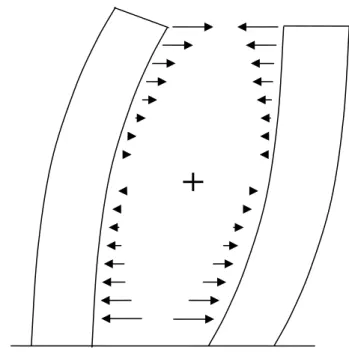
It is therefore necessary to consider both bending and shear when calculating on tall buildings. Figure 2.14 presents shear and bending deformation of a tall shear wall subjected to a distributed load along the height. The deformation from bending is curved in the opposite direction to the shear deformation. The deformation from shear is due to the shear forces applied through the floor slabs in each storey. As the loads accumulate and increase through the building the largest singular deformation occurs at the first floor for the shear contribution. Figure 2.15 shows a FE-analysis representation of a pierced shear wall subjected to both bending and shear.
Shear deformation Bending deformation
CHALMERS, Civil and Environmental Engineering, Master’s Thesis 2005:12
16
Figure 2.14: Shear and bending deformation of a tall shear wall subjected to a distributed load along the height.
Figure 2.15: FE-analysis representation of a pierced shear wall subjected to both bending and shear.
Bending deformation Shear deformation
CHALMERS, Civil and Environmental Engineering, Master’s Thesis 2005:12 17 2.2.2 Estimates concerning loads, environment and material
Considering how accurately the stability of a tall building can be calculated, concerning functionality during the entire projected service life of the structure, one must make certain assumptions concerning the external and the internal environment, degradation of the material and accidental impacts or loadings, and natural disasters.
External climate conditions will affect the stability of a structure through wind, humidity, rain and temperature variation. The treatment of wind loads, specifically in tall buildings, is very well documented in Eurocode (1991). [Zalka (1992)]
First a reference wind velocity is ascertained:
0 , ref ALT TEM DIR
ref C C C v
v = ⋅ ⋅ ⋅ (2.1)
The value vref,0 is defined as the 10 minute mean wind velocity at 10 metres above the ground of terrain category II (urban terrain) having a mean return period of 50 years.
Different terrains have different factors depending on if the structure will be on a shore line, urban, countryside or suburban. The value itself is derived from the extensive records that are kept on wind conditions in each country. From this value it can be plainly seen that stronger winds may occur and especially for tall buildings where wind loading is vital, this value will have to be altered. Coefficients of direction, CDIR, season, CTEM, and altitude, CALT, will be taken in to account to derive a reference wind velocity. This value will be used to attain the reference wind velocity pressure.
2
2 ref
ref v
q = ρ ⋅
; ρ= air density (2.2)
This value will be further altered through coefficients for exposure, topography, roughness, gust wind response, aerodynamics, external pressure and also specifically for tall buildings the structure will be divided into different heights where different roughness and exposure factors will be applied. While determining the load cases, consideration must also be given to suction that will occur on walls and roofs due to the wind. All of these factors are based on intense investigation but are still models of reality and extreme buildings have to take into account even more extreme conditions which lead to the design engineers of extremely tall buildings having to sometimes develop their own extreme factors. [Eurocode (1991)]
The effects of rain, humidity and temperature variation on a structure which has stability components on the outer shell may be hazardous over a long period of time.
The engineer has to establish a relevant period of time before reparations to the structural components have to be made. Here again the engineer has to rely on weather statistics developed over the last century and then further take into account the extreme conditions that may occur. Again the engineer has to work with a model of reality.
The internal environment of a building is controlled by the heating and ventilation systems. The stability components of the structure should be isolated against internal
CHALMERS, Civil and Environmental Engineering, Master’s Thesis 2005:12
18
influences and there should not really be a problem concerning the internal environment. What the engineer has to be careful with here is the materials that are used for protecting the stability components. Whether it is paint, wood or concrete the engineer has to be aware of their material values concerning for example permeability which could, under extreme conditions, allow damaging moisture to reach the material of the stabilising components. Service life analysis of these materials would be necessary in order to determine maintenance episodes and so protect the stability system. Assumptions are again made while determining for example humidity or water spillage.
2.2.3 Loading assumptions
The loads on a building are modelled through investigating the buildings usage, situation and dimensions. Concerning dimensions there are no assumption made as all dimensions are real. On the other hand the usage of the building and the situation of the building require a closer look. The engineer has access to codes which describe specifically how load combinations are calculated using factors, considering situation and usage, in order to ascertain loading values for Service Limit State, SLS and Ultimate Limit State, ULS. Considering usage it is important for the engineer to pay considerable attention to the imposed loads. For this the engineer has access to codes which give values per m2 of floor space for different activities and also factors to be used when establishing load cases. All of these factors and values are based on assumptions which are designed to always keep the engineers calculations on the safe side. [Eurocode (1991)]
Considering the calculations of load cases concerning SLS and ULS one must first look at the engineering community and how it works. As mentioned previously, a structural engineer’s primary concern is safety. The engineering community today tends to produce specialised engineers who are not experts in all the fields of study required to build a safe building, but rather produces engineers who are specialised in for example materials, climate control, structural integrity and geotechnics. This requires that the engineering team are able to understand the assumptions made by each other. Ideally the engineers will use the most appropriate design and construction techniques, the best available materials and the most up to date environmental data.
On top of this, safety factors will be applied in order to insure that the calculations will be pessimistic and so shall the building be considered safe. [Zalka (1992)]
Consider a building where the designer knew exactly the material properties of the components, knew exactly how they would behave under the projected life time of the building, knew exactly how the building would be serviced and also had access to exact data concerning internal/external environment and the projected loading histories of the building. This building would require no safety factors. Because of these discrepancies the structural engineer is required to incorporate partial factors into his/her design calculations at an early stage. These factors are multiplied to the basic variables in order to give pessimistic values concerning the variables performance. [Zalka (1992)]
It is analytical theory based on elastic and non-elastic behaviour that has led to the development of load conditions i.e. SLS and ULS. In the beginning of the design
CHALMERS, Civil and Environmental Engineering, Master’s Thesis 2005:12 19 process the structural engineer will directly reduce the material property values of the components by using partial factors which are applied to either ULS or SLS. It seems logical to assume that a structure designed for SLS should by definition be safe;
meaning that it will not collapse, because in order for the building to be serviceable it must be safe, but this is not the case because it is ULS that considers collapse. Should the engineer then wholly disregard SLS and only calculate in ULS?
ULS considers ultimate loading in different load combinations. It is not possible to evaluate a specific safety factor which describes the safety margin that exists between SLS and ULS. The way the theory of SLS and ULS works is that the loading factors applied in ULS describe initially an assumed structural behaviour of the building, not if it will actually fail or not. Reality is not the same as the model. [Zalka (1992)]
Loads have to be assigned load-paths. These are determined through establishing how the loads are applied, how the loads will transfer through the stabilising system and finally how these loads will be taken up by the foundations. A relationship exists where the number of potential load-paths and the number of stabilising elements is related to the number of potential load-carrying mechanisms within the elements and the joints between them. A particular loading case will only initiate a certain number of the load paths available. Interdependence must exist between each path in order for a structure to retain stability while each successive mechanism comes into effect. To increase the possibility of sustaining a system of load-paths it is advised to insure that the load-paths are intertwined meaning that the more integrated the stabilising system is the better the system will absorb loads. [Zalka (1992)]
A further affect on loading is obtained through the unintentional inclination of supporting elements. Inclinations, of columns, that may exist in the building are assumed through using the factor αm in the equation below which determines the horizontal load due to inclination, Hinclination.
This value is derived through the equation below where n is the number of columns above the storey being examined.
m n
012 . 0003 0 .
0 +
α = (2.3)
m n
inclinatio N
H =Σ ⋅α (2.4)
It is often regular for the engineer to assume that the stabilising components of a structure are fully fixed. This assumption implies that the stabilising component in question and the ground it is anchored in react in union. This assumption assumes that the ground itself is solid and does not have elastic properties. This assumption is fine for structures anchored in the bedrock but those anchored in soil present more difficulties. Anchorage in soil leads to it being necessary to calculate with elastic restraint included. This requires that the soil properties of the ground in question have to be examined and it is well known that it is difficult to determine soil properties exactly. It is therefore important for the engineer to remember that the restraint values determined by the geological investigation are in error to a degree of 30%.
[Lorentsen et al. (2000)]
CHALMERS, Civil and Environmental Engineering, Master’s Thesis 2005:12
20
2.2.4 1st and 2nd order theory
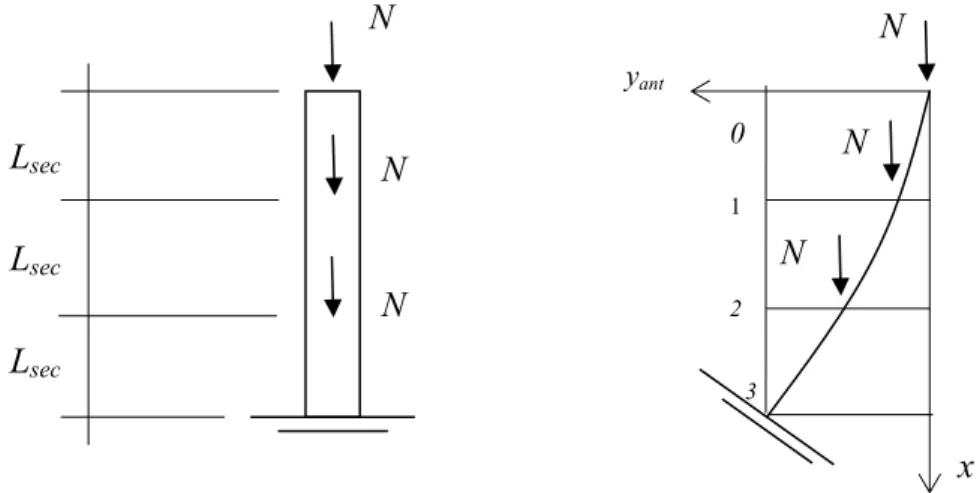
In order to understand stability one has to first understand the theory that is utilised while calculating. When calculating with columns, shear walls and towers one has to take into account both 1st and 2nd order theory. 1st order theory explains the direct results of actions, moments and deflections. 2nd order theory takes into account the additional moments that occur because of the 1st order deflections combined with axial loads. [Westerberg (1999)]
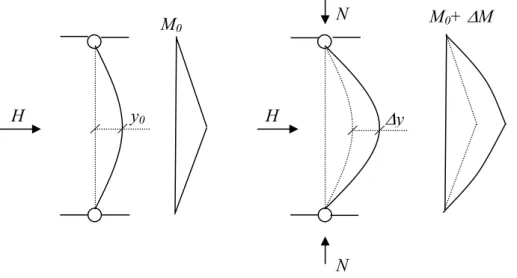
A transverse load is applied at the centre of the column, Figure 2.16. From this load, a deflection y0 and a moment M0 occur. With the application of an axial load is gained a further deflection ∆y and a compliment moment ∆M. M0 and y0 are 1st order effects and ∆M and ∆y are 2nd order effects. See chapter 3.1.5 on the derivation of the magnification factor. The 2nd order effects are due to axial loads combined with the 1st order deflection
Figure 2.16: 1st and 2nd order deflections and moments. Based on Westerberg (1999).
2.3 Buckling and torsional phenomena
2.3.1 Bending and shear
Buckling is a phenomenon which occurs when a structure is subjected to axial load suffers uncontrolled large displacement, transverse to the load. Transversal buckling, i.e. in plane, has two contributions, bending and shear. The bending deformation causes a curved shape. The shear deformation results in straight inclined shape.
Combined they result in the critical buckling mode displayed in Figure 2.17.
H y0
M0
H
N
∆y
N
M0+ ∆M
CHALMERS, Civil and Environmental Engineering, Master’s Thesis 2005:12 21 Figure 2.17: Combined bending and shear.
2.3.2 Torsion
The occurrence of torsional buckling in tall buildings is a well studied phenomenon
which is generally not adequately applied by structural engineers.
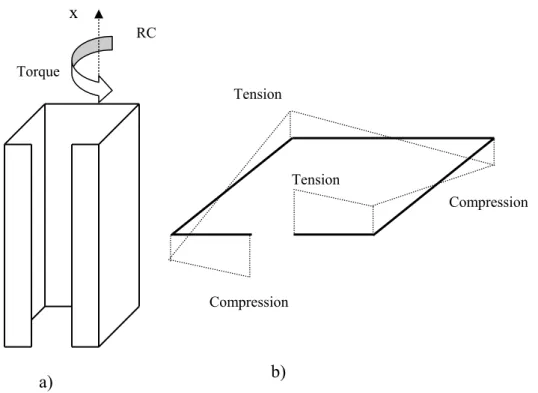
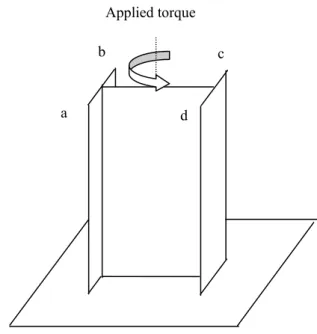
[Smith and Coull (1991)] Torsion involves a twisting action, due to applied vertical or horizontal loads. When a vertical load is applied buckling through translation may be replaced by a first buckling mode due to twisting. Observe in Figure 2.18a how the torque about the rotation centre occurs. Here is shown a stabilising component which does not have a coinciding centre of gravity and rotational centre. The applied vertical load results in a torsional action about the centre of rotation, behind the tower where the rotation centre is situated. Figure 2.18b shows how a cross section of the stabilising component is influenced by tension and compression occurring because of the stresses due to the torsion. Displacement due to twisting will occur. The bottom end of the element is assumed to be fixed to the ground.
L Ncr,tot
CHALMERS, Civil and Environmental Engineering, Master’s Thesis 2005:12
22
Figure 2.18: Core showing how applied torque on the rotational centre causes tensions and compressions in the cross section.
Eccentric horizontal loading of a stabilising element leads to torsion and sectional torsional moments along the length of the element. In order to calculate the torsional moment at a specific point in the stabilising component it is necessary to consider two contributing factors. The equation below shows the relationship.
, ''
,S twistV Vθ Wθ
twist
twist M M GK EK
M = + = − (2.5)
twist
M = Torsional moment around the x axis
S twist
M , = St. Venant component of torsional moment
V twist
M , = Vlasov component of torsional moment G= Shear modulus
Kv= Twisting stiffness cross-sectional factor Kw=Warping stiffness cross-sectional factor θ = Twist per unit height
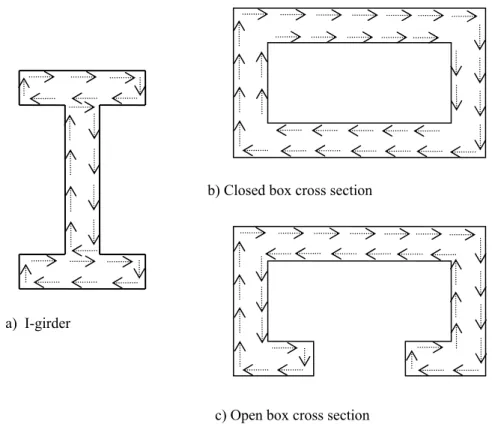
Figure 2.19 below shows how the patterns of shear flow due to torsion occur in different stabilising element forms. Observe how the closed cross-section b) has an overall closed shear flow while example c) shows a dramatic change in the shear flow
RC Torque
Compression Tension
Compression Tension
a) b)
x
CHALMERS, Civil and Environmental Engineering, Master’s Thesis 2005:12 23 due to the cross section being open. Example a) shows how the shear flow in an I-girder is mapped.
Figure 2.19: Shear flow due to torsion in three cross sections.
St. Venant torsion is observed when the torsional cross-sectional moments are entirely taken up by the shear stresses. If axial stresses occur then they participate in taking up the torsional moment through warping resistance. This effect is called Vlasov torsional resistance. Observe Equation (2.5) and how the St. Venant and the Vlasov components combined make up the total torsional moment. How this equation is developed is explained in Samuelsson and Wiberg (1993).
a) I-girder
b) Closed box cross section
c) Open box cross section
CHALMERS, Civil and Environmental Engineering, Master’s Thesis 2005:12
24
Figure 2.20: Torsional moment distortions [Gambhir ( 2004)]
Figure 2.20 shows three girders subjected to different torsional moments. The first girder, marked a) is simply supported and torque is applied from both ends. Observe that rotation about the x-axis is allowed which means that the girder is not restrained and therefore has no warping displacement which leads to the conclusion that no warping stresses exist. Uniform torsion is observed, which induces only St. Venant stresses. This means that the flanges will remain straight. [Gambhir (2004)]
The second girder, marked b), is restrained with pronged supports at the ends and a torque is applied at the centre. Now the girder can not rotate about the x-axis which leads to the development of warping stresses; hence shall the flanges not remain straight. Observe that, due to symmetry, the St. Venant contribution is highest at the ends and abate towards the centre while the Vlasov contribution is at its maximum in the centre and diminish towards the ends. This symmetry causes the elimination of warping displacements at the centre. [Gambhir (2004)]
The third girder, marked c) is a cantilever which actually represents half the girder represented in case b). Here the girder is fixed at one end and the torque is applied at the end. Here we see the occurrence of warping. The Vlasov stresses are highest at the top and the St. Venant stresses are highest at the fixed end. [Gambhir (2004)]
If this girder is placed in the vertical, then a core in a tall building is represented, see Figure 2.21. The displacement of the flanges due to warping causes points a) and c) descend while the points b) and d) ascend. This axial displacement is due to Vlasov stresses. Observe that in this example the rotational centre is positioned at the centre of the web. This is due to the double symmetry that exists in an I-girder with flanges of equal length.