Veröffentlichungen der DGK
Ausschuss Geodäsie der Bayerischen Akademie der Wissenschaften
Reihe C Dissertationen Heft Nr. 793
Julia Kubanek
Volcano monitoring
with bistatic TanDEM-X SAR interferometry
München 2017
Verlag der Bayerischen Akademie der Wissenschaften
ISSN 0065-5325 ISBN 978-3-7696-5205-5
Veröffentlichungen der DGK
Ausschuss Geodäsie der Bayerischen Akademie der Wissenschaften
Reihe C Dissertationen Heft Nr. 793
Volcano monitoring
with bistatic TanDEM-X SAR interferometry
Zur Erlangung des akademischen Grades eines Doktor-Ingenieurs (Dr.-Ing.)
von der Fakultät für Bauingenieur-, Geo- und Umweltwissenschaften des Karlsruher Instituts für Technologie (KIT)
genehmigte Dissertation
Vorgelegt von
Dipl.-Geogr. Julia Kubanek
aus Neustadt am Rübenberge, Niedersachsen
München 2017
Verlag der Bayerischen Akademie der Wissenschaften
ISSN 0065-5325 ISBN 978-3-7696-5205-5
Adresse der DGK:
Ausschuss Geodäsie der Bayerischen Akademie der Wissenschaften (DGK)
Alfons-Goppel-Straße 11 ! D – 80539 München
Telefon +49 – 89 – 230311113 ! Telefax +49 – 89 – 23031-1283 /-1100 e-mail post@dgk.badw.de ! http://www.dgk.badw.de
Hauptreferent: Prof. Dr.-Ing. Dr. h.c. Bernhard Heck Korreferent: 1. Prof. Dr.-Ing. habil. Alberto Moreira
2. Priv. Doz. Dr. Thomas R. Walter Tag der mündlichen Prüfung: 24.05.2016
Diese Dissertation ist auf dem Server der DGK unter <http://dgk.badw.de/>
sowie auf dem Server des Karlsruhe Institute of Technology (KIT) unter <http://dx.doi.org/10.5445/IR/1000065004>
elektronisch publiziert
© 2017 Bayerische Akademie der Wissenschaften, München
Alle Rechte vorbehalten. Ohne Genehmigung der Herausgeber ist es auch nicht gestattet,
die Veröffentlichung oder Teile daraus auf photomechanischem Wege (Photokopie, Mikrokopie) zu vervielfältigen.
ISSN 0065-5325 ISBN 978-3-7696-5205-5
Insanity:
doing the same thing over and over again
and expecting different results.
(Albert Einstein)
Parts of this thesis have been published in the following pro- ceedings and journal articles:
Kubanek J, Westerhaus M, Heck B (2013a) On the potential of TanDEM-X to assess complex topography. In: Proc. of ESA Living Planet Symposium, 9.-13.
Sep. 2013, Edinburgh, Scotland
Kubanek J, Westerhaus M, Heck B (2013b) Topographic changes at Volc´an de Colima observed by double differential InSAR using TanDEM-X. In: Proc. of ESA Living Planet Symposium, 9.-13. Sep. 2013, Edinburgh, Scotland
Kubanek J, Westerhaus M, Varley N, James MR, Heck B (2014) On using bistatic TanDEM-X data for volcano monitoring. In: Proc. of 10th European Conference on Synthetic Aperture Radar (EUSAR), 3.-5. June 2014, Berlin, Germany
Kubanek J, Richardson JA, Charbonnier SJ, Connor LJ (2015a) Lava flow map- ping and volume calculations of the 2012-13 Tolbachik, Kamchatka fissure erup- tion using bistatic TanDEM-X InSAR. Bulletin of Volcanology 77(106):1–13, DOI 10.1007/s00445-015-0989-9
Kubanek J, Westerhaus M, Heck B (2015b) On the use of bistatic TanDEM-X images to quantify volumetric changes of active lava domes. In: International Asso- ciation of Geodesy Symposia, Springer International Publishing Switzerland, DOI 10.1007/1345 2015 172
Kubanek J, Westerhaus M, Schenk A, Aisyah N, Brotopuspito KS, Heck B (2015c) Volumetric change quantification of the 2010 Merapi eruption using TanDEM-X InSAR. Remote Sensing of Environment 164:16–25, DOI 10.1016/j.rse.2015.02.027
Abstract
Estimating the amount of erupted material during a volcanic crisis provides valuable insights into the eruption dynamics and its hazard, but is at the same time one of the major challenges in volcano research. One way to estimate erupted volumes is to assess topographic changes before and after an eruption while using digital elevation models. However, collecting topographic data is difficult, especially when topography is changing fast due to volcanic activity.
An innovative way to acquire 3-D information of volcanoes repeatedly is using data from the German TanDEM-X satellite mission. TanDEM-X consists of two nearly identical radar satellites that fly in a close formation, building a large single-pass synthetic aperture radar interferometer with adaptable spatial baselines. The short repeat interval allows generating digital elevation models of the area under investi- gation every 11 days, or multiples of this – depending on the availability of data – through the use of the interferometric phase.
The present thesis deals with the application of the bistatic TanDEM-X data in volcano research. A new data processing approach is developed in which TanDEM-X data are used to generate digital elevation models before, during, and after volcanic activity. A differential analysis of the digital elevation models allows to estimate the topographic and volumetric changes caused by the volcanic activity.
For developing and testing the differential TanDEM-X digital elevation model ap- proach, three test sites are chosen. They are characterized by different types of volcanic activity all of which cause a topographic change. Two test sites, Merapi in Indonesia and Volc´an de Colima in Mexico, are dome-building volcanoes whereas Tolbachik in Kamchatka is a volcanic complex composed of a shield volcano and a stratovolcano.
The focus at Merapi is on the quantification of the topographic changes in the summit area caused by its 2010 eruption. Using bistatic TanDEM-X data, three digital elevation models are generated before and after the eruption to reveal the large topographic losses of about 200 m.
The second study focuses on mapping and measuring lava flow extent and volume during the fissure eruption of Tolbachik in Kamchatka which occurred in 2012-13.
iv Abstract
During the eruption which lasted for about nine months, 18 TanDEM-X data pairs are analyzed. The differencing of digital elevation models enables to estimate the amount of basaltic lava that was extruded over time and results in a final lava flow volume of 0.53 km3.
The third study at Volc´an de Colima demonstrates the ability of the TanDEM-X differential approach to observe much smaller topographic changes. Altogether, 26 bistatic data pairs are analyzed to reveal the volumetric change due to a small explosive event in June 2011 which led to a topographic loss of up to 20 m.
The studies of all test sites indicate that TanDEM-X is suitable for revealing to- pographic changes at active volcanoes with a high accuracy. A comparison with aerophotogrammetric observations corroborates the TanDEM-X-based results. An extensive validation in areas where no topographic change is expected results in er- rors for the mean offset over all elevation differences of ±0.21 m for the Tolbachik test site and between ±0.13 m and ±0.59 m for Volc´an de Colima, depending on the slope. The good accuracy corroborates that differencing digital elevation models from TanDEM-X results in reliable estimates of topographic and volumetric changes due to various kinds of volcanic activity, which allows – in the case of Tolbachik – to calculate lava extrusion rates.
Ausf¨ uhrliche Zusammenfassung
Vulkanmonitoring mittels bistatischer TanDEM-X SAR-In- terferometrie
Die Bestimmung von Eruptionsvolumina w¨ahrend vulkanischer Aktivit¨at ist in vie- len Regionen f¨ur die ans¨assige Bev¨olkerung von großer Bedeutung, da sie hilfreiche Anhaltspunkte f¨ur die Gef¨ahrdung des jeweiligen Gebietes liefern k¨onnen. Eine M¨oglichkeit zur Bestimmung der Menge des ausgestoßenen Materials ist die Abbil- dung der Topographie vor, w¨ahrend und nach einer Eruption. Die Differenzbildung digitaler Gel¨andemodelle erm¨oglicht die Ableitung von H¨ohen- und Form¨anderun- gen des Gel¨andes, woraus das Volumen des eruptierten Materials bestimmt werden kann.
Digitale Gel¨andemodelle mit Aufl¨osungen im Meterbereich lassen sich unter anderem
¨
uber eine interferometrische Auswertung von Radar-Daten mit synthetischer Aper- tur (SAR-Daten) ableiten. Ein wesentlicher Vorteil der Nutzung von Radarsatel- liten ist, dass die Datenaufnahme global erfolgen kann. Ein weiterer Vorteil bei der Beobachtung aktiver Vulkane ist die Eigenschaft, dass die genutzten Wellenl¨agen im Gegensatz zum optischen Bereich die mit Eruptionen h¨aufig einhergehenden Rauch- wolken durchdringen k¨onnen. Da Radarsatelliten aktive Systeme sind, senden sie ihre eigene Strahlung aus und k¨onnen somit zu jeder Tages- und Nachtzeit Daten aufnehmen.
Die komplexen SAR-Daten bestehen aus der R¨uckstreumagnitude und der Phase.
Aus der Phasendifferenz von zwei SAR-Bildern, die ¨ublicherweise mit einem be- stimmten zeitlichen Abstand von dem gleichen Satelliten mit gleicher Aufnahmege- ometrie aufgenommen werden (Repeat-Pass Interferometrie), l¨asst sich die H¨ohe des Gel¨andes bestimmen.
Ein wesentlicher Nachteil der Nutzung von Radarbildern, die zu unterschiedlichen Zeiten aufgenommen werden, sind die zeitlich variablen Phasenterme. Solange die R¨uckstreueigenschaften am Boden stabil sind, kann eine interferometrische Auswer- tung gute Ergebnisse liefern. Das Hauptproblem ergibt sich aus den langen Wieder- holintervallen heutiger Satellitenmissionen. Obwohl die italienische Mission COS- MO-SkyMED Aufnahmen mit nur einem Tag Abstand erm¨oglicht, k¨onnen schon
vi Ausf¨uhrliche Zusammenfassung
kleinere Ver¨anderungen am Boden zu starken Dekorrelationen zwischen den zwei Radarbildern f¨uhren, die eine klassische interferometrische Auswertung verhindern.
Gerade Vulkangeb¨aude ver¨andern sich jedoch h¨aufig auch in kurzen Zeitintervallen deutlich, sodass die Repeat-Pass Interferometrie hier an ihre Grenzen st¨oßt.
Eine innovative M¨oglichkeit, um die Topographie von Vulkanen abbilden zu k¨on- nen, bietet die TanDEM-X Satellitenmission des Deutschen Zentrums f¨ur Luft- und Raumfahrt. Die Satellitenmission besteht aus den zwei nahezu baugleichen Radarsatelliten TerraSAR-X und TanDEM-X, die im engen Helix-Formationsflug die Erde umfliegen und dabei als großes SAR-Interferometer agieren. Prim¨ares Ziel der Mission ist die Generierung eines globalen digitalen Gel¨andemodells mit einer Aufl¨osung von 12 m und einer vertikalen Genauigkeit von 2 - 4 m.
W¨ahrend des ¨Uberfluges sendet einer der Satelliten elektromagnische Wellen aus und beide Satelliten empfangen das von der Erdoberfl¨ache zur¨uckgestreute Signal (Single- Pass Interferometrie). Als Ergebnis entstehen zwei nahezu zeitgleich aufgenommene komplexe SAR-Bilder, die jeweils aus der R¨uckstreuamplitude und der Phaseninfor- mation bestehen. Dieser Aufnahmemodus wird auch als bistatisch bezeichnet, im Gegensatz zur Aufnahme eines einzigen Bildes, dem monostatischen Aufnahmemo- dus. ¨Uber die interferometrische Auswertung der Laufzeitdifferenz beider Bilder k¨on- nen anhand der Phaseninformation hochaufgel¨oste digitale Gel¨andemodelle generiert werden.
Ein ¨ahnliches System wurde im Jahr 2000 mit der Shuttle Radar Topography Mis- sion (SRTM) umgesetzt. Im Gegensatz zur TanDEM-X-Satellitenmission befanden sich bei der SRTM-Mission die zwei Antennen auf der gleichen Plattform und die Mission konnte in ihrem elf-t¨agigem ¨Uberflug fast die komplette Erdoberfl¨ache ein- mal abbilden. Die Missionsparameter von TanDEM-X erm¨oglichen im Gegensatz zur SRTM-Mission wiederholte Aufnahmen eines Gebietes. Der innovative Charak- ter der TanDEM-X-Mission besteht in ebendieser M¨oglichkeit wiederkehrender Auf- nahmen. Das Widerholintervall der Mission ist elf Tage – oder ein Vielfaches davon – sodass bei regelm¨aßiger Aufnahme alle elf Tage ein digitales Gel¨andemodell generiert werden kann.
Das Ziel der vorliegenden Arbeit ist die Untersuchung und Bewertung der Nutz- barkeit der TanDEM-X-Daten in der Vulkanforschung. Ein neuer Ansatz zur Ver- arbeitung der bistatischen Daten wird vorgestellt und f¨ur die Ableitung vulkanol- ogischer Parameter getestet. Dabei wird aus den TanDEM-X-Daten die Topogra- phie vor, w¨ahrend und nach einem vulkanologischen Ereignis abgebildet. Anhand einer differentiellen Analyse der abgeleiteten digitalen Gel¨andemodelle k¨onnen to- pographische und volumetrische ¨Anderungen quantifiziert werden.
Um einen m¨oglichst allgemeing¨ultigen Ansatz entwickeln zu k¨onnen, wurden drei Testgebiete ausgew¨ahlt. Diese unterscheiden sich in der Art der vulkanologischen Aktivit¨at, die jedoch in allen drei Testgebieten topographische ¨Anderungen verur- sacht.
Der Merapi auf der indonesischen Insel Java ist ein dombildender Vulkan mit wech- selnder Aktivit¨at. Dombildende Vulkane sind durch effusive Eruptionen charakteri- siert, die sich ¨uber sehr lange Zeitr¨aume erstrecken k¨onnen. Alle paar Jahre treten Explosionen und Domzerst¨orungen mit einhergehenden pyroklastischen Str¨omen auf.
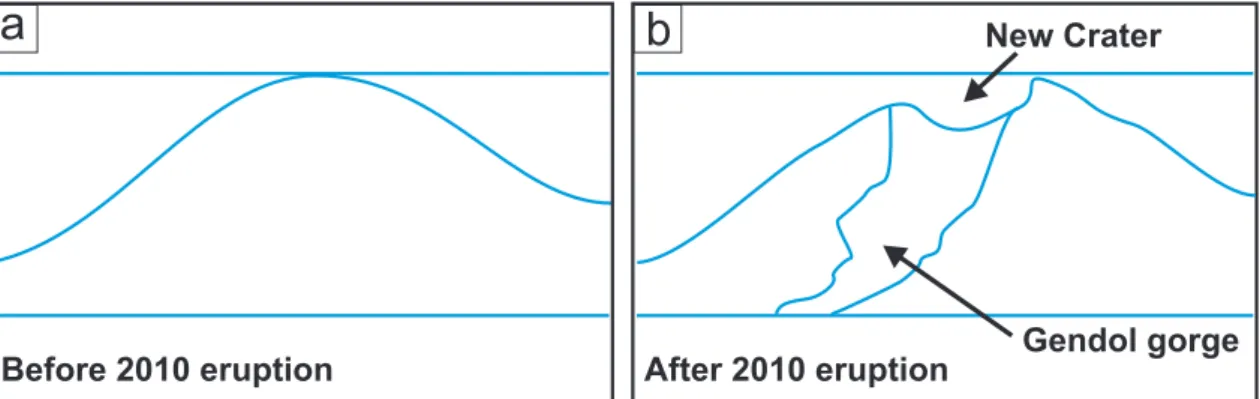
Am Merapi fand eine solche Zerst¨orung des Doms von Oktober bis November 2010
vii
statt. Zu Beginn der Eruption ist der alte Lavadom kollabiert. Der neugebildete Dom wurde nach zw¨olf Tagen wiederum zerst¨ort. Insgesamt f¨uhrte die Aktivit¨at am Merapi zur kompletten Zerst¨orung des Kraterbereichs und hinterließ zwei steile Kraterw¨ande und einen kleinen Dom im Innern des heute nach S¨udosten ge¨offneten Kraters. Die Nutzung eines bistatischen TanDEM-X Datenpaares, das im Oktober 2010 kurz vor der Eruption aufgezeichnet wurde, bildet die Pr¨a-Eruptionstopogra- phie ab. Zwei Datens¨atze, die etwa ein Jahr sp¨ater im Oktober und November 2011 aufgezeichnet wurden, werden zur Abbildung der posteruptiven Topographie genutzt. Durch die Differenzbildung der Datens¨atze l¨asst sich der Materialverlust im Gipfelbereich bestimmen, der am Merapi mit bis zu 200 m sehr groß ist.
Als zweites Untersuchungsgebiet wurde der Tolbachik in Kamtschatka in Russland gew¨ahlt. Der Tolbachik unterscheidet sich stark von den anderen zwei Untersu- chungsgebieten. Der Vulkankomplex besteht aus zwei ¨uberlappenden, morphologisch verschiedenen Vulkanen. W¨ahrend der Plosky Tolbachik im Osten ein basaltischer Schildvulkan ist, handelt es sich bei seinem Nachbarn im Westen, Ostry Tolbachik, um einen steilen Stratovulkan. Nachdem ¨uber 35 Jahre keine Aktivit¨at registriert werden konnte, wurde der Vulkankomplex im November 2012 aktiv. Die vulkani- sche Aktivit¨at bestand aus basaltischen Lavafl¨ussen, die s¨udlich des Vulkanmassivs entlang der von Nordost nach S¨udwest verlaufenden Spalten austraten. Die Spal- teneruption dauerte etwa neun Monate bis August 2013. W¨ahrend der Eruption wurden elf bistatische TanDEM-X Datens¨atze aufgezeichnet, die, in Kombination mit einem Datensatz, der kurz vor der Eruption aufgezeichnet wurde, sehr gut den fortdauernden Ausfluss neuer Lavamassen kartieren sowie die Berechnung des aus- gestoßenen Volumens erm¨oglichen. Aus der Zeit nach dem Ende der Eruption wur- den sechs weitere Datens¨atze genutzt, um die Wiederholbarkeit der Ergebnisse zu validieren.
Der Volc´an de Colima in Mexiko ist, wie auch der Merapi, ein dombildender Vulkan.
Am Colima wird untersucht, ob auch kleinere topographische ¨Anderungen mit dem entwickelten Ansatz quantifiziert werden k¨onnen. Die Studie konzentriert sich auf eine kleine Explosion, die sich im Juni 2011 am westlichen Rand des Kraters ereignet hat. Die Explosion wurde durch den pl¨otzlichen Stopp des aufsteigenden Magmas ausgel¨ost, was bis dahin zur Bildung des Doms f¨uhrte. Aus der Zeit vor der Explo- sion k¨onnen zwei Datenpaare aus dem absteigenden Orbit verwendet werden. Nach der Explosion sind sehr viele Datens¨atze vorhanden. Zur Quantifizierung des Volu- menverlustes im Gipfelbereich werden sieben digitale Gel¨andemodelle generiert, die die Post-Explosions-Topographie abbilden. Zur Analyse der Genauigkeit der abge- leiteten Gel¨andemodelle und Ergebnisse werden 19 weitere Datens¨atze prozessiert.
Die sich ergebenden 26 digitalen Gel¨andemodelle, die nach der Explosion zwischen Ende Juni 2011 und Ende Dezember 2012 aufgezeichnet wurden, eignen sich hervor- ragend zur weiteren Fehlerabsch¨atzung, da in dieser Zeit keine weitere vulkanische Aktivit¨at registriert wurde. Die topographischen ¨Anderungen am Volc´an de Colima sind mit maximal -20 m wesentlich kleiner als am Merapi.
Alle Studien der drei Untersuchungsgebiete best¨atigen, dass der auf TanDEM-X basierende Ansatz gute Ergebnisse liefert. Dies wird durch den Vergleich mit pho- togrammetrischen Beobachtungen best¨atigt. Das Hauptproblem des entwickelten Ansatzes sind am Merapi und am Volc´an de Colima die geometrischen Dekorrelatio- nen, die durch die steile und zerkl¨uftete Topographie an Stratovulkanen entstehen.
viii Ausf¨uhrliche Zusammenfassung
Am Tolbachik hingegen verursacht die Interaktion zwischen Lavafl¨ussen und der sich jahreszeitlich ¨andernden Vegetation die gr¨oßten Probleme.
Eine interne Validierung zur Fehlerabsch¨atzung in Gebieten, in denen keine to- pographische ¨Anderung durch Vulkanismus zu erwarten ist, ergibt am Tolbachik im eher flacheren Gel¨ande mittlere Abweichungen f¨ur die aus den digitalen Gel¨an- demodellen gebildeten Differenzen von±0.21 m und am Volc´an de Colima zwischen
±0.13 m und ±0.59 m in Abh¨angigkeit von der Gel¨andeneigung. Die Genauigkeit- sanalysen best¨atigen die Eignung von TanDEM-X, wiederholte digitale Gel¨ande- modelle von Vulkanen zu generieren, die ¨uber eine Differenzbildung eine verl¨assliche Quantifizierung der topographischen und volumetrischen ¨Anderungen erlauben. Die Anwendung der Methodik an unterschiedlichen Vulkanen und zur Untersuchung un- terschiedlicher Auspr¨agungen der vulkanischen Aktivit¨at zeigen das Potential und die Vielf¨altigkeit des entwickelten Ansatzes.
Contents
Abstract iii
Ausf¨uhrliche Zusammenfassung v
1 Introduction 1
1.1 Motivation . . . 1
1.2 Contributions . . . 2
1.3 Thesis roadmap . . . 3
2 SAR interferometry: basic principles and data processing 5 2.1 SAR measurement principle . . . 5
2.1.1 Imaging geometry . . . 6
2.1.2 Terrain induced distortions . . . 7
2.1.3 Resolution . . . 8
2.2 SAR interferometry . . . 10
2.2.1 Interferogram formation . . . 10
2.2.2 Interferometric phase contributions . . . 11
2.3 InSAR processing . . . 12
2.3.1 Coregistration and resampling . . . 12
2.3.2 Reference phase computation and subtraction . . . 13
2.3.3 Reference topography computation and subtraction . . . 13
2.3.4 Coherence . . . 13
2.3.5 Filtering . . . 15
2.3.6 Phase unwrapping . . . 16
2.3.7 Phase-to-height conversion . . . 16
2.3.8 Geocoding . . . 17
2.3.9 Gridding . . . 18
2.4 TanDEM-X mission concept . . . 18
2.5 Considerations for bistatic InSAR data processing . . . 22
2.6 Errors in digital elevation models . . . 25
3 Observation of topographic changes at active volcanoes 29 3.1 State of the art of topographic change estimation at volcanoes . . . . 29
3.2 State of the art of digital elevation model generation using InSAR . . 31
3.3 Recent studies using TanDEM-X in volcano research . . . 32
3.4 Double-differential TanDEM-X approach to study active volcanoes . . 34
3.5 Test site selection . . . 35
x Contents
4 Volumetric change quantification of the 2010 Merapi eruption 39
4.1 Geological setting . . . 39
4.2 The 2010 Merapi eruption . . . 41
4.3 Measuring topographic and volumetric changes during the 2010 eruption 42 4.3.1 Data description and processing . . . 42
4.3.2 Amplitude results . . . 43
4.3.3 Coherence results . . . 44
4.3.4 Interferometric results . . . 45
4.3.5 Volumetry . . . 49
4.4 Discussion . . . 51
4.5 Conclusions and perspectives . . . 52
5 Mapping lava flows of the 2012-13 Tolbachik, Kamchatka fissure eruption 55 5.1 Geological setting . . . 55
5.1.1 The 1975-76 eruption . . . 56
5.1.2 The 2012-13 eruption . . . 57
5.2 Mapping lava flows and measuring flow volume . . . 58
5.2.1 Data description . . . 59
5.2.2 Data processing . . . 60
5.2.3 Lava flow mapping . . . 64
5.2.3.1 Visual amplitude interpretations . . . 64
5.2.3.2 Visual coherence interpretations . . . 68
5.2.3.3 Interferometric results . . . 69
5.2.4 Lava flow area and volume calculation . . . 73
5.2.5 Uncertainty estimation . . . 77
5.2.6 Comparison of TanDEM-X based results with aerophotogram- metric observations . . . 83
5.2.7 Comparison of the 2012-13 and 1975-76 eruptions . . . 85
5.2.8 From theory to near real-time estimates . . . 86
5.3 Discussion . . . 88
5.4 Conclusions and perspectives . . . 90
6 Quantification of small volumetric changes at Volc´an de Colima, Mexico 93 6.1 Geological setting . . . 93
6.2 Recent eruptive activity . . . 94
6.3 Measuring small topographic changes during the June 2011 explosion 96 6.3.1 Data description . . . 96
6.3.2 Data processing . . . 96
6.3.3 Amplitude results . . . 100
6.3.4 Coherence results . . . 100
6.3.5 Interferometric results . . . 101
6.3.6 Topographic and volumetric changes . . . 104
6.3.7 Comparison of TanDEM-X based results with aerophotogram- metric observations . . . 106
6.3.8 Uncertainty estimation for TanDEM-X elevation differences in mountainous terrain . . . 108
6.4 Discussion . . . 116
Contents xi
6.5 Conclusions and perspectives . . . 118
7 Conclusions and Outlook 121
7.1 Conclusions . . . 121 7.2 Outlook . . . 124 A Additional material for Tolbachik volcano 131
Bibliography 137
List of Symbols 151
List of Acronyms 153
Acknowledgments 155
1. Introduction
1.1 Motivation
Measuring the volume of erupted material during a volcanic event is one of the major challenges in volcano research but is at the same time of particular importance as it allows assessment of the hazard and risk during an eruption. One way to measure erupted volumes – regardless of the type of volcanic activity – is the generation and differencing of pre-, syn-, and/or post-eruption digital elevation models (DEMs).
Among other methods, synthetic aperture radar (SAR) interferometry (InSAR) al- lows the generation of DEMs with meter-level accuracy using the phase difference between two radar images of the same target area. In addition to the possibility of global acquisitions, one of the major advantages of InSAR is its cloud-penetrat- ing characteristic, which is especially important with regard to studies at active volcanoes.
A widespread method is using spaceborne radar images acquired at different times to derive the interferometric phase (repeat-pass InSAR). As long as the backscat- tering conditions on the ground and the atmospheric conditions remain unchanged, repeat-pass InSAR provides appropriate results (Bignami et al., 2013; Wadge, 2003;
Wadge et al., 2011). The main problem is due to the repeat-interval of current radar satellite missions. Although the Italian COSMO-SkyMed (Constellation of small Satellites for Mediterranean basin Observation) mission has the potential for 1-day repeats, repeat-times are, under normal conditions, one to several weeks. Ma- jor surface changes in very short time intervals that commonly occur during volcanic crises due to ashfall, lava flows, lava dome collapse, or explosions, deteriorate the coherence and hinder or even prevent interferometric analysis (Lu and Freymueller, 1998; Stevens et al., 2001; Stevens and Wadge, 2004; Wadge, 2003). Former studies therefore conclude that data acquired simultaneously (single-pass, bistatic mode) are required to extract topographic information from InSAR at fast-changing envi- ronments like volcanoes.
The innovative German Earth observation mission TanDEM-X (TerraSAR-X add- on for Digital Elevation Measurement) is of great importance to overcome some
2 1. Introduction
of the problems of the repeat-pass interferometric approach. The two almost iden- tical radar satellites TerraSAR-X (TSX) and TanDEM-X (TDX) fly in close helix formation and concurrently acquire images of the same place on the Earth’s surface from slightly different positions in a single pass. It is the first time that DEMs of low coherent and highly dynamic areas (i.e., volcanoes) can be generated repeatedly (with an interval of 11 days or multiples) using InSAR, even with cloud cover or during nighttime. Differencing of TanDEM-X DEMs therefore opens the opportu- nity to assess topographic and volume changes at active volcanoes using spaceborne InSAR.
The advantage of using InSAR to study decorrelation-prone volcanic phenomena and the innovative TanDEM-X satellite mission are the background of the present study. The thesis deals with the application of bistatic TanDEM-X imagery to study active volcanism, aiming to answer the general research question:
Can TanDEM-X InSAR serve as a basis to quantify topographic and vol- umetric changes in non-coherent areas around volcanoes and thus over- come the limitations of ground-based, optical, and repeat-pass interfero- metric methods?
The research question requires to develop and test a methodology that is able to observe different volcanic processes that lead to a topographic change and cause a decorrelation in repeat-pass InSAR data. To ensure that volcanic activity could be studied, three test sites showing different volcanological characteristics were selected.
Merapi on Java, Indonesia, and Volc´an de Colima in Mexico are both steep-sided stratovolcanoes with varying lava-dome activity. Long terms of dome extrusion with intermittent explosions and gravitational dome failure culminate in complete dome destruction. The third test site, the Tolbachik volcanic complex in Central Kamchatka, Russia, is different. Composed of a shield volcano in the east and a stratovolcano in the west, its recent eruptive activity took place from the central crater and along a fissure zone south of the complex. The extruded lava is basaltic and very fluid.
1.2 Contributions
The contributions of the thesis can be split into two main fields: (1) the development and test of a strategy to process bistatic TanDEM-X data with the open source soft- ware DORIS (Delft Object-oriented Radar Interferometric Software, Kampes et al., 2003) and (2) the application of the developed methodology in volcano research. As the application of the TanDEM-X data to study, e.g., steep-sided environments like dome-building volcanoes requires special processing considerations, both research topics influence each other. The following list summarizes the main topics of the conducted research:
1. Interferometric processing of bistatic TanDEM-X data to generate high-reso- lution DEMs, including format conversion of the raw data.
2. Using radar shadow masks to enhance volume estimates in steep topography.
3. Accuracy assessment of TanDEM-X-based DEMs and derived products with and without using external data sources.
1.3. Thesis roadmap 3
4. Application of the strategy to assess large topographic changes at steep-sided stratovolcano Merapi due to its 2010 eruption.
5. Application of TanDEM-X bistatic data to study lava flows that were emplaced during the 2012-13 Tolbachik fissure eruption.
6. Application of the developed processing strategy to assess topographic changes at a 20 m level at Volc´an de Colima due to an explosion in June 2011.
1.3 Thesis roadmap
The second chapter summarizes the basic principles and applications of SAR inter- ferometry. In addition to an introduction to the SAR measurement principle, the chapter gives an overview of the main interferometric processing steps necessary to generate DEMs using the DORIS software package. The chapter further introduces the TanDEM-X satellite mission and summarizes the general data processing con- siderations of the bistatic TanDEM-X data. It concludes with a characterization of the main errors in digital elevation models generated from SAR interferometric data.
The second chapter provides the basic knowledge for the following chapters, which are the core of the present thesis. Chapter 3 gives an overview of the state of the art of topographic change estimation at volcanoes. Previous studies that used TanDEM-X to analyze active volcanism are further described. The last two parts of Chapter 3 provide the methodological background of the thesis and explain why the three test sites mentioned above were selected to develop and test the TanDEM-X-based approach. The following three chapters (Chap. 4, 5, and 6) include the application of the bistatic TanDEM-X data to study various volcanological phenomena. In Chapter 4, the 2010 eruption of Merapi in Indonesia is investigated. The TanDEM-X-based study is underpinned by results that were acquired during fieldwork. Chapter 5 provides the results of a temporal TanDEM-X-based approach that was developed to study the lava flows that were emplaced during the 2012-13 fissure eruption of Tolbachik in Kamchatka, Russia. For validation, the TanDEM-X-based results are compared to photogrammetric data. The accuracy is further validated using refer- ence areas where no topographic change is expected. In Chapter 6, small lava-dome changes at Volc´an de Colima in Mexico are analyzed. Like at Tolbachik, the chapter provides a comparison of the TanDEM-X-based results to photogrammetric data, and also a validation using data pairs from a period when Volc´an de Colima re- mained quiet. Finally, Chapter 7 – conclusions and outlook – summarizes the most important results and gives an extensive outlook raising a number of questions for further research.
2. SAR interferometry: basic
principles and data processing
This chapter gives a short introduction to spaceborne InSAR and its application in earth sciences. It is not an attempt to give a comprehensive explanation of the entire methodology, as several authors have done this before (e.g., Curlander and McDonough, 1991; Hanssen, 2001). The objective is to provide an overview of the interferometric measurement principle and the processing steps necessary for DEM generation and commonly faced difficulties.
Section 2.1 of this chapter describes the principles of the SAR measurement and explains the imaging geometry of SAR systems (Sec. 2.1.1). The geometric effects resulting from the side-looking characteristic of SAR systems are described in Sec- tion 2.1.2. In Section 2.1.3, the synthetic aperture is shortly described, as well as resolution considerations of SAR images.
In Section 2.2, the SAR interferometric technique is explained including a description about the formation of interferograms (Sec. 2.2.1). The different components that build the interferometric phase are further described (Sec. 2.2.2).
Section 2.3 describes the main steps of the interferometric (repeat-pass) processing chain to generate DEMs based on the DORIS software (Kampes et al., 2003).
The innovative TanDEM-X mission is presented in Section 2.4 and an overview of mandatory changes to process bistatic data is given in Section 2.5. The chapter concludes with the most important error sources that have an effect on the accuracy of DEMs generated by repeat-pass and single-pass InSAR (Sec. 2.6).
2.1 SAR measurement principle
Imaging radar systems, such as SAR, emit electromagnetic pulses and receive the signal that is reflected from the ground. The two-way travel time from the antenna to the target is used to measure its distance. The backscattering on the ground allows to derive physical quantities of the surface, i.e., its roughness, the topography, and the dielectric characteristics. Monostatic systems use a single antenna whereas bistatic
6 2. SAR interferometry: basic principles and data processing
systems employ two physically separated antennas for transmission and reception (Hanssen, 2001; Bamler and Hartl, 1998).
Spaceborne SAR systems operate in the microwave (cm to dm wavelength) band of the electromagnetic spectrum and are therefore able to penetrate clouds. While being active sensors, SAR systems provide their own illumination and can operate almost independently from the sun during day- and nighttime. This, as well as the potential to acquire information globally, makes them suitable for operational monitoring tasks (Bamler and Hartl, 1998). SAR is therefore capable to monitor dynamic phenomena like earthquakes (Massonnet et al., 1993), ocean currents (Fu and Holt, 1982), ice sheet motion (Goldstein et al., 1993), and volcanic activity (Massonnet et al., 1995).
2.1.1 Imaging geometry
The imaging geometry of SAR systems mounted on an aircraft (airborne) or a satel- lite (spaceborne) is side-looking. The sensorS moves with a velocityv at a heightH (Fig. 2.1). The antenna transmits microwave pulses to the ground to illuminate the antenna’s footprint at the rate of the pulse repetition frequency (PRF) and receives the backscattered pulses. The sensor transmits to the side (range) of the satellite’s path (azimuth) (Bamler and Hartl, 1998). Transmitting in range allows to discrimi- nate targets with a different distance to the sensor and generates a reflectivity map of the Earth’s surface in 2D (Bamler, 2000).
Figure 2.1– SAR imaging geometry based on Bamler (2000).
Figure 2.2 shows a cross section of the acquisition geometry where the sensor images a target T that is elevated by a local topography to a heighth above the reference surface. Slant range Ris the distance betweenS andT and thus the natural product of the range measurement. Ground range r is the distance between the ground track of S and T on the correct position of the reference surface (see also Fig. 2.1). To transform R to r, every point needs to be corrected using the local terrain height (see Sec. 2.3.8) (Olmsted, 1993).
2.1. SAR measurement principle 7
Figure 2.2– Cross section of terrain imaging with SAR based on Olmsted (1993).
The angle between nadir and the range vector that is defined by the antenna orien- tation and the height of the platform is the look angle θ. The incidence angle θinc is defined as the angle between the local vertical (ellipsoidal normal) and the slant range vector. For a flat earth,h = 0, θinc =θ holds. The local incidence angle θloc
is defined as the angle between the local topographic surface normal and the slant range vector.
The SAR illumination results in a reflectivity map based on the slant range mea- surement. Considering a smooth surface, a non-linear relationship characterizes the distance from the sensor to the target and its cross-track position in the image. The side-looking characteristic of the SAR instrument causes a variation of the incidence angle in ground range. The spacing of two points with the same cross-track distance therefore appears compressed in near range compared to points with the same cross- track spacing in far range (Fig. 2.3a). From this property, it becomes also apparent that the resolution depends on the range distance.
2.1.2 Terrain induced distortions
Due to the side-looking imaging geometry, variations in terrain height can further cause distortions that depend on the local incidence angle (terrain induced distor- tions). The look angleθmust be chosen large enough to achieve a reasonable ground range resolution, but choosing it too large in turn causes grazing incidence with low backscatter (Fig. 2.4). It is usually chosen between 20◦ and 50◦ for spaceborne SAR systems (Olmsted, 1993).
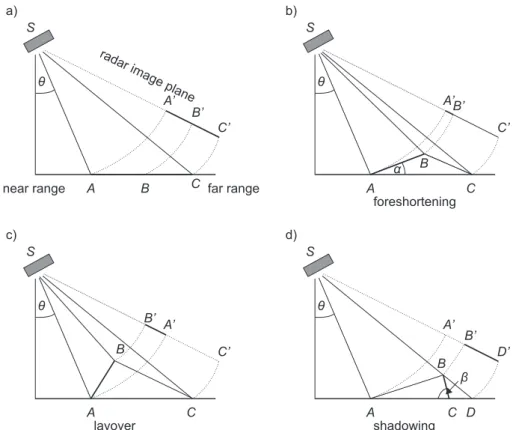
Given the terrain inclination angleα, three different types of terrain induced distor- tions (also referred to asgeometric effects) can be distinguished: (1)foreshortening, (2) layover, and (3) shadowing. They are explained in the following:
Foreshortening
Forshortening occurs when the slope that is directed towards the sensor is smaller than the look angle (α < θ). The slope will be imaged smaller than it is compared to the flat-earth-scenario (Fig. 2.3a). This situation can be seen at pointsA0 and B0 in the image plane of the radar (Fig. 2.3b).
Layover
If the slope is faced towards the sensor and is very steep withα≥θ, the summit will be displayed closer to the sensor than the foot of the hill in the radar image plane, resulting in a strongly decorrelated image (Fig. 2.3c). Additionally, the backscatter
8 2. SAR interferometry: basic principles and data processing
Figure 2.3 – Geometric effects in SAR images based on Olmsted (1993). (a) Rela- tionship between slant range and ground range, (b) foreshortening, (c) layover, and (d) shadowing.
from positions on the ground that are located at different places, but in the same slant range distance, is received simultaneously, which affects assigning the received signal to the corresponding backscatter on the ground. This can be clearly seen in the amplitude information of SAR data, where layover areas commonly appear very bright (Fig. 2.4).
Shadowing
Shadowing can be considered as the opposite to layover. It occurs, when the slope is greater than or equal to the look angle (β≥θ) but with the slope normal pointing away from the sensor. Regarding Figure 2.3d, the area between points B and D cannot be seen by the sensor, shown by the absence of pointC0 on the image plane.
For the reason that no backscatter is received, shadow areas appear dark in the amplitude image (Fig. 2.4).
2.1.3 Resolution
Whereas the radar principle that scans the surface with the speed of light is used in range, a continuously moving antenna beam with velocity v is used in azimuth.
This imaging constellation requires transmitting subsequent pulses at a defined PRF (Bamler, 2000).
The resolution in range direction depends on the bandwidth of the transmitted pulses and is usually between 1 and 50 m. The bandwidth of TanDEM-X data for the Me- rapi test site is, for instance, 100 MHz for the pre-eruption data pair and 150 MHz for the post-eruption data pairs, leading to a ground range resolution of 2.9 m and
2.1. SAR measurement principle 9
Figure 2.4– Geometric effects in a TanDEM-X amplitude image of Merapi. Shadow areas and areas with a low backscatter due to grazing incidence on slopes tilted away from the SAR sensor appear dark, layover areas are bright.
1.9 m, respectively. The azimuth resolution is limited by the antenna length and de- creases with increasing distance to the target. Regarding a real aperture system, the antenna would require several kilometers of length to achieve meter-level resolution in azimuth for a platform in space, i.e., a satellite in several hundreds of kilome- ters height (Moreira, 2000). The solution is the imaging with a synthetic aperture which enables an azimuth resolution independent from the distance to the ground (Albertz, 2009). SAR is based on the fact that each object is seen by the sensor over a certain amount of time, i.e., as long as it is within the flight track of the satel- lite. The received echoes are then correlated, which means that independent pixels on the ground are imaged several times. The larger their distance to the sensor, the more often they are imaged. Since the SAR antenna is moving relative to the ground, the echoes are subject to the Doppler-effect (Moreira, 2000). This means that higher frequencies are observed when the object is moving towards the sensor, and lower frequencies are given when the object is moving away. During processing, the variation of the Doppler frequency of every point in the image is correlated and its correct relative position can be calculated. The movement of the platform in addition to a coherent reception of the echoes thus leads to a synthetic aperture.
Coherent receiving of the echoes means that amplitude and phase information are detected from the backscattered signal by quadrature demodulation. The pre-pro- cessed (focused) radar image consists of a complex-valued raw data matrix which is organized in pixels (in range) and lines (in azimuth). Every pixel is composed of a real (in-phase) and an imaginary (quadrature) component (Bamler, 2000). After image acquisition, a SAR processor is employed to simulate a long antenna and to correct the phase of the echo lines of the raw data matrix.
The length of the synthetic aperture is defined by the radiation pattern of the real aperture and the distance to the target. The resolution in azimuth is a conse- quence of the synthetic aperture length (Moreira, 2000) and is, for example, 3.3 m for TanDEM-X.
10 2. SAR interferometry: basic principles and data processing
2.2 SAR interferometry
InSAR uses the phase difference between two (or more) SAR images of the same target area acquired at different times (repeat-pass InSAR) to monitor ground dis- placements of the surface, e.g., at active volcanoes, on a mm to cm scale. As a second application, DEMs with meter-level resolution can be generated. The basic require- ment for both approaches – the DEM generation and the deformation monitoring – is that the backscattering properties on the ground must be stable over time. It is defined by the coherence γ, as the normalized complex spatial cross-correlation of the interferometric signal (see Sec. 2.3.4). Regarding DEM generation, using images acquired at the same time (single-pass InSAR) reveals the best results (see Sec. 2.6).
One image (in repeat-pass mode usually the one that was acquired first) is commonly referred to asmaster (ormaster image) and the other one asslave (orslave image).
To receive an interferometric phase change between the two image acquisitions, at least one imaging parameter of the slave must be different compared to the master.
Regarding the deformation approach, the movement of the pixel in the line-of-sight (LOS) direction of the satellite leads to a phase change. In contrast, DEM genera- tion usingacross-track interferometry commonly requires that the terrain is viewed from a slightly different position in each acquisition but without changing the look angleθ. The difference in observation point from master and slave acquisition is the baseline B, which can be split into its component perpendicular to the look direction (perpendicular baseline, B⊥) and its component in look direction (parallel baseline, Bk) (Fig. 2.5).
Figure 2.5– Principle of interferometric SAR after Hein (2004).
2.2.1 Interferogram formation
Each complex SAR image consists of complex values that are aligned along a regular grid. Each complex signaly1 (master image) and y2 (slave image) can be split into an amplitude and a phase component (Hanssen, 2001):
y1 =|y1|exp(jψ1) (2.1)
y2 =|y2|exp(jψ2). (2.2)
2.2. SAR interferometry 11
The complex multiplication of y1 and y2 yields the complex interferogram:
y1y2∗ =|y1|exp(jψ1)|y2|exp(−jψ2) = |y1||y2|exp(j(ψ1−ψ2)). (2.3) With one SAR image, it is not possible to distinguish between the two points P1 and P2 in Figure 2.5 that are at the same slant range. Using only a single SAR image, the points would be mapped into the same resolution cell. However, since P2 is elevated at h, the points obviously have a different ground range. Using a second SAR image, the difference in both echo signals leads to the phase which can be used to reveal the change in look angleθ between the two points. This change in combination with the range R1 and the height of the satellite enables to determine the height h of point P2. Regarding DEM generation, the second image must be acquired from a slightly different position to derive the interferogram and to reveal the change in look angle (Hein, 2004). The phase values ψ1 and ψ2 for point P2 in both images are according to Hanssen (2001):
ψ1,P2 =−2π2R1
λ +ψ1scat (2.4)
ψ2,P2 =−2π2R2
λ +ψ2scat, (2.5)
with range R1 and R2 for P2 in the master and slave acquisitions, respectively, the radar wavelength λ, and the scattering phases ψ1scat and ψ2scat for P2. If ψ1scat and ψ2scat equal each other, the difference of both phase values results in the interfer- ometric phase φ, as a sensitive measure for the range difference (Hanssen, 2001;
Bamler and Hartl, 1998):
φ =−4π∆R
λ , (2.6)
where ∆R = R2−R1 is the difference in the path length of the signal. The factor 4π results from the range distance for the transmitted and received signal, while the satellite transmits and receives during both fly-overs.
2.2.2 Interferometric phase contributions
According to Hooper et al. (2004), the interferometric phase (or differential phase)φ is composed of the reference phaseφref, the topographic phaseφtopo, the phase change due to the displacement of the ground scatterer in the LOS of the satelliteφdef, the phase contribution due to atmospheric phase delayφatm, the phase contribution due to orbital errorsφorb, a phase portion due to the changing backscattering properties on the ground φbs, and the portion of phase noiseφnoise:
φ =φref +φtopo+φdef+φatm+φorb+φbs+φnoise. (2.7) Several studies successfully applied repeat-pass InSAR to detect and monitor ground displacement at active volcanoes (e.g., Massonnet et al., 1995; Pritchard and Simons,
12 2. SAR interferometry: basic principles and data processing
2002; Parks et al., 2012). For deriving surface displacement φdef on a cm to mm scale, a (high-resolution) DEM is required during processing to subtract the topo- graphic phase portion φtopo. When no deformation occurs between two overflights, repeat-pass InSAR also allows the generation of DEMs with meter-level accuracy.
2.3 InSAR processing
For the reason that the present research focuses on the derivation of DEMs from interferometric SAR, the following section gives an overview of the processing steps necessary to generate DEMs from monostatic (repeat-pass) SAR data using DORIS.
A flowchart of the basic processing steps is given in Figure 2.6. The flowchart lists the steps in the order they are executed in DORIS.
Figure 2.6– Processing chain of the basic steps for DEM generation using DORIS.
2.3.1 Coregistration and resampling
Different start- and stop-times during image acquisition result in varying imaging geometries for different scenes, which means that the SAR images are shifted against each other and distorted. Interferometric processing therefore requires the sub-pixel registration of the slave image with respect to the master as first step. The accuracy of the coregistration affects not only the quality of the final interferogram but also of the generated DEM.
The coregistration is usually done in two steps. Thecoarse registration first applies the precise satellite orbit data and timing to approximate the offsets between the two images. The relative shifts between slave and master image are estimated within a few pixels in range and tens of pixels in azimuth (Hanssen, 2001). The coarse registration itself consists of two steps. Given an arbitrary point on the master’s orbit and an arbitrary range, the coarse coregistration starts with determining the
2.3. InSAR processing 13
corresponding position of the pixel on the reference ellipsoid. In the next step, the correct Doppler position of the pixel is iteratively found for the slave orbit. The timing of both orbit positions enables derivation of the shifts in azimuth and further also the shifts in range.
In the subsequentfine registration, evenly distributed correlation windows are used to estimate the offsets for each window. Only the amplitude information is commonly used to determine the relative shifts between the master and slave image in azimuth and range direction. The calculated relative shifts of a set of windows can be used to estimate a two-dimensional polynomial which in turn can be used to calculate the displacement vectors for every single pixel in the slave image. Oversampling enables determination of the coregistration offsets on a subpixel level (Hanssen, 2001).
Resampling is afterwards required because the geometrical transformation usually does not result in integer values. The resampling is, therefore, nothing else than transferring the derived shift from the distorted to the rectified image using an interpolation between discrete points. Different interpolation kernels like nearest neighbor, bilinear interpolation, cubic convolution, or truncated sinc function were tested (Hanssen and Bamler, 1999; Li and Bethel, 2008). Both studies conclude that the resampling preference depends on the SAR data type and (correlation) quality as well as on the terrain type. Therefore, there may not be just one ’best’ resampling algorithm for coregistering complex SAR data.
2.3.2 Reference phase computation and subtraction
After interferogram formation (see Sec. 2.2.1), the phase caused by the reference surface, i.e., WGS 84 (World Geodetic System 1984) ellipsoid, is simulated and sub- tracted from the interferogram. The reference phase φref is – as is the topographic phase φtopo – a result of the different slant ranges when B6= 0. The subtraction of the geometric phase φref which results from the known SAR acquisition geometry is common to derive the full information of the interferogram. The resulting fringe pattern of the flattened interferogram already resembles iso-height contours, but is still ambiguous (Fig. 2.7) (Bamler and Hartl, 1998).
2.3.3 Reference topography computation and subtraction
This step is not mandatory, especially when the aim is generating a DEM itself.
However, including a reference DEM during processing decisively simplifies phase unwrapping (Sec. 2.3.6). A reference DEM, such as SRTM (Shuttle Radar Topog- raphy Mission), is radar coded, which means it is converted from geographical to radar coordinates while using the acquisition geometry of the master satellite. It is, therefore, the reverse procedure of geocoding (Sec. 2.3.8). The reference topography phase φtopo can be used in different steps of the processing. In the present work, it is subtracted from the complex interferogram after subtracting the reference phase φref, resulting in the residual wrapped phase ϕ. After unwrapping, the reference topography φtopo has to be added again to the residual (unwrapped) phaseϕunw as the geocoding step requires real height values.
2.3.4 Coherence
The (local) coherence γ is a measure of the accuracy of the interferometric phase and is used to estimate the phase noise of the complex interferogram (Hanssen, 2001;
Ferretti et al., 2007a). The coherence of two SAR images is defined as:
14 2. SAR interferometry: basic principles and data processing
Figure 2.7– Complex interferogram of Merapi before and after subtracting the ref- erence phaseφref. (a) Phase information before reference phase subtraction, (b) phase information before reference phase subtraction plotted on top of the amplitude image, (c) phase information after reference phase subtraction, and (d) phase information after reference phase subtraction plotted on top of the amplitude image.
γ = E{y1y2∗}
pE{|y1|2}E{|y2|2}, 0≤ |γ| ≤1, (2.8) whereE{.} is the expectation and∗ denotes the complex conjugated variable (DO- RIS Manual, 2009; Hanssen, 2001). With Equation (2.8), the coherence of every single pixel can be estimated. In practice, however, uniform regions are assumed to have consistent coherence values. The pixels surrounding the pixel of interest are, therefore, included in the analysis by the spatial average over N pixels (Hanssen, 2001):
|ˆγ|= |PN
n=1y1(n)y2∗(n)| q
PN
n=1|y1(n)|2PN
n=1|y2(n)|2
, (2.9)
with|ˆγ|as the estimation value of|γ|. The replacement of the expectation by spatial averaging is related to the assumption of an ergodic stochastic process. The spatial averaging is conducted over a shifting window including a few pixels in range and azimuth. The amount of pixels that are used for averaging determines the accuracy of the estimation (Hanssen, 2001).
The coherence can be estimated with or without prior subtraction of the reference phase φref (see Sec. 2.3.2). If only phase statistics are derived from γ, Equation (2.9) can be used. However, noise φnoise in the data and/or a systematic phase change in the estimation window due to topographic φtopo, atmospheric φatm, or deformation signals φdef which lead to variations in the effective path length over the scene decrease the estimated coherence. The phase corrected coherence γˆpc
2.3. InSAR processing 15
should, therefore, be preferred if the phase noise is, e.g., used to classify terrain types (Hanssen, 2001):
|ˆγpc|= |PN
n=1y1(n)y∗(n)2 exp(−jφ(n))|
q PN
n=1|y1(n)|2PN
n=1|y2(n)|2
(2.10)
withφ(n) as the systematic phase component for each pixel.
Considering mountainous terrain, a reference DEM phaseφtoposhould be subtracted for a proper estimation of γ (DORIS Manual, 2009).
Identical acquisitions lead to an entirely coherent signal, which is in reality not true as several factors influence the signal. For repeat-pass systems, these are among others thermal noise φnoise, changed atmospheric conditions between two overflights φatm, changes in the backscattering properties on the ground φbs, and geometric decorrelation (Schw¨abisch, 1995; Hanssen, 2001). Figure 2.8 shows a coherence image of Merapi as example.
Figure 2.8– Example showing the coherence image of Merapi. Dark colors show low and bright colors indicate high coherence.
2.3.5 Filtering
Filtering is done to reduce phase noiseφnoise and can be employed at different times during processing. The two filtering approaches that were used in this thesis are complex multilooking and phase filtering which are described in the following:
Complex multilooking
One way to reduce noise is complex multilooking, which is usually applied during interferogram generation/reference phase subtraction φref. It aims to increase the radiometric accuracy by spatial averaging of the complex interferogram. Subse- quently, the image resolution is decreased (Ferretti et al., 2007b).
Phase filtering
Filtering after interferogram generation is usually employed before phase unwrap- ping. A widely used filter that can also be applied within the DORIS software packages is theadaptive filter developed by Goldstein and Werner (1998). A second option,spatial convolution(Schowengerdt, 1983), is also implemented within DORIS to filter the complex interferogram.
16 2. SAR interferometry: basic principles and data processing
2.3.6 Phase unwrapping
The phase is always ambiguous in terms of integer values of 2π. Resolving the ambiguous phase is called phase unwrapping. Wrapping the absolute phase to the [−π, π)-interval is a forward problem that is solved easily. The phase unwrapping as the inverse problem is not, especially in presence of phase noiseφnoise and geometric problems in the data (see Sec. 2.1.2, Hanssen, 2001).
Different phase unwrapping algorithms exist (see Ghiglia and Pritt (1998), for an overview). As the unwrapped phaseφunw contains information that cannot be found in the wrapped phase φ, phase unwrapping is according to Chen and Zebker (2001) an extremely difficult problem which forces all algorithms to rely on assumptions.
The most common one is that the unwrapped phase information of adjacent pixels varies less than π. If this property holds, the unwrapping can be performed by integrating the wrapped phase differences of adjacent pixels. The problem is here, among others, the already mentioned geometric effects. Shadow and layover areas transgress the assumption, leading to bigger phase jumps in the data. A maximum likelihood approach is necessary to resolve the problem.
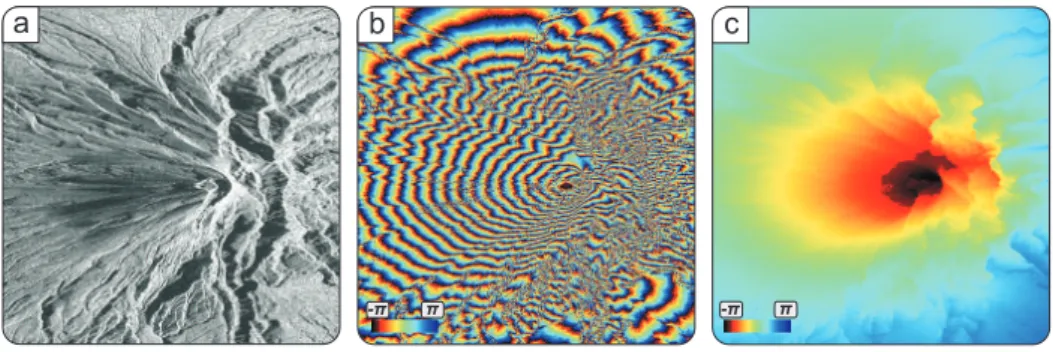
Figure 2.9 – Example images showing intermediate products of Merapi. (a) Am- plitude image, (b) ambiguous wrapped phase φ, and (c) interferometric phase after unwrappingφunw.
Within DORIS, the Statistical Cost-Flow Network algorithm (SNAPHU) developed by Chen and Zebker (2001) is recommended. The approach employs nonlinear cost functions and treats the unwrapping problem as a maximum a posteriori probability problem. This enables to use the expected characteristics of the interferometric SAR signals and their statistics to develop approximation models to solve the ambigu- ous phase (Chen and Zebker, 2001). Figure 2.9 shows the complex interferogram (b) before and (c) after phase unwrapping for the Merapi test site.
2.3.7 Phase-to-height conversion
In this step, which is also called slant-to-height conversion, the solved unambiguous phase is converted to topographic height.
The measured height h above the reference body is according to Hanssen (2001) defined as
h=−λRsinθ
4πB⊥ φunw. (2.11)
λ,R, sinθ, andB⊥ are known, φunw is the unwrapped phase. An initial value based on a reference surface such as an ellipsoid is used for sinθ. A change in the height
2.3. InSAR processing 17
above the reference body leads to a change in the look angle and a change of the perpendicular baseline (see Fig. 2.5). The phase-to-height conversion therefore needs to be solved iteratively until a satisfying accuracy is reached forh (Hanssen, 2001).
The height of ambiguity hamb is the height difference between two adjacent discon- tinuities. It can be computed from the interferometric parameters. Inserting 2π for the unwrapped phaseφunw in Equation (2.11) yields
hamb =−λRsinθ 2B⊥
, (2.12)
which is the height of ambiguity as the height difference corresponding to an inter- ferometric phase of 2π. The height of ambiguity allows assessing the interferometric performance while providing information on the height of the terrain that can un- ambiguously be resolved within a 2π phase change (Gonz´ales et al., 2010).
2.3.8 Geocoding
The described phase-to-height conversion already results in a DEM which is still in the SAR-specific slant range imaging geometry. To make it useful for different applications, e.g., for scientific analyses, it has to be transformed to common geode- tic coordinates. Geocoding is therefore nothing else than a transformation from the radar coordinates (range, azimuth, height) into coordinates of a geodetic ref- erence system (longitude, latitude, height) such as WGS 84 or ITRF (International Terrestrial Reference Frame) (Hanssen, 2001; Schw¨abisch, 1995).
For SAR, the range to the target as well as the Doppler centroid, which is the Doppler shift at the antenna beam center, of the backscattered signal is known.
This enables determination of the precise position of the satellite and the properties of the Earth surface (Olmsted, 1993). Geocoding is, therefore, implemented in DORIS using the Range-Doppler algorithm. To determine the position of a target on Earth, three equations need to be solved simultaneously, containing the positioning parameters x, y, and z with respect to an ITRF (geocentric, equatorial reference frame) (Curlander and McDonough, 1991; Olmsted, 1993; B¨ahr, 2013):
1. The range equation indicates that the range measurement R equals the dis- tance to the target:
|Rs−Rt| −R = 0, (2.13)
with Rs and Rt as the sensor and target positioning vectors, respectively.
2. The Doppler equation expresses that the distance between the object point related to the pixel is located perpendicular to the flight track of the satellite (Doppler centroid):
fDC −2Vs(Rs−Rt)
λ|Rs−Rt| = 0, (2.14)
where fDC is the Doppler centroid frequency, Vs is the sensor velocity vector, and
18 2. SAR interferometry: basic principles and data processing
3. the Earth model equation x2+y2
(Re+h)2 + z2
(1−f)(Re+h)2 −1 = 0, (2.15) with h the height above the reference ellipsoid andRe the Earth radius at the equator. f is the geometrical flattening of the ellipsoid.
Geocoding means the direct transformation, i.e., from image to object. The location equations can be solved for every pixel to convert to Cartesian coordinatesx, y, z in a geodetic coordinate system:
(i, j)←→(x, y, z), (2.16)
where i and j are the range/azimuth coordinates of the pixel. The geocoding pro- cedure is usually implemented as an iterative procedure to solve the location and conversion equations (DORIS Manual, 2009; Geudtner, 1995).
2.3.9 Gridding
The next step involves the conversion to geographic coordinates:
(x, y, z)←→(Φ,Λ, h), (2.17)
where Φ and Λ are geographic latitude and longitude, respectively. The geographic coordinates can further be transformed to a metric map projection, e.g., UTM (Uni- versal Transverse Mercator):
(Φ,Λ, h)←→(X, Y, h), (2.18)
withX as easting and Y as northing (see Heck, 2003).
2.4 TanDEM-X mission concept
One example for acquiring SAR data in a single-pass was the SRTM-mission in February 2000. During the 11-day-long space shuttle flight, two radar antennas separated by 60 m were used to map the Earth’s land surface in bistatic acquisition mode, resulting in a 30 m (1 arc second) resolution DEM and a 90 m (3 arc seconds) resolution DEM between about 60◦ north and 57◦ south (Rabus et al., 2003).
In contrast to the single-pass acquisition and static DEM of the SRTM mission, the TanDEM-X mission enables the acquisition of bistatic data repeatedly with a temporal baseline of 11 days, or multiples, in ascending and descending orbit for the first time.
The satellite mission consists of the two nearly identical radar satellites, TerraSAR-X (TSX) and TanDEM-X (TDX), which fly at an altitude of about 510 km in a sun-syn- chronous orbit. Table 2.1 gives an overview of the mission parameters used for ac- quiring the data for the global DEM as the primary mission goal. The parameters
2.4. TanDEM-X mission concept 19
Table 2.1 – TanDEM-X mission parameters based on Lachaise et al. (2007).
Mean orbit altitude 511.5 km
Orbit Sun-synchronous
Inclination 97.44◦
Effective across track baseline 300 - 500 m Along track baseline <1 km Baseline knowledge <1 mm
Radar wavelength 3.1 cm (X-band)
Incidence angle ca. 31◦- 48◦
Range bandwidth 100 MHz
PRF ca. 3 kHz
Range swath width 26 - 31 km
Scene length in azimuth direction ca. 100 km Expected coherence 0.70 - 0.85
are also valid for the data used in this thesis. However, characteristics given in other publications may vary due to the different mission objectives and phases. For instance, during the TanDEM-X science phase, the pursuit monostatic phase that started in autumn 2014 was characterized by a set of drifting across track baselines ranging between 0 m and 750 m (Hajnsek et al., 2014). This is suitable for SAR tomography or large baseline investigations in the polar regions.
Both satellites carry high performance SAR systems, operating in the microwave spectrum using X-band (9.6 GHz). Whereas in monostatic mode only one data pair is acquired during a fly-over, a TanDEM-X fly-over in bistatic mode acquires two radar images simultaneously, which form a single-pass interferogram (Moreira et al., 2003). Either TSX or TDX can be used as transmitter and both satellites receive the backscattered signal simultaneously (Krieger et al., 2007). Since the temporal changes in the backscattering properties on the ground φbs are negligible and the atmospheric conditions during image acquisition are the same, the coherence is re- markably increased compared to repeat-pass data sets (Stevens and Wadge, 2004).
According to Martone et al. (2012b), the coherence of all acquisitions processed between December 2010 and April 2012 for the global TanDEM-X DEM is 0.75.
Table 4.1 gives an overview of measured coherences for the analyzed data pairs of the Merapi test site, Table 5.1 for the Tolbachik test site, and Table 6.1 for Volc´an de Colima.
Moreira et al. (2003) developed the HELIX formation to coordinate the close for- mation flight of the two satellites and to ensure interferometric performance. The specific configuration enables acquisition of images of the entire Earth’s surface with adaptable across (300 - 500 m) and along track (almost zero to several kilometers) baselines. This allows different applications at the same time, e.g, sensing of ele- vation with a stable height of ambiguity and sensing of velocity, e.g., wind speed, or detection of moving targets. Whereas the maximum across track baseline occurs over the equator, the trajectories of the two satellites intersect over the poles. For global DEM acquisition (and thus also for the data used in this thesis), the along track baseline needs to be smaller than 1 km.
20 2. SAR interferometry: basic principles and data processing
Whereas ascending and descending acquisition geometries are always suitable to map equatorial regions (including the Merapi and Volc´an de Colima test sites), only one geometry is suitable to map northern and southern latitudes (including the Tolbachik test site) at the same time. It depends on the crossing orbits of TSX and TDX at the poles due to the HELIX configuration. This leads to short effective baselines for the complementary acquisition geometry and results in a low height sensitivity.
The effective baselineBeff is defined as half the length of the perpendicular baseline B⊥ for the TanDEM-X products (see Sec. 2.5).
Since the start of the satellite mission in 2010, the ascending orbit has been the fa- vorable orbit with suitable baselines for the northern hemisphere (i.e., the Tolbachik test site, see Chap. 5). For the possibility to use both acquisition geometries and different effective baselinesBeff for the global DEM generation – which is especially required in difficult terrain like, e.g., valleys, mountains, high vegetation – the satel- lite formation was swapped from August 2013 until April 2014 (Borla Tridon et al., 2013; Zink, 2014). This was done by a 180◦ shift of the libration phase in the HELIX formation (Krieger et al., 2007). During this period, the descending orbit was the favorable orbit for northern latitudes and the ascending orbit for southern latitudes.
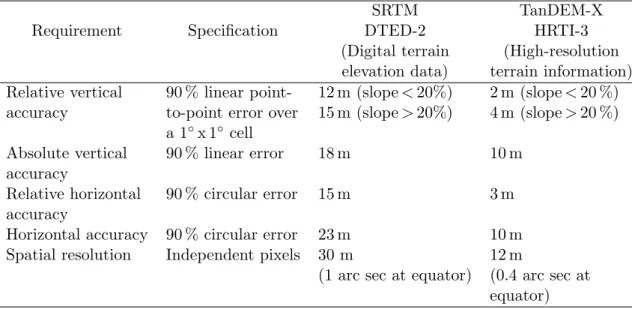
Table 2.2– Comparison of TanDEM-X and SRTM specifications after Krieger et al.
(2007).
SRTM TanDEM-X
Requirement Specification DTED-2 HRTI-3
(Digital terrain (High-resolution elevation data) terrain information) Relative vertical 90 % linear point- 12 m (slope<20%) 2 m (slope<20 %) accuracy to-point error over 15 m (slope>20%) 4 m (slope>20 %)
a 1◦x 1◦ cell
Absolute vertical 90 % linear error 18 m 10 m accuracy
Relative horizontal 90 % circular error 15 m 3 m accuracy
Horizontal accuracy 90 % circular error 23 m 10 m Spatial resolution Independent pixels 30 m 12 m
(1 arc sec at equator) (0.4 arc sec at equator)
The primary mission goal is the acquisition of a global DEM with unprecedented accuracy according to the high-resolution terrain information (HRTI)-3 standard.
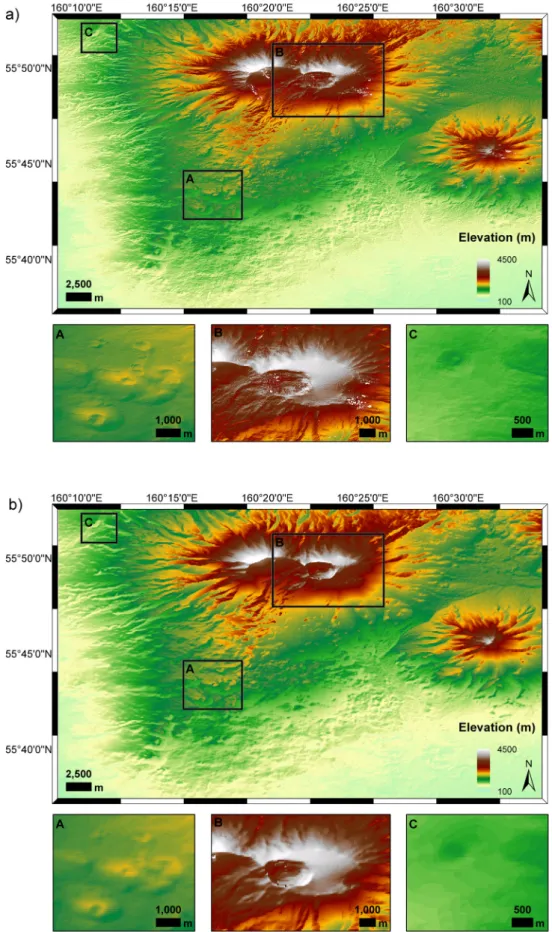
This requires a spatial resolution of 12 m, a relative vertical accuracy of 2 to 4 m depending on the slope, and a relative horizontal accuracy of 3 m. To fulfill these requirements, data segments from successive TanDEM-X satellite passes are com- bined to improve the DEM accuracy (Krieger et al., 2007). Table 2.2 compares the specifications of the TanDEM-X DEM with those of the 30 m SRTM DEM. The DEM quality of an exemplary 12 m resolution TanDEM-X DEM compared to a 90 m SRTM DEM covering the Tolbachik test site is further shown in Figure 2.10. 90 m SRTM data were chosen here since 30 m SRTM data were not available for the se- lected test site. SRTM data were acquired in 2000 and the TanDEM-X data were acquired about 12 years later at the end of 2012, but before the Tolbachik fissure eruption investigated in Chapter 5 occurred. The topography in both DEMs should
2.4. TanDEM-X mission concept 21
Figure 2.10 – Comparison of (a) 12 m resolution TanDEM-X DEM and (b) 90 m resolution SRTM DEM for the Tolbachik test site. Clippings A, B, and C show details of the scene.