Requirements for the Visualization of System-Spanning Business Processes
Ralph Bobrik
University of Ulm, DBIS Group 89069 Ulm, Germany bobrik@informatik.uni-ulm.de
Manfred Reichert
University of Twente, Information Systems Group 7500 AE Enschede, The Netherlands
m.u.reichert@cs.utwente.nl Thomas Bauer
DaimlerChrysler Research & Technology, REI/ID P.O. Box 2360, 89013 Ulm, Germany thomas.tb.bauer@daimlerchrysler.com
Abstract
The monitoring and visualization of enterprise-wide and cross-organizational business processes is an important, but also very complex task. The information needed for vi- sualizing processes may be scattered over heterogeneous, distributed information systems. These systems may only support fragments of the process and may use different process meta models. Besides an integrated view on these process data, any process visualization must be flexibly and dynamically adaptable to the needs of different applica- tions and user groups. This paper discusses requirements of a flexible process visualization in distributed environ- ments. This includes process data integration issues as well as issues related to adaptable process visualization.
1. Introduction
The process map of today’s enterprises covers a broad spectrum of processes ranging from administrative to knowledge intensive ones. As an example take the auto- motive sector where a variety of (business) processes exist, e.g., related to car development, change management, or supply chain management. Many of these processes are of considerable complexity and long duration (up to several months or years). They usually involve different domains (e.g., electric/electronic engineering, mechanical engineer- ing, and software engineering), organizations (e.g., car ven- dors or suppliers), and groups (e.g., managers, engineers, administrative staff, technicians).
Obviously, an integrated process support is highly de- sirable in such an environment. Due to different reasons, however, full process integration and process automation support are difficult to achieve. Information systems in the automotive sector, for example, are very complex and
are typically composed of a large number of distributed, heterogeneous application components. Many of them al- ready support fragments of a process, but often hardwire the process logic in the application code. This, in turn, makes it difficult to provide process transparency and an integrated process support. As a consequence users are un- able to keep track of their processes, what makes it impossi- ble to quickly react to exceptional situations or to optimize work with respect to the current process status. Therefore process cycle times are longer than necessary and resources are not utilized in a cost-effective way.
Though there is no central coordination of the overall processes, corresponding control and application data are often available in application-specific log files (audit trails).
If we provide an integrated view on all these log data, the monitoring of system-spanning processes will become fea- sible. However, the realization of such an integrated moni- toring and visualization component is by far not trivial. As discussed the information needed for process visualization is usually scattered over distributed, heterogeneous appli- cations. The collection of these data is difficult since dif- ferent applications apply different ways of representing log data. This, in turn, results in syntactical as well as seman- tical discrepancies. Furthermore process (fragment) imple- mentations may be based on different process meta models which aggravates the creation of integrated process views.
In addition to data integration issues, a process moni- toring component should allow the flexible visualization of the process logic and of all process-related data (includ- ing application data). Among other things this requires the (semi-) automated layouting and drawing of process graphs and the sophisticated visualization of the different aspects of process schemes and process instances (e.g., control and data flow, activity states). Furthermore different views on the same process may have to be provided. For example, managers are only interested in high-level process views, Proc. 1st Int'l Workshop on Business Process Monitoring and Performance Management (BPMPM'05),
in conjunction with DEXA 2005, Copenhagen, Denmark, August 2005 (to appear)
whereas engineers or technicians need detailed informa- tion about the processes they are involved in. The cho- sen kind of process visualization further depends on user preferences as well as on the process information the user wants to get when approaching the system. While some users want to have graphical overviews, others prefer a tex- tual or tabular description of the process.
In this paper we discuss basic requirements with respect to the visualization of system-spanning processes in com- plex enterprise environments. The presented work is em- bedded in a larger project on process transparency and vi- sualization, which aims at the realization of a powerful and adaptable component for visualizing all kind of (distrib- uted) process data in an integrated manner.
Section 2 discusses related work. In Section 3 we present important requirements for process visualization components. In Section 4 we sketch the architecture of our process monitoring approach. Section 5 concludes with a summary and an outlook on future work.
2. Related Work
Usually process-aware information systems (e.g.
workflow-based applications) maintain comprehensive execution logs. The intelligent analysis of these process data is becoming more and more important. Current efforts related to Business Activity Monitoring, Business Process Intelligence, Business Process Analysis, and Process Mining reflect this evolution [2, 12]. These approaches collect process data, analyze them in different respects, and derive optimized process models. In all of these cases, the visualization of process schema and process instance data is crucial.
Several approaches exist, which address issues related to the visualization of process schemes [6, 8, 9]. Less work is available regarding the visualization of enterprise-wide and system-spanning processes [1]. The task of layouting process graphs is addressed by some papers [11, 16].
Solutions for the visualization of process instances are mainly provided by commercial workflow management systems, like MQ Workflow, Lotus Workflow, Staffware, or Oracle Process Manager [7]. One flaw of all these ap- proaches is that the monitoring is restricted to processes running on the same platform. Processes controlled by dif- ferent engines cannot be visualized at all.
Other shortcomings are the poor options offered for cus- tomizing the way processes are visualized.
Another platform for business process diagnosis is ARIS Process Performance Manager (PPM) [4]. Process execution data from different sources are collected in a database. ARIS PPM processes these data by aggregat- ing and precalculating key performance indicators like ex- ecution times or cost attributes. This information is used
to generate charts according to the user’s request. ARIS PPM can be considered as a tool for building process ware- houses. It allows users to analyze process performance properties. This includes aggregated views on a collection of process instances as well as performance characteristics of single process instances. ARIS PPM visualizes process execution information mainly as aggregated charts based on many instances, whereas the visualization of single in- stances is only poorly supported. A comparable approach is followed by IBM’s WBI Monitor [3].
3. Requirements
In this section we discuss important requirements for vi- sualizing processes whose log data are scattered over sev- eral systems. All of these requirements have been elabo- rated in case studies from the automotive sector.
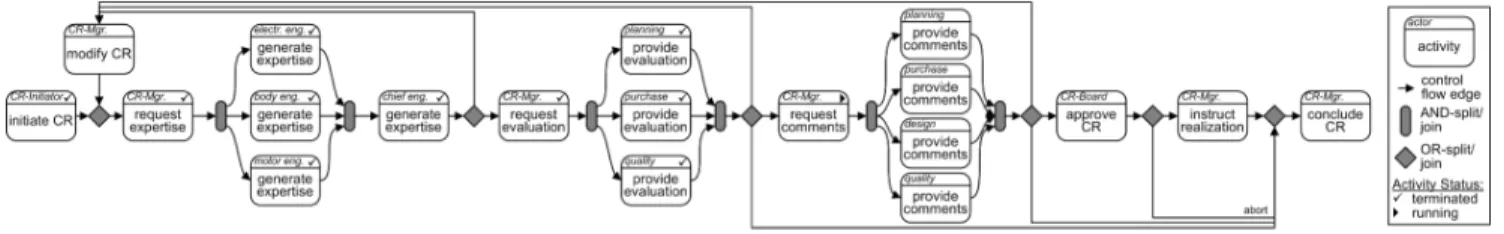
The structure of real-world processes can be very com- plex. Relevant process aspects include, for example, activ- ities and associated IT systems, the control and data flow between these activities, actor and resource assignments, or status information. As an example take Fig. 1, which shows the control flow view of a virtual but realistic change man- agement process. More precisely, this process deals with the handling of a Change Request (CR). It starts with the initiation of the CR, which then must be detailed and as- sessed by different engineering teams. In the following, non-technical teams from (production) planning and pur- chase have to give an additional evaluation (e.g., concern- ing economical feasibility). Finally, the CR has to be ap- proved by the CR-board before further detailing the plan- ning and starting the construction. All these aspects must be visualized in an integrated manner. In addition, respec- tive process visualizations should be flexibly customizable to users’ needs.
Process instances carried out within one workflow man- agement system (WfMS) can be monitored by respective clients. However, as mentioned, many real world processes span over several systems. To get a complete overview of these processes, users have to access different monitoring components and logs, in the worst case one for each system involved. A monitoring component for system-spanning processes should visualize this information in an integrated way. Generally we have to deal with different scenarios:
Scenario 1 Process-aware applications based on WfMS:
WfMS have been designed to support business processes and usually provide rich APIs to access in- formation about running instances (e.g., audit trails).
Scenario 2 Process-oriented applications implemented with conventional programming techniques: These applications execute processes or process fragments.
Figure 1. Process of dealing with Change Requests (CR) (simplified control flow view)
However, the process logic is not explicitly modeled but "hard coded". Usually there are only rudimen- tary APIs to access log data. Applications of this type also include approaches generating program code out of explicitly defined process models.
Scenario 3 (Process-unaware) Applications carry out process-related tasks but are not aware of the process context. Very often, however, the process context of a task execution can be derived from application data.
Scenario 4 (Human processes) In many cases fragments of a process are not supported by any IT system, but are to be manually carried out by process participants.
This scenario is characteristic for knowledge intensive processes, e.g., from the engineering domain.
Business processes usually cover more than one of these scenarios, which makes their integrated visualization a challenging task. Table 1 gives an overview of the require- ments that will be treated in the following.
Requirements for Visualization of System-Spanning Processes
data integration
• visualization of schema, instance, and application data
• integration of distributed data
• harmonization of different data formats
• mapping of meta models
• correlation of instance data user-specific visualization
• central spot of information
• adequate visualization for different user groups with different motivations
• highly flexible, generic view concept
• different visualization forms
• adaptable graphical parameters
automatic layout
• full or semi automatic further requirements
• multilingualism
• linkage with actor assignment component
• handling of process changes non-functional requirements
• robustness
• maintainability
• ease of roll-out
• performance
• usability
Table 1. Overview of the Requirements
3.1. Process Data Integration
The information relevant for process visualization in- cludes bothschema and instance data. It can be further di- vided as follows (cf. [14]): First, a process schema captures
the logic of the process, e.g., its activities and the control and data flow between them. Second, process relevant data are needed by the process enactment service to decide on the routing of process instances. Respective data, for exam- ple, are usually maintained within a WfMS. The third class of data are application data. These can be simple values like a part number or complex data objects like a document or a CAD record. Altogether a monitoring component must be able to visualize process schema data as well as instance- specific control data, process relevant data, and application data.
A prerequisite for the integration of all kind of process data is the availability of the respective schema informa- tion. WfMS usually provide interfaces to access process schema data (Scenario 1). Regarding Scenario 2 process schemes are more or less hardwired in the application code.
For Scenarios 3 and 4 schema data are not explicitly avail- able at all. Similar considerations may apply to runtime data: While WfMS and process-oriented applications usu- ally log process execution data, the approaches followed in Scenarios 3 and 4 do not (or at least not in the direct context of the process execution). If log data are not explicitly ac- cessible, at least we should try to gather and correlate them.
Furthermore process mining techniques could be useful to derive process schemes if not explicitly available [12].
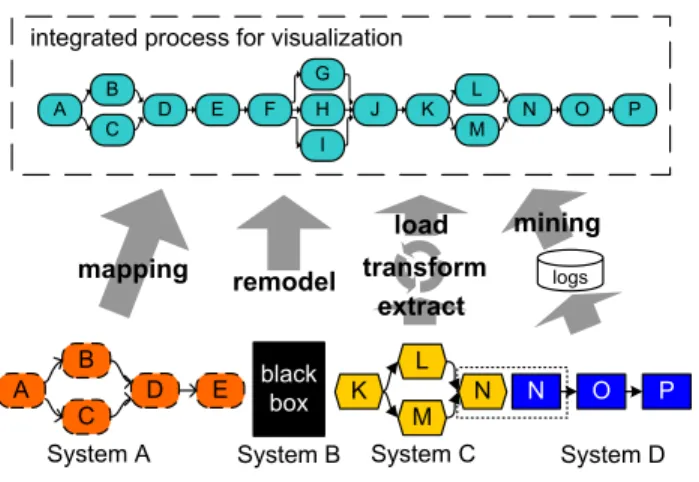
To gather process informationdistributed over several systemsis a challenge since every participating system uses its own format for representing schema and instance data (cf. Fig. 2). This requires a unified way of representing process data. If two or more systems are involved in a process they may use different meta models based on which they describe their internal process logic. When visualizing the overall process the representation of the process logic must be harmonized. Therefore different process mapping techniques can be applied depending on the specific prop- erties of the system to be mapped and depending on its interfaces. Among possible techniques are a direct map- ping from the source to the destination system, extract- transform-load (ETL) approaches using import/export in- terfaces to intermediate formats, and process mining re- constructing process schema information from log files [12]. If the source system does not provide any information
A B
C D E K
L
M N N O P
System A System B System C System D black
box
A C
B D E F J K
I G
H M
L N O P
integrated process for visualization
mapping remodel
mining transform
extract load
logs
Figure 2. Mapping of Process Models
about the process schema we might be obliged to remodel the process manually. The same holds for non automated process fragments.
Two different activities of a process instance may be ex- ecuted on different systems. Due to this we cannot assume that these activities use the same unique process identifier.
Thus thecorrelationof instance related data is a big issue in practice. For example, we may have to use application data (like a part number or a telephone number) to cor- relate respective process data. Overlapping process frag- ments (cf. activity N in Fig. 2) are an other challenge of mapping process models. Similarly, different granularities of modelation may be used within the process models (i.e., an activity modeled as one step in system X may be repre- sented by several steps in system Y including more details).
The process of developing a new car is spanning several organizations [5]. In the most common form of collabo- ration, the lead manufacturer contracts a supplier for the production and/or development of a car component (ob- viously this can be a n-tier configuration with many sub- contractors). For providing a visualization of suchcross- organizational processes respective data must be made available. Cross-organizational integration of process data then becomes a topic imposing further issues like trust and security (cf. Section 3.4).
3.2. User-specific Visualization
Any process visualization component should be the cen- tral information spot for all process related information. In particulardifferent user groupsmust be able to access the system, e.g., managers, process owners, process adminis- trators, process designers, process participants, system de- signers, or extern collaborators. These users approach the system with varying motivations. Managers want to get a quick overview of the overall process status; team leaders
want to know where their colleagues have to interact with other teams, departments, or companies; IT administrators are looking for the systems involved in the processes. Each user has distinct knowledge about the business processes in general and the processes he or she is involved in, in par- ticular. Consequently, a "one-for-all" visualization will not fulfill expectations and user requirements. Instead we have to be able to adopt process visualizations according to the habit, knowledge, experience, and interests of the different user groups.
In any case we need a more flexible way to visualize process graphs when compared to current approaches. For example a manager only wants to get a quick overview of the overall process (i.e., an aggregated view on the process) but does not want to see its implementation details. There- fore process elements need to be hidden or removed from the process visualization. In general we need a generic view conceptlike the one known from (relational) database systems. It should permit us to aggregate or remove parts of a process schema or a process instance, filter the ele- ments according to their types and attributes, or combine several processes in a single representation form. The two fundamental techniques for building such views on process graphs are graph aggregation and graph reduction as shown in Fig. 3.
A B C D E
A N E
Aggregation
A B C D E
A E
Reduction
aggregate reduce
Figure 3. Aggregation and Reduction of Processes The effects of views are illustrated in Fig. 4, which shows a view (and its definition) of the process graph from Fig. 1. A SQL-like view definition language is needed to express that all nodes not executed by the CR Manager and which possess either statusterminatedorskipped, shall be removed from the process graph by dynamically apply- inggraph reductiontechniques. When aggregating activ- ity nodes we further have to cope with the mapping of at- tribute values (e.g., the activity status attribute) from the set of original activities to the aggregated one. Such views must be applicable to single process instances (as shown in Fig. 4) or to a collection of instances of the same process
actor activity
CREATE REDUCED VIEW cr-mgr-running AS SELECT FROM cr-process p
WHERE p.activity.actor = „CR-Mgr.“ AND NOT (p.activity.state = „terminated“ OR p.activity.state = „skipped“)
CR-Mgr.
request expertise
CR-Mgr.
request comments CR-Mgr.
modify CR
CR-Board approve
CR CR-Mgr.
request evaluation
CR-Mgr.
request comments
CR-Mgr.
conclude CR abort CR-Mgr.
instruct realization
CR-Mgr.
request comments
CR-Board approve
CR
CR-Mgr.
conclude CR abort CR-Mgr.
instruct realization
View Definition View applied on Process
CREATE REDUCED VIEW cr-manager AS SELECT FROM cr-process p WHERE p.activity.actor = „CR-Mgr.“
multiple handle
CR CR-Mgr.
request comments CR-Mgr.
modify CR
others provide comments planning
provide comments
CR-Board approve
CR
CR-Mgr.
conclude CR
abort CR-Mgr.
instruct realization
CR-Mgr.
request comments CR-Mgr.
modify CR
purchase provide comments planning
provide comments
quality provide comments
CR-Board approve
CR
CR-Mgr.
conclude CR abort CR-Mgr.
instruct realization design
provide comments multiple
handle CR GREGATED VIEW cr-running AS
M cr-process p (p.activity.state = „terminated“
state = „skipped“) Activity Status:
terminated running actor
activity body eng.
generate expertise electr. eng.
generate expertise
motor eng.
generate expertise
chief eng.
generate expertise
CR-Mgr.
request comments
purchase provide comments planning
provide comments
quality provide comments
CR-Board approve
CR CR-Mgr.
instruct realization CR-Mgr.
request evaluation
purchase provide evaluation planning
provide evaluation
quality provide evaluation
design provide comments
Figure 4. View on CR-Process
type. Ideally views can also be used to allow the combined visualization of different processes in one representation.
This would give us great flexibility in visualizing processes according to user requirements.
As a second important issue process information must be presented in various ways to fulfill the information needs of the different user groups. Let us illustrate this by an ex- ample: TheCR Managermay need a visualization like the one depicted in Fig. 1 for getting a detailed overview of the previous and future course of the CR process. An other view on that process like the one shown in Fig. 4 gives him an overview of next steps to be worked on. The manager of the department responsible for the Change Management process may be interested in an aggregated overview of the running CR processes (cf. Fig. 5 a). For project planning tasks a visualization like the one depicted in Fig. 5 b) is de- sirable. For illustrating the collaboration with the contrac- tor or other departments the visualization form shown in Fig. 5 c) and Fig. 5 d) might be most suitable. All thesevi- sualization formsshould be based on the same information and users should be allowed to dynamically switch between them. Therefore it is of utmost importance that the meta model the visualization component is based on reflects the process with all related information. With such a strong data foundation at hand it should be possible to visualize processes in every desired form.
A further issue towards personalized process visualiza- tion is theadaptability of graphical parametersrelated to the use of fonts, colors, symbols, annotations, etc. These options should be configurable for a specific type of process visualization as well as for a single user.
3.3. Layouting of Process Graphs
Basically, process schemes should be represented as graphs to a user. Such process graphs consist of nodes (with different node types) connected by edges (of differ- ent edge types). In combination with node and edge labels, automatically layouting process graphs and reducing edge crossings to a minimum are complex tasks.
We have discussed several reasons why the drawing of a process may have to be dynamically adopted (e.g., to dy- namically create a particular view on the process). Some of the parameters that influence the visualization can be fixed at buildtime, but others change continuously, e.g., the vi- sualization of the process view from Fig. 4 may have to be updated whenever the process status changes. Another point in favor of an automatic generation of process draw- ings is the high effort necessary for the manual creation and maintenance of such drawings.
For all these reasons we need algorithms forautomati- cally layoutingprocess graphs. When redrawing a process or process view representation (e.g., after a change of its
E A
B C
A D F
message message
company A
company B a) Process Cockpit
CR A CR B CR C
time t Q4'04 Q1'05 Q2'05 Q3'05 c) Process Interaction
time t b) Gantt Diagram
D B
C
A E
Dept. ADept. BDept. C
d) Swim Lane Diagram A B
C
A D
Figure 5. Different Ways of Visualizing a Process
status and/or structure) respective algorithms should con- sider (semantical) context information of the visualization.
For example, information about the previous visualization form and the semantics of the logical changes applied to a process could be useful in that context.
Special requirements result from the design and the implementation of layout algorithms. When dynamically adapting the drawing of a process, layout changes should be kept as minimal as possible; i.e., when the logical repre- sentation of a process view changes too much from one step to another, users will not be able to recognize the process in the new representation.
Another point to consider is the update frequency. In a highly dynamic environment where process status changes often occur, it is not feasible and usually not required to up- date the drawing with the same frequency. Instead more so- phisticated and customizable update strategies are needed.
3.4. Security and Access Control
Security is a big issue in the context of business process monitoring and visualization. In many cases processes are highly confidential and not everybody should be allowed to see all details of the ongoing processes. Therefore con- straints must be applied for different granularities, rang- ing from restricting access to whole processes, over special types of elements or attributes that must not be shown, to a specific level of detail.
The integrated access to application data further in- creases the complexity of access control. In particular the access constraints set out by the integrated applications must be followed by the visualization component as well.
As an example take the actors involved in the above CR- process. Cost details about the entire vehicle project per- haps should not be accessible by an engineer whereas in a visualization for the general manager these data should
be present (at least in an aggregated way). Note that the grant or refusal of access privileges may induce changes in process views and the respective drawings.
Another scenario where security issues are of high im- portance concerns the collaboration with external partners.
As discussed in [5, 13] partners within a collaboration must not see details of the internal implementation of processes and vice versa. Therefore reduced views on the process are needed that contain only that data the partner is allowed to access. Maintaining both public and private views for all processes implies redundant information and is very costly and error prone. So it is necessary to generate these views automatically from the process definition and from the de- scription of the access rights.
3.5. Further Requirements
In order to support the visualization of cross-country processes, an important aspect is the capability of the soft- ware to support multiple languages. The mixture of differ- ent cultures using the same software imposes new require- ments on the design of the human interface and the used visualizations.
Further requirements include the handling of notifica- tions, the linkage of the process visualization component with a component for resolving actor assignments, for han- dling all kinds of process changes (e.g. insertion, dele- tion, etc. [10]), and for visualizing deadline violations or changes of resource assignments.
So far we have only discussed functional requirements, the visualzation component has to fulfill. But obviously there are non-functional requirements as well that must be considered. Within different usage scenarios there are dif- ferent requirements regarding adequate viewing technolo- gies. The main alternatives here are web-based and pro- prietary solutions. The final desicion depends on several parameters of the intended usage scenario. Among them are security concerns in distributed environments, available network resources, decision about thin or thick client solu- tion, and corporate IT strategy.
Another non-functional requirement is maintainability that includes several aspects: Firstly, the roll-out must not require further software installation (what militates for a web-based solution using Java and SVG). Secondly, main- tainability must be ensured during daily business and in case of adding new processes, visualization forms, or users by minimizing the needed manual interventions. One im- portant point is the robustness of the resulting system. It must comply certain quality of service level agreements regarding availibility. Since users are not willing to wait more than a few seconds for the redrawing of a process di- agramm, performance is crucial for the usability. Similarly, for real-time monitoring of processes performance is very
important. General usability and ergonomics of the mon- itoring application are of great significance for the accep- tance by the end users and are therefore a matter of concern that should not be disregarded.
4. Architecture
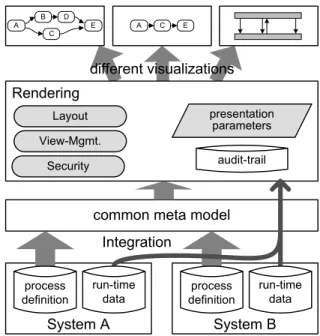
In this section we sketch the main components of an ar- chitecture needed for providing process visualization sup- port as described before (cf. Fig. 6).
The first step towards a system-spanning process visual- ization is the integration of process data. As far as possible, in our approach this is realized by an automated mapping of the meta model of the underlying systems to the meta model used by our visualization. Due to the different for- mats and modeling paradigms however, we cannot always avoid manual interventions especially when dealing with human processes (Scenario 4), where there is no modeled process schema at all.
The process meta model we use for visualization pur- poses follows goals like simplicity, completeness, unambi- guity, and extensibility. Since we want to integrate process models from different source systems, our main objective has been put on generality and not on the provision of a complete formal operational semantics. The fact that we only want to visualize processes and not execute them, does not demand such an operational semantics. What has come out is a meta model derived from XPDL [15] but enriched by divers process elements. Many nodes and elements have
Integration
common meta model
System A
process definition
System B
process definition run-time
data
run-time data Layout
Security View-Mgmt.
presentation parameters
Rendering
audit-trail
F D B
C
A E G message message
company A
company B
different visualizations
D B
C
A E A C E
Figure 6. Architecture of Visualization Component
been replenished with type or category attributes that allow further differentiation when drawing those elements. For example control flow edges can be subdivided in normal control flow edges, jump forward edges, or loop backward edges.
Based on the common meta model the rendering com- ponent is in charge of generating the process drawings. It consists of several subcomponents. The view management is responsible for logically restructuring the process data according to the desired view the respective user shall have or wants to have on the process. The calculation of the geo- metric arrangement of the graphical elements is the task of the layout component. Due to the expected computational complexity the realization can take place in different ways;
as far as possible the layout is automatically determined.
However in some cases, manual interaction will become necessary (semi-automatic layout). What we definitely try to avoid is an entirely manual generation of drawings. Due to the huge number of different visualizations this approach is almost infeasible. Security issues (cf. Section 3.4) are handled by the security component.
One big issue is the administration of the different draw- ing configurations. We need an appropriate approach for the administration of the visualization parameters. A com- bination of user-specific, role-specific, presentation-form- specific, and process-specific parameters must be applied to cope with the needs of a adoptable, user-specific visual- ization.
5. Summary and Outlook
Visualization of system-spanning processes in a user- friendly way is a complex task. In this paper we have dis- cussed the requirements of a flexible and dynamic visual- ization component. Due to lack of space we have focussed on the discussion of requirements, and omitted realization details in this paper. Nevertheless, a powerful prototype has already been implemented.
Until now we have developed a meta model as de- scribed in Section 4. Current work is about the specifica- tion and implementation of the view concept. Simultane- ously we give attention to graph layout algorithms suitable for process graphs. Future work will address security issues in process visualization components. Equally we will give attention to the administration of configuration parameters for the divers visualization forms.
This paper has focussed on monitoring process instances but our approach also covers the visualization of static process schemes. The overall vision of our work aims at providing a flexible and adaptable component for a user- specific and user-friendly visualization of all kind of infor- mation inherent to complex business processes.
Acknowledgements
This work is funded by DaimlerChrysler Research &
Technology.
References
[1] T. Bauer. Visualization of Running Processes. InProc. In- formatik 2004, Workshop Process-oriented Business Archi- tectures, Ulm, Germany, 2004. (in German).
[2] Gartner. The BPA Market catches another Major Updraft.
Gartners Application Development and Maintenance Re- search Note, M-16-8153, 2002.
[3] IBM.IBM WBI Monitor V. 4.2.3, 2003. IBM Report.
[4] IDS Scheer AG. ARIS Process Performance Manager (PPM). White Paper, 2004.
[5] J. Jordan, U. Kleinhans, O. Kulendik, J. Porscha, A. Pross, and R. Siebert. Transparent and Flexible Cross- Organizational Workflows for Engineering Cooperations in Vehicle Development. InProc. PDT Europe, Torino, 2002.
[6] J. W. Koolwaaij, P. Fennema, and D. van Leeuwen. SVG for Process Visualization. In2nd Ann. Conf. on Scalable Vector Graphics (SVG Open 2003), Vancouver, 2003.
[7] F. Leymann and D. Roller.Production Workflow - Concepts and Techniques. Prentice Hall, 2000.
[8] P. O. Luttighuis, M. Lankhorst, R. van de Wetering, R. Bal, and H. van den Berg. Visualising Business Processes.Com- puter Languages, 27, 2001.
[9] J. Mendling, A. Brabenetz, and G. Neumann. EPML2SVG - Generating Websites from EPML Processes. InProc. of the 3rd GI Workshop on Event-Driven Process Chains (EPK 2004), Luxembourg, 2004.
[10] S. Rinderle, M. Reichert, and P. Dadam. Flexible support of team processes by adaptive workflow systems. Distributed and Parallel Databases, 16(1):91–116, 2004.
[11] J. M. Six and I. G. Tollis. Automated Visualization of Process Diagrams. InProc. 9th Int. Symp. on Graph Draw- ing (GD ’01), Vienna, Austria, 2001.
[12] W. M. P. van der Aalst and A. J. M. M. Weijters. Process Mining: A Research Agenda. Comp. in Industry, 53(3), 2004.
[13] W. M. P. van der Aalst and M. Weske. The P2P Approach to Interorganizational Workflows. InProc. 13th Int. Conf.
on Advanced Information Systems Engineering (CAiSE’01), Interlaken, Switzerland, 2001.
[14] Workflow Management Coalition. Terminology and Glos- sary. Technical Report WFMC-TC-1011, 1999.
[15] Workflow Management Coalition. Workflow Process Defin- ition Interface - XML Process Definition Language (XPDL).
WfMC Specification WFMC-TC-1025, 2002. Version 1.0.
[16] Y. Yang, W. Lai, J. Shen, X. Huang, J. Yan, and L. Setiawan.
Effective Visualisation of Workflow Enactment. InProc. of 6th Asia Pacific Web Conf. (APWEB’04), 2004.