Marc SCHÄFER, Rhodes & Sindisiwe HERBERT, Rhodes
The visualisation of linear expressions – Introduction and visualization
The appropriate conceptual teaching of any mathematical concept invariably involves some kind of visualisation process in the act of teaching. In recent decades, there has been a resurgence in the recognition that visualisation is an important element in the teaching and learning process of mathematics.
Campbell, Collis, and Watson (1995), claim that
“there is increasing recognition that intuitive and imagery-based processes play an important role in all levels of mathematical problem solving from those of the child in the early stages of mathematical development ... to the novel creations of highly gifted mathematicians and scientists” (S. 177).
We argue that it is thus incumbent on any teacher to recognize this and adopt a teaching approach that embraces visualisation as a key element in the con- ceptual unfolding of mathematical concepts. The visualisation artefact may consist of a diagram, a rough sketch, a graph, an image on the computer screen, a mere scribble or doodle on a piece of paper or on the chalkboard, or just an image in the mind. Arcavi’s (2003) definition very eloquently cap- tures this by suggesting that visualisation is:
“the ability, the process and the product of creation, interpretation, use of and reflection upon pictures, images, diagrams, in our minds, on paper, or with technological tools, with the purpose of depicting and communicating infor- mation, thinking about and developing previously unknown ideas and ad- vancing understandings” (S. 217).
Whatever form of visualisation is used, we recognise and agree with Presmeg that to be truly constructive, visual methods of learning and teaching must be coupled with “rigorous analytical thought” (Nardi, 2014, S. 213). Because of this, our attention turned to the teaching of algebra, which is inherently abstract and lends itself to analytical thinking.
Algebra and visualisation – the study
The teaching of algebra poses interesting challenges to many teachers, as the conceptual foundations of algebraic concepts are not inherently visual – in- stead, they are abstract and often remain invisible to both the learner and the teacher. Where algebraic concepts are taught using a visual modality, it is often restricted to attaching an algebraic expression to a sequential pattern that is provided (in the form of an interesting sequence using matchsticks, say), or drawing a graph given a specific equation. The aim of our study was
Siller, H.-S., Weigel, W. & W¨orler, J. F. (Hrsg.).Beitr¨age zum Mathematikunterricht 2020. M¨unster: WTM-Verlag, 2020.
doi: 10.37626/GA9783959871402.0 797
to extend this practice a little and encourage selected Grade 9 learners to be creative and devise their own visual(s) to depict given linear algebraic ex- pressions.
The theoretical foundation of this study rests in Radford’s theory of knowledge objectification (Radford, 2008) which advocates that knowledge exists neither outside of the human whose task is merely to discover it (as proposed by realism), nor uniquely in the mind of each individual person (as proposed by constructivism), but is instead shared between people. Mathe- matics is thus seen as a human construct, and mathematical objects are un- derstood as “fixed patterns of reflexive human activity incrusted in ... social practice [and] mediated by artefacts” (Radford, 2008, S. 222). This suited our study well as it involved our participants working in small groups con- stantly engaging with each other, collaboratively conjecturing possible solu- tions and reflecting on proposed ideas and suggestions, until a consensus so- lution was reached. Our small groups were all given sets of different col- oured building cubes with which they were asked to create a visual object that depicted a given linear expression such as 4𝑥𝑥 − 3 . We used building cubes as they were readily available, and their use provided a consistent me- dium for each group to work with.
The study also relies on Peircean semiotics (Presmeg, 2006). We argue that mathematical objects or concepts can only be accessed by using signs. For example, a group of four blocks can be used to signify the quantity four. The quantity can also be represented by the numeral 4, but neither sign is the object itself – the object is strictly conceptual. Semiotics is thus an inescap- able part of any attempt to study mathematics or mathematical education. In their attempt to create their own visual representations of the linear expres- sion 4𝑥𝑥 − 3 , our groups thus engaged in a semiotic process that resulted in an object they could own. By this process, objectification (the process of knowing) produces subjectification (the process of becoming).
Our qualitative case study involved six pairs of Grade 9 learners who all participated in a weekly after-school mathematics club and sought to answer the following research questions:
What aspects of linear algebraic expressions were participants able to repre- sent visually?
In what ways did the visualisations develop over the course of the club, both within and between groups?
798
Some findings
The scope of this paper only allows for a very truncated vignette of one group’s solution to creating a visual for the expression 4𝑥𝑥 – 3 . Data was generated through four club sessions and a final task-based interview with each group. For analysis purposes, all visualisations were photographed, and the interviews were video recorded. Each group thus produced five visuali- sations of different linear expressions over the course of several weeks. Here is a small extract of the analysis of Pair B’s workings during their interview (note that the names given are pseudonyms):
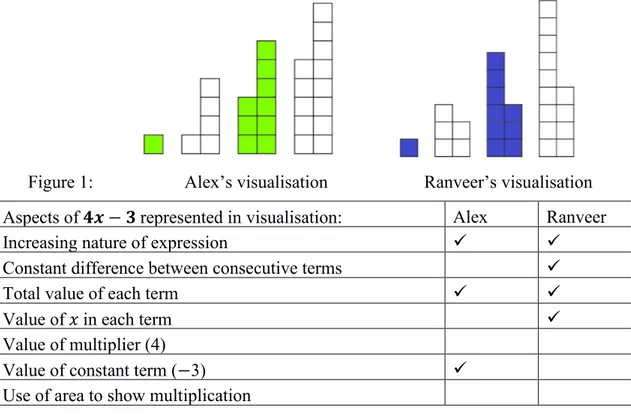
As they began building their representation, they first substituted 1, 2, 3 and 4 into the expression and made towers of 1, 5, 9 and 13. Assuming they were not finished, I asked, “How do you want to put it together?” Alex took Term 3 and put it together as in Figure 1 below. He explained that the difference of three between the two columns showed the subtraction of three in the ex- pression. However, Ranveer had noticed something different – that Alex’s first column had three blocks, which corresponded to the term number. They disagreed on how the visualisation should be built until I suggested that Ran- veer build a separate representation so that we could see and compare them both. The resulting representations are shown in Figure 1 below. Each term in Alex’s representation has a difference of three between the columns. Ran- veer’s representation shows the term number with the right-hand column of each term.
Figure 1: Alex’s visualisation Ranveer’s visualisation Aspects of 𝟒𝟒𝟒𝟒 − 𝟑𝟑 represented in visualisation: Alex Ranveer
Increasing nature of expression
Constant difference between consecutive terms
Total value of each term
Value of 𝑥𝑥 in each term
Value of multiplier (4)
Value of constant term (−3)
Use of area to show multiplication
Table 1: Aspects of 4x−3 represented in Alex and Ranveer’s visualisations
799
Table 1 above summarises various aspects of the linear expression that were and were not represented in Alex and Ranveer’s visualisations. As presented here, neither visualisation clearly indicates the constant differences between consecutive terms. However, later in the interview Ranveer stacked his terms behind one another to show that each term had four more blocks than the previous one.
It is beyond the scope of this paper to provide all the groups’ visualisation attempts. The visualisations came in all shapes and sizes, making use of spi- rals, towers, rectangles and other shapes. By the time of the interview, most pairs had settled on a “visual expression” that showed each part of the alge- bra (4, 𝑥𝑥 , − 3 and the total term value) with different coloured cubes.
Conclusion
The visualisations created by Pair B show that the participants in this re- search were able to represent many aspects of linear algebraic expressions visually. The list of diverse linear expressions that we gave the groups ena- bled us to establish patterns of visualisations, some peculiar to each group and others common to many groups. The analysis of this will serve to answer the second research question and is beyond the scope of this paper but will be illustrated in the presentation.
References
Arcavi, A. (2003). The role of visual representations in the learning of mathematics. Edu- cational studies in mathematics, 52 (3), 215–241.
Campbell, K. J., Collis, K. F. & Watson, J. M. (1995). Visual processing during mathe- matical problem solving. Educational Studies in Mathematics, 28 (2), 177–194.
Duval, R. (1999). Representation, Vision and Visualization: Cognitive Functions in Ma- thematical Thinking. Basic Issues for Learning.
Nardi, E. (2014). Reactions on visualization in mathematics and in mathematics educa- tion. In M. N. Fried & T. Dreyfus (Hrsg.), Mathematics & mathematics education:
Searching for common ground (pp. 193–220). Dordrecht: Springer.
Presmeg, N. (2006). A semiotic view of the role of imagery and inscriptions in mathe- matics teaching and learning. In Proceedings of the 30th conference of the internatio- nal group for the psychology of mathematics education (Vol. 1, S. 19–34).
Radford, L. (2008). The ethics of being and knowing: Towards a cultural theory of learn- ing. In Semiotics in mathematics education: Epistemology, history, classroom and cul- ture (S. 215–234).
800