RESEARCH ARTICLE
10.1002/2017GC007234
The Effect of Arc Proximity on Hydrothermal Activity Along Spreading Centers: New Evidence From the Mariana Back Arc (12.78N–18.38N)
Edward T. Baker1 , Sharon L. Walker2 , Joseph A. Resing1 , William W. Chadwick Jr.3 , Susan G. Merle3 , Melissa O. Anderson4 , David A. Butterfield1 , Nathan J. Buck1 , and Susanna Michael5
1Joint Institution for the Study of the Atmosphere and Ocean, University of Washington and NOAA/Pacific Marine Environmental Laboratory, Seattle, WA, USA,2NOAA/Pacific Marine Environmental Laboratory, Seattle, WA, USA,3Oregon State University and NOAA/Pacific Marine Environmental Laboratory, Hatfield Marine Science Center, Newport, OR, USA,
4GEOMAR, Helmholtz Centre for Ocean Research, Kiel, Germany and Department of Earth Sciences, University of Ottawa, Ottawa, ON, Canada,5School of Oceanography, University of Washington, Seattle, WA, USA
Abstract
Back-arc spreading centers (BASCs) form a distinct class of ocean spreading ridgesdistinguished by steep along-axis gradients in spreading rate and by additional magma supplied through subduction. These characteristics can affect the population and distribution of hydrothermal activity on BASCs compared to mid-ocean ridges (MORs). To investigate this hypothesis, we comprehensively explored 600 km of the southern half of the Mariana BASC. We used water column mapping and seafloor imaging to identify 19 active vent sites, an increase of 13 over the current listing in the InterRidge Database (IRDB), on the bathymetric highs of 7 of the 11 segments. We identified both high and low (i.e., characterized by a weak or negligible particle plume) temperature discharge occurring on segment types spanning dominantly magmatic to dominantly tectonic. Active sites are concentrated on the two southernmost segments, where distance to the adjacent arc is shortest (<40 km), spreading rate is highest (>48 mm/yr), and tectonic exten- sion is pervasive. Re-examination of hydrothermal data from other BASCs supports the generalization that hydrothermal site density increases on segments<90 km from an adjacent arc. Although exploration quality varies greatly among BASCs, present data suggest that, for a given spreading rate, the mean spatial density of hydrothermal activity varies little between MORs and BASCs. The present global database, however, may be misleading. On both BASCs and MORs, the spatial density of hydrothermal sites mapped by high-quality water-column surveys is 2–7 times greater than predicted by the existing IRDB trend of site density versus spreading rate.
1. Introduction
Back-arc spreading centers (BASCs) total11,000 km in length (Beaulieu et al., 2015) and form a distinct class of ocean spreading centers because of their location over a subducting plate. Water from the subducting slab fertil- izes the mantle and enhances the supply of melt to a volcanic arc (Tatsumi & Eggins, 1995). Kelley et al. (2006), for example, found for several back arcs that the concentration of water increases systematically toward the vol- canic front. Moreover, whereas water is a relatively passive participant in adiabatic melt generation beneath mid-ocean ridges, in the back arc and arc environment it becomes an active fluxing agent that helps drive melt generation. This enhancement causes the magmatic budget of some BASC sections to increase beyond that expected from spreading rate alone (e.g., Martinez & Taylor, 2003; Pearce et al., 1994; Sleeper et al., 2016). Fur- ther, magma supply may be augmented where BASC-arc separation is small and extensional stress in the thin separating lithosphere broadly distributes rising magma, permitting capture of some magma by the BASC (Brounce et al., 2016; Stern et al., 2013). As the kinematics of back-arc opening are often (but not always: see Ribeiro et al., 2017) driven by trench rollback rather than Eulerian rigid plate rotation, the along-axis gradient of spreading rate on some BASCs greatly exceeds typical values for mid-ocean ridges (MORs), leading to a corre- spondingly strong gradient in magmatic budget and morphology (e.g., Martinez & Taylor, 2003). These charac- teristics strongly influence crustal properties such as porosity and permeability (e.g., Dunn & Martinez, 2011), and thus perhaps the chemical character and distribution of BASC hydrothermal systems.
Key Points:
Exploration of 600 km of the southern Mariana back arc found 19 active vent sites, 13 more than in the authoritative InterRidge Database
Back-arc ridges with high-quality hydrothermal surveys and an adjacent volcanic arc exhibit the highest spatial density of vent sites
Vent site spatial density is highest where arc proximity (<90 km) results in enhanced magma supply to the back-arc ridge
Supporting Information:
Supporting Information S1
Table S1
Data Set S1
Data Set S2
Data Set S3
Data Set S4
Data Set S5
Correspondence to:
E. T. Baker,
edward.baker@noaa.gov
Citation:
Baker, E. T., Walker, S. L., Resing, J. A., Chadwick, W. W., Merle, S. G., Anderson, M. O.,. . .Michael, S. (2017).
The effect of arc proximity on hydrothermal activity along spreading centers: New evidence from the Mariana back arc (12.78N–18.38N).
Geochemistry, Geophysics, Geosystems, 18, 4211–4228. https://doi.org/10.
1002/2017GC007234
Received 12 SEP 2017 Accepted 27 OCT 2017
Accepted article online 2 NOV 2017 Published online 30 NOV 2017
VC2017. The Authors.
This is an open access article under the terms of the Creative Commons Attribution-NonCommercial-NoDerivs License, which permits use and distribution in any medium, provided the original work is properly cited, the use is non-commercial and no modifications or adaptations are made.
Geochemistry, Geophysics, Geosystems
PUBLICATIONS
Vent discovery on the Mariana back arc began early, but systematic exploration has since languished.
Robust plumes of CH4 (up to 72 31026cm3STP/kg), but with a surprisingly slight anomaly in d3He%
(0.8%), were discovered near 18.28N in 1982 (Horibe et al., 1986). A series ofAlvindives in 1987 found two fields in that area and an additional field 20 km farther south near 18.058N (Campbell et al., 1987; Hessler &
Lonsdale, 1991). The first along-axis surveys, using hydrographic and optical sensors on a deep-tow camera between 12.938N and 13.128N, occurred in 1999 and discovered active vent fields in the vicinity of 13.18N (Mitsuzawa et al., 2000). A more extensive survey was conducted in 2003 along the magmatically inflated southernmost segment (now known as the Malaguana-Gadao Ridge), 12.678N–13.258N, identifying at least nine distinct fields (based on a reanalysis of the data reported in Baker et al., 2005).
We revisited the Mariana BASC in November/December 2015 to conduct a comprehensive hydrothermal survey of its southern half (12.98N–18.38N) (Figure 1) and further our understanding of hydrothermal activity on BASCs. Here we describe a series of water-column surveys, using both ship-towed and Autonomous Underwater Vehicle (AUV)-mounted sensors, to identify active hydrothermal sites. We then assess the effect of survey quality on detecting the spatial frequency of hydrothermal sites among many BASCs, and the effect of arc proximity on creating hydrothermal sites. We also compare the known spatial frequency of venting on BASCs to a diverse set of MOR sections.
2. Geological Settings
2.1. Mariana Back-Arc Spreading Center
The Mariana BASC is an arcuate spreading ridge that echoes the shape of the adjacent volcanic and rem- nant arcs. Anderson et al. (2017) described the geologic setting of the southern Mariana BASC and refined the spreading axis location, based on a new bathymetric data set. Along its southern half, spreading rates decrease monotonically from 56 mm/yr at 11.68N to 29 mm/yr at 18.38N (Bird, 2003; Kato et al., 2003) (Figure 2). The active volcanic arc approaches within10 km of the ridge south of 138N, increasing to a separation Figure 1.(a) Bathymetry of the Mariana subduction system. Red line marks the path of the Mariana BASC. Segments south of 13.28N are now termed the Malaguana-Gadao Ridge. (b) Individual segments of the southern Mariana BASC, named according to the latitude of the segment center (see text). The classification of high-temperature and low- temperature vents is described in Table 2.
of 70 km at 148N, and reaching a maximum of110 km at 188N (Martinez & Taylor, 2003). South of 13.678N, axial depths are 2,800–3,500 m and the morphology of the Malaguana-Gadao Ridge resembles an intermediate-rate spreading ridge, with the shallowest and most inflated portion found between 12.878N and 13.18N. North of 148N, the axis deepens to3,300–5,000 m and the bathymetry takes on a slow spread- ing, alternating basin-and-high ridge morphology with deep axial valleys. Segmentation is defined by off- sets ranging from large (31–42 km) shear-zone offsets to small deviations in axial linearity. Seven deep (mean54,8006240 m) basins separate eight magmatic highs (mean53,6606260 m) formed by volcanic construction (Anderson et al., 2017). The 11 segments of the southern Mariana BASC are arrayed en echelon, offset to the right except for a left offset of the northernmost one (Figure 1b). We follow Anderson et al.
(2017) and identify each segment using the latitude value close to its center: 12.88N, 13.38N, 13.98N, 14.58N, 15.18N, 15.58N, 16.18N, 16.58N, 17.08N, 17.88N, and 18.28N.
Anderson et al. (2017) describe four segment types. Magmatic segments (M; 12.88N, 13.38N) feature signifi- cant axial volcanic highs (500 m relief) with smooth volcanic terrain. These occur exclusively at the south- ern end of the ridge where the spreading rate is highest. Magmatic segments currently undergoing tectonic extension (MfiT; 16.58N, 17.08N) exhibit an hourglass segment morphology (focused magmatism at the segment center), moderate axial valleys (500 m relief), and smooth to hummocky terrain at the seg- ment centers. Tectonic segments (T; 13.98N, 14.58N, 15.18N, 16.18N, 17.88N) are characterized by deeper axial valleys (800–1,250 m relief), low axial volcanic ridges (<450 m relief) with central grabens, and abundant faulting within the axial valley. Tectonic segments currently undergoing magmatic extension (T fi M;
15.58N, 18.28N) feature axial volcanic highs (500–550 m) that lack deep valleys, abundant smooth volcanic terrain, and widespread faulting along the segment center.
2.2. Other Back-Arc Spreading Centers
Eight BASCs with known or inferred (from water column plumes) vent sites and appreciable exploration are listed in the InterRidge Database (IRDB; https://vents-data.interridge.org) (Table 1). Seven are undergoing documented spreading (Mariana, Martinez & Taylor, 2003; North Fiji, Auzende et al., 1994; East Scotia, Liver- more, 2003; Manus, Martinez & Taylor, 2003; Lau Parson et al., 1990; Woodlark, Taylor et al., 1995; and Oki- nawa Trough, Letouzey & Kimura, 1986), whereas one (Bransfield Strait) is rifting but may contain incipient oceanic crust (Gonzalez-Casado et al., 2000; Lawver et al., 1996). Bransfield Strait does host hydrothermal Figure 2.Along-strike section of the Mariana BASC, 12.68N–18.78N. The 11 identified sections (see text for details) are indi- cated by alternating gray and black axial profiles. Overlaid axis colors mark sections surveyed by conductivity-
temperature-depth (CTD) tow-yos (green) orSentryplume survey dives (yo-yos) (cyan). Vertical purple lines near 13.18N mark vertical CTD casts. We identify hydrothermal sites as: previously known and listed in the IRDB (solid red triangles, though note that Archaean and Pika (lowermost two triangles near 138N) and Alice Springs and Burke (near 18.28N) are both considered single sites in the IRDB); discovered in 2015 and located by 2015Sentryor 2016 ROV (Butterfield et al., 2017) (solid red dots); or inferred from 2003 or 2015 plumes (open red circles).
venting so we include it for completeness. Not included are the Havre Trough and Izu-Bonin, poorly sur- veyed and thought to be rifting rather than spreading, and the relatively short Andaman, New Hebrides, Taupo, and Tyrrhenian BASCs where exploration has been insufficient for making useful comparisons.
3. Methods
We employed a SeaBird 911plus conductivity-temperature-depth (CTD) package with optical light- backscattering and chemical (oxidation-reduction potential (ORP)) sensors using both a standard ship (R/V Falkor, cruise FK151121) tow-yo and a ‘‘yo-yo’’ along-axis sawtooth pattern by the AUVSentry. Vertical excur- sions above bottom for the ship-deployed CTD ranged from300 to 500 m, depending on terrain, and somewhat less forSentry. Our coverage of the water column overlying the Mariana BASC includes 12 CTD tows (260 km of axial length) (supporting information Data Set S1) and twoSentrymissions in 2015 (dives 364–365 covering 77 km) (supporting information Data Set S2), a CTD tow (12.678N–13.28N; R/VThomas G.
Thompsoncruise TN153) in 2003 (Baker et al., 2005) (87 km of axial length), and a series of seven closely spaced (5 km) vertical CTD casts (13.1388N–13.4318N; R/VOkeanos Explorer, cruise INDEX 2010, supporting information Data Set S3) in 2010 (arrayed over 25 km of axial length) positioned between the 2003 and 2015 surveys (Figure 2). With limited shiptime in 2015, we prioritized surveying the portions of the ridge where previous experience and theory holds that hydrothermal activity is most likely. Because magmatism is concentrated near the segment centers (Anderson et al., 2017), we assume that hydrothermal activity is most abundant where the ridge is inflated or expresses bathymetric highs. Our surveys fully encompass bothMsegments and lengthy portions of the bathymetric highs of the remaining segments (except for a short length at the northern end of our study area), totaling 440 km of a total 600 km axial length. This sur- vey plan results in a conservative estimate of the spatial density of venting,Fs, the number of detected active vent sites per 100 km of surveyed axis (600 km for the Mariana BASC). Additional venting in the deep valleys would increaseFs. We consider multiple vent sites, or plume anomalies, within1 km as a single site.
The light-backscattering sensor (measuring nondimensional Nephelometric Turbidity Units (NTU), American Public Health Association, 1985) detects particle-rich discharge, generally at temperatures>100 C8, with copious ‘‘black smoker’’ or sulfur-rich minerals that create plumes extending many kilometers from their source. The notationDNTU indicates the NTU value (0–5 V range on the sensor) above the local ambient water. The ORP sensor detects hydrothermal discharge at all temperatures. It responds immediately to the
Table 1
Survey Characteristics of Back-Arc Spreading Centersa
BASCs
Total length (km)
Survey length (km)
Sitesb Spreading rate (mm/yr)c
No. per 100 km Mean Std. Dev. % Surv. Survey typed Adjacent Active Arc
Mariana (2003) 1,300 65 6 9.2 45 8 5 1*
Mariana (2015) 1,300 600 19 3.2 41 7 46 1*
N Fiji 2,635 685 7 1.0 37 27 26 2/3
East Scotia 600 204 3 1.5 68 6 34 1
Laua 855 807 124 14.5 60 32 96 1*
Manus 365 314 11 3.5 69 40 86 1*
Okinawa Trough 1,066 53 12 22.5 40 5 1
No Adjacent Active Arc
Bransfield Strait 530 435 4 0.9 7 3 82 2
Woodlark 549 500 3 0.6 31 5 91 2
aEastern Lau Spreading Center, Fonualei Rift and Spreading Center, Mangatolo Triple Junction, North East Lau Spreading Center.
bSites listed in the InterRidge Database and detected sites/100 km of surveyed length (Fs); values in bold are revised in this paper (see text and supporting information).
cDivergent component of relative plate velocity (Bird, 2003). Only one data point for southern Okinawa Trough.
dConsidering only the surveyed section of each ridge. 1*5densely surveyed w/ORP; 15densely surveyed;
25moderately surveyed; 35poorly surveyed.
presence of even nanomolar concentrations of reduced hydrothermal chemicals (e.g., Fe21, HS2, H2) with a sharp decrease in potential values (E(mV)), followed by a much slower recovery (Walker et al., 2007). These plume chemicals are out of equilibrium with the oxidizing ocean (Resing et al., 2009) and rapidly oxidize or metabolize close to their seafloor source, so an ORP response implies a source roughly within 1 km of the sensor (Baker et al., 2016). Abrupt decreases inEas small as 0.5 mV can indicate a hydrothermal plume.
We calculate the hydrothermal temperature anomaly (Dh) in a neutrally buoyant plume from the expression
Dh5h–ðm0– m1rhÞ
wherehis potential temperature,rhis potential density, and m0and m1are constants in a linear regression betweenhandrhin hydrothermally unaffected water around the plume (Lupton et al., 1985). We multiply the observedDhvalues by 2.9 based on the localh-salinity gradient and assuming the vent salinity is close to the salinity of ambient seawater (Baker et al., 2011; McDuff, 1995).
Beyond water column surveys, five additionalSentrydives (366–370) were devoted to near-bottom multi- beam mapping (grids at 70 m above bottom (mab)). Two of the dives included a few hours of bottom pho- tography (grids at 6 mab). We use ORP data to indicate where discharge is most likely along theSentry paths.
4. Distribution of Vent Sites on the Mariana Back-Arc Spreading Center
4.1. Magmatic (M) Segments
Segments 12.88N and 13.38N have been previously explored for hydrothermal activity. In addition to plume surveys (Baker et al., 2005; Mitsuzawa et al., 2000), the Remotely Operated Vehicle (ROV) JASON II discov- ered the Snail site (Wheat et al., 2003) in May 2003 only months after plume surveys (Baker et al., 2005) inferred its location. Subsequent submersible and ROV work (Ishibashi et al., 2004) found that Snail dis- charge temperature had declined from 2408C in May 2003 to 708C in March 2004. The same surveys discov- ered the high-temperature Archaean and Pika sites, 2 km and 5 km, respectively, east of the Snail area, and later the Urashima site near Pika (Nakamura et al., 2013).
At least nine active sites occur (or occurred) on these segments (Figure 3a). In May 2003, high-temperature fluids at the Snail, Archaean, and Pika/Urashima sites were generating intenseDNTU plumes, five sites were characterized by weak to negligibleDNTU anomalies (<0.01) but distinct to robust ORP anomalies, and one previously confirmed site (at 13.108N, Mitsuzawa et al., 2000) now identifiable only by a weakDhplume (Baker et al., 2005). A vertical CTD in 2010 at 13.1388N found weakDE(0.5 mV) andDNTU (0.003) anoma- lies at a depth of 2,730 m, similar to the plume observed there in 2003. In 2015, we repeated a short portion of the 2003 tow-yo along-axis at the latitude of the Snail/Archaean/Pika/Urashima vents (Figure 3b). The highestDEandDNTU plumes were found at the latitude of the Pika/Urashima site (12.9398N), whereas we detected only a weakDNTU plume at the Snail site (12.9538N), a plume that may have originated elsewhere given the lack of aDEsignal. This change is consistent with the precipitous decline in vent fluid temperature documented between May 2003 and March 2004 (Ishibashi et al., 2004) and continuing into 2012 when ROV measurements found 458C fluids discharging from Snail (Toki et al., 2015). However, temperatures at Snail rebounded to at least 1908C in 2014 (https://www.pmel.noaa.gov/eoi/marianas/SRoF-Ironman-2014- CruiseReport-withdivelogs.pdf). This variability may reflect sampling at different locations in the vicinity of the Snail vent field, or a remarkable temporal variability since its discovery. In either case, the source(s) of all on-axis plumes between the latitudes of the Pika/Urashima and Snail sites in 2003 and 2015 cannot be unequivocally determined from the plume data. Possibilities include Snail, Pika/Urashima (2808C fluids in 2010, Nakamura et al., 2013), Archaean, or an unknown on-axis site(s). We conservatively conclude that no undiscovered on-axis source existed in 2015.
4.2. Magmatic to Tectonic (MfiT) Segments
The summit of Segment 17.08N, the shallowest of all but the two southernMsegments, has a central axial valley created by a large split volcano (Anderson et al., 2017) (Figure 4). A CTD tow-yo mapped a particle- rich plume (DNTU>0.25) and the most intense ORP anomaly (DE 87 mV) seen in a neutrally buoyant plume during the cruise. Vertical water column profiles acquired during ROV dives in December 2016
(Butterfield & Shipboard Scientific Party, 2017) found plume characteristics similar to 2015 at this site.Sentry mapping/photo dive 370 observed a smooth and unfaulted floor, covered predominantly by high-effusive- rate sheet flows, unique among all the mapped segments, andSentryplume mapping located a venting area centered at 16.968N, 144.878E (Figure 4b). ROV dives in 2016, first on NOAA shipOkeanus Explorercruise EX1605-Leg 1 (http://oceanexplorer.noaa.gov/okeanos/explorations/ex1605/) and subsequently on R.V.Fal- kor(Butterfield & Shipboard Scientific Party, 2017) discovered the Hafa Adai site, with multiple high (2808–
3398C) and low (208C) temperature vent discharge spanning 300 m and centered at 16.9578N, 144.8688E, in the middle of theSentryplume anomalies (Figure 4b).
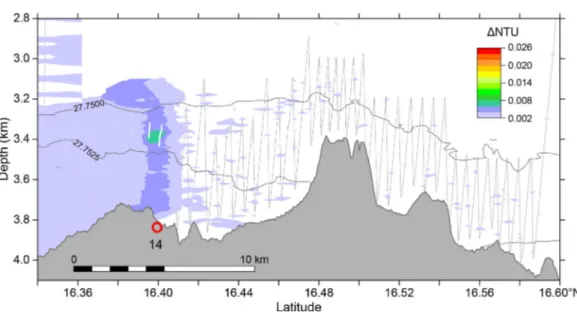
Segment 16.58N also has a prominent axial valley, but here the only detected venting site is south of an axial volcano (Figure 5). Two adjacent tow-yo cycles detected a plume400 mab with weak but distinct anomalies (DNTU0.004,DE1 mV) at 16.408N that occur nowhere else in the along-axis tow.
4.3. Tectonic (T) Segments
Tectonic segments are the most common but the least hydrothermally active of the four segment types.
Only over the bathymetric high of segment 14.58N did we observe a plume (Figure 6).Sentryyo-yo dive 365, perhaps a first-time accomplishment for any AUV, discovered a plume with weak NTU and ORP anoma- lies (DNTU0.008,DE4 mV)400 mab near 14.58N. A follow-up CTD tow-yo mapped presumably the same plume (DNTU0.006,DE1 mV), though1–2 km farther south. Since the CTD tow occurred2.5 days afterSentrydive 365, a different location for a small plume is consistent with our 1–2 km source resolu- tion and thus not surprising. The location of the seafloor source for this plume remains uncertain.Sentry dive 366, a mapping dive between 14.4868N and 14.5128N (Figure 6a) running a multibeam grid survey 70 mab with 100 m along-axis line spacing, found no NTU or ORP anomalies. Its thorough coverage (12 along- axis grid lines) indicates a lack of venting in its surveyed area. The presence of the CTD plume at the south- ern edge of theSentry365 plume (Figure 6b) makes an area south ofSentrydive 366 the most likely source Figure 3.Hydrothermal activity onMsegments 12.88N and 13.38N. Plumes are visualized by contouringDNTU values. Col- ored bars on the tow-yo path indicate the location and maximum intensity ofDEvalues along the tow lines. The same DNTU andDEcolor scales are used on all figures. Vent site symbols as in Figure 2, plotted at their latitude without regard for depth. Numbers at each site refer to Table 2. (a) Results from 2003 (Baker et al., 2005). Note the absence of significant DNTU anomalies at the 12.698N and 13.18N sites. We interpret theDNTU plume between 12.88N and 12.98N as a distal plume in the absence of anyDEanomaly. Pika and Archean sites are off-axis. Dashed vertical lines mark the 2015 studied area. (b) Results from 2015.
area. The presence of ORP anomalies in both mapped plumes makes it unlikely that the source lies on the valley walls, at least 6–9 km off-axis.
4.4. Tectonic to Magmatic (TfiM) Segments
The most surprising hydrothermal activity on the Mariana BASC occurred over a broad axial area south of the bathymetric high of segment 15.58N (Figure 7a). A weak but continuousDNTU (<0.005) plume filled the lowermost400–500 m of the water column along some 10 km of axis. ORP anomalies were robust Figure 4.Hydrothermal activity onMfiTsegment 17.08N. (a) Symbols as in Figure 2. Number at the site refers to Table 2. (b) Bathymetry and plume mapping results fromSentry370.DEvalues along theSentrypaths show hydrothermal plumes detected during both multibeam (widely spaced grid lines, 70 mab) and photo (closely spaced grid lines, 6 mab) surveys. Active vents and vent fauna were seen at multiple locations during the photo survey. The 2016 ROV survey (open blue box shows areal limits of the survey; most of the survey was conducted south of the blue dashed line) located multiple active sites (blue-outlined stars) in what is now termed the Hafa Adai vent field.
Figure 5.Hydrothermal activity onMfiTsegment 16.58N. Symbols as in Figure 2. Number at the site refers to Table 2.
DEanomalies were distinct in the plume (white lines) but less than the 1 mV lower limit of the standard color scale.
Figure 6.Hydrothermal activity onTsegment 14.58N. Symbols as in Figure 2. Number at the site refers to Table 2. (a) Plumes mapped bySentry365 yo-yo mapping. (b) Same area as mapped by CTD tow-yo. As in Figure 5,DEanomalies were distinct in the plume (white lines) but less than the 1 mV lower limit of the standard color scale.
and pervasive, suggesting widespread discharge of low-temperature fluids. The source of this plume was revealed bySentrydive 367, which discovered a new (<3 yr) lava flow that confirmed a recent eruption (Chadwick et al., 2017). We locate two vent fields based on the largest ORP anomalies. The southernmost field was confirmed at 15.4078N by a near-bottom photosurvey (6 mab) duringSentrydive 367 (Figure 7b).
ROV dives in 2016 near the northernmost site recorded distinct ORP anomalies near 15.4258N but observed Figure 7.Hydrothermal activity onTfiMsegment 15.58N. (a) Symbols as in Figure 2. Numbers at each site refer to Table 2. Yellow highlight on the bathymetry profile indicates areas of new lava. BifurcatedDNTU plume above the segment summit (site of the Perseverance field) likely illustrates distribution by variable local currents. The lack ofDEanomalies in the northern plume indicates that reduced hydrothermal chemicals have been largely oxidized so it is older than the southern plume. (b)Sentrydive 367 foundDEanomalies only near or over the lava flow (outlined in black). The ROV dives in 2016 (open blue box shows areal limits of the survey) observed no active vents, likely due to diminished hydrothermal flow from the cooling lava. (c)Sentrydive 369 over the segment high. Multiple 2016 ROV dives (open blue box shows areal limits of the survey) at the southern end of the segment high discovered the Perseverance field (blue-outlined stars).
OtherSentryDEanomalies along the grid paths point to possible undiscovered sites.
no active venting. However, a companion CTD vertical cast found plume evidence (DE5 mV), indicating that venting in this area remains active though weaker compared to December 2015 (Butterfield & Ship- board Scientific Party, 2017). Serial observations at other ocean spreading center eruption sites have found Figure 8.Hydrothermal activity onTfiMsegment 18.28N based on two separate CTD tow-yos. Symbols as in Figure 2.
Numbers at each site refer to Table 2. (a) Vents are Central Trough (CT), Burke (B), and Alice Springs/Ilium (AS) (Campbell et al., 1987; Hessler & Lonsdale, 1991). The CT location lies>1 km from the plume observed in 2015. This separation may be caused by plume advection, but more likely results from navigational uncertainties common in 1987. Orange contours above Burke show values of CH4(1026cm3STP/kg) in 1982 (Horibe et al., 1986). Note the absence ofDNTU above CT, AS, and the 18.18N site. (b)DEplume anomalies fromSentry368 agree closely with venting locations observed by ROV (blue- outlined stars; open blue boxes show areal limits of the surveys), suggesting that no other vent sites are present.
that heat flux can decay astime21, resulting in lifetimes of a few years or less for some vent sites that are not supported by a long-term heat source (Baker et al., 1998, 2004).
A CTD tow-yo and Sentry plume data collected during dive 369 (70 m altitude) found abundant plume evi- dence for a high-temperature field between 15.4808and 15.5078N (Figure 7a). ROV dives in 2016 confirmed a site at 15.4808N, 144.5088E, now called Perseverance vent field (Butterfield & Shipboard Scientific Party, 2017) (Figure 7c). The location of the 2015 CTD-tow plumes and the presence of otherSentry-mapped plume anomalies at 70 mab suggest other activity on the segment high, but there is presently insufficient evidence to confirm locations.
On segment 18.28N, three active sites (Central Trough, Burke, and Alice Springs/Ilium) were discovered during Alvin dives in 1987, close to the peaks of two bathymetric highs along this segment (Figure 8a). All three were apparently ‘‘high-temperature’’ in 1987 (Campbell et al., 1987; Hessler & Lonsdale, 1991), and Ishibashi et al.
(2015) reported temperatures >2678C at Alice Springs/Illium in 1996. However, all authors note that the observed discharging fluids were ‘‘clear,’’ not black smoke. In 2015, distinct NTU and ORP signals were found above Burke whereas only small ORP anomalies characterized the plumes above Central Trough, Alice Springs/Illium, and a newly discovered site at 18.108N (Figure 8a). Sentry dive 368 located near-bottom plume anomalies that confirmed venting at Burke and Alice Springs/Illium (Figure 8b). A CTD tow-yo recorded signifi- cant ORP anomalies (DE215 mV) and relatively weakDNTU values (<0.01) in plumes 600 m above Burke.
A vertical cast directly over the site passed through a 150 m thick bottom layer of buoyantly rising plume (density inversions up to 0.073 kg/m3, equivalent to a water depth of2,000 m at this location) and recorded exceptionally highDNTU (0.32),DE(150 mV), andDh(0.368) within the bottom 25 m. Elemental concentra- tions in eight water samples from the bottom 150 m ranged from 73 to 450 nmol/L of total dissolvable Fe (TDFe). TDFe/heat ratios (0.04 to 0.36 nmol/J) were 10–100 times higher than vent fluids sampled at Burke in 2016. The 2016 ROV dives found extinct chimneys and low-temperature (<518C) milky fluids (Butterfield &
Shipboard Scientific Party, 2017), as mentioned in all earlier reports, but no sign of the kind of discharge sam- pled by the 2015 cast and typically associated with high-temperature, metal-rich discharge.
A comparison of the 2015 plumes with the 1982 methane plumes mapped only with bottle samples from six casts (Horibe et al., 1986) shows that buoyancy flux from a source near the Burke/Alice Springs/Illium site is similar to that observed 33 years ago (Figure 8a). ROV dives at Alice Springs in 2016 (Butterfield & Ship- board Scientific Party, 2017) found high-temperature (1648C) flow, still discharging clear or milky fluid as in 1987. The strong agreement betweenSentry-locatedand ROV-located sites implies that no other active sites occur in the area surveyed bySentry368 (Figure 8b).
5. Discussion
We explain below how enhanced hydrothermal site density on the arc-proximal Malaguana-Gadao Ridge, relative to the other nine segments of the southern Mariana back arc, could result from geologic forcing and becomes apparent only with high-quality survey techniques. We also show that a similar pattern is apparent on arc-proximal segments of the Manus and Lau BASCs.
5.1. Vent Site Summary
Combining the results of all surveys conducted along 600 km of the southern Mariana BASC we find evi- dence for 19 separate vent sites, listed in Table 2, resulting in anFs53.2 sites/100 km. We add 13 new sites to the six already listed in the IRDB (the IRDB does not list Archaean or Burke). Nine occur on the 170 km of the twoMsegments of the Malaguana-Gadao Ridge; 10 occur on the bathymetric high of five other seg- ments, including all other segment types (T, MfiT, TfiM) (Table 3). Of the 19 sites, only six clearly vent high-temperature fluids, based on plume values (DNTU>0.01, high TDFe/heat) or vent fluid measurements (e.g., Alice Springs). Three others almost certainly vent low-temperature fluids, as no NTU anomalies are apparent and plumeDhwas either undetectable (sites 16, 17) or<0.028C (site 1). We classify the 10 other sites (including the possibly extinct site 7 and site 6 (Snail)) as low-temperature, based on observing only plumes with weakDNTU. Even though some of these sites emit plumes with rise heights (380–750 m) (Figures 5–8) that are commonly associated with high-temperature fluids emitted from typical MOR depths (2,000–3,000 m), the extremely low vertical density gradient (e.g., dq/dz 6.6 3 1026 kg/m4 below 3,000 m) in the Mariana bottom waters north of138N (and in all similarly deep water in the ocean) allows
substantial plume rise even for weakly venting sites (Table 2). For example, using the model of Lavelle et al.
(2013), Baker et al. (2016) calculated plume rise heights of no more than100–200 m for low-temperature diffuse sites measured as 10 MW over a 20 m320 m area at 1700 m near 378N on the Mid-Atlantic Ridge (dq/dz1.531024kg/m4) (Barreyre et al., 2014) and 40 MW over a 5 m35 m area at 2,550 m on the East Pacific Rise (dq/dz1.831025kg/m4) (Ramondenc et al., 2006), respectively (we know of no field data to compare with these model results). Fields of similar heat flux and area, deeper than3,000 m on the Mariana BASC, could rise 400 m (at 10 MW) to 600 m (at 40 MW). Thus, we provisionally classify sites with lowDNTU at depths>3,000 m (sites 10–12, and 14) as low-temperature, pending seafloor observations or more information (e.g., plume chemistry).
5.2. Exploration Methodology and the Detection of Hydrothermal Activity on Back-Arc Spreading Centers
Reliable estimates of seafloor hydrothermal activity depend upon the extent and quality of exploration.
Globally, 35% of all BASC length has been explored for hydrothermal sites, though this percentage and the exploration quality vary widely between individual back arcs (Table 1) (Beaulieu et al., 2015). Including Mariana, seven have>25% coverage. Less than 5% of the Okinawa Trough has been systematically sur- veyed (Gamo et al., 2010), making it impossible to calculate a credibleFsfor the entire back arc. Below, we compare the Mariana BASC results with other hydrothermally surveyed back arcs.
In this paper, we generally use the survey and plume data for BASCs given by Beaulieu et al. (2015), but we update information for the Mariana, Manus, and Lau BASCs. The new data presented here expand the
Table 2
Location ofConfirmedaand InferredbActive Hydrothermal Sites on the Mariana BASC
Segment
Longitude (8E)
Latitude (8N)
Depth (km)
Distancec
(km) Sitea,b Site typed
Plume rise (km)
Discovery date and method
12.88N 143.393 12.691 22.950 0.0 1 ORP 0.15 plume (2003)e
12.88N 143.460 12.746 22.930 9.5 2 Low-T 0.17 plume (2003)e
12.88N 143.473 12.761 22.950 2.2 3 Low-T 0.18 plume (2003)e
12.88N 143.648 12.918 22.830 25.7 4 High-T ROV (2003) Pikaf
12.88N 143.633 12.939 22.990 11.2 5 High-T ROV (2003)Archaeanf
12.88N 143.619 12.953 22.858 2.9 6 H!? ROV (2003) Snailh
13.38N 143.683 13.100 23.036 17.7 7 L!ND camera (1999)i
13.38N 143.689 13.137 22.930 4.2 8 Low-T 0.18 plume (2003)e
13.38N 143.698 13.170 22.894 3.8 9 Low-T 0.18 plume (2003)e
14.58N 144.094 14.487 24.120 152.5 10 Low-T 0.45 plume (2015)g
15.58N 144.509 15.408 24.196 111.7 11 Low-T 0.40 Sentry, plume (2015)g
15.58N 144.510 15.435 24.111 3.0 12 Low-T 0.43 plume (2003)e
15.58N 144.508 15.480 23.935 4.9 13 High-T 0.43 Sentry(2015)g, ROVj
16.58N 144.870 16.401 23.829 108.2 14 Low-T 0.57 plume (2015)g
17.08N 144.868 16.957 23.294 62.5 15 High-T 0.40 Sentry(2015)g, ROVj
18.28N 144.755 18.032 23.715 119.4 16 ORP 0.18 Alvin(1987) CTk
18.28N 144.738 18.108 23.916 8.6 17 ORP 0.27 plume (2015)g
18.28N 144.719 18.183 23.700 8.6 18 High-T 0.72 Alvin(1987) Bk, ROVj
18.28N 144.711 18.214 23.654 3.5 19 H-ORP 0.38 Alvin(1987) ASk, ROVj
aConfirmedvisually by navigated, near-bottom AUV and/or ROV data.
bInferredfrom ship-deployed sensor data.
cSequential distance between each plume anomaly. Anomalies closer than1 km are deemed a single site.
dORP5no detectable Nephelometric Turbidity Unit plume; Low-T5ORP, very weak NTU (<0.01 V) plume; High- T5observed chimneys or strong (>0.01) NTU plume; H!?5high-temperature when discovered, now uncertain; L! ND5Low-T at discovery, plume not detected in 2015; H-ORP5high-temperature, negligible NTU.
eBaker et al. (2005).
fIshibashi et al. (2004).
gThis study.
hWheat et al. (2003); Yamanaka site (Yoshikawa et al., 2012) is within 1 km.
iMitsuzawa et al. (2000).
jButterfield et al. (2017).
kCraig et al. (1987), Campbell et al. (1987), Hessler and Lonsdale (1991). CT5Central Trough; B5Burke; AS5Alice Springs/Ilium.
Mariana coverage from 5% to 46%, conservatively estimatingFsby assuming that no along-axis active sites occur in the deep unsurveyed basins between the magmatic highs. Our exploration strategy was not opti- mal for detecting sites high on axial valley walls, so such sites, if any, were missed. We include in our updated inventory not only sites discovered by plume surveys in 2003 and 2015 but also the Burke, Archaean, and Pika/Urashima sites. The IRDB groups Burke, Alice Springs, and Illium into a single site, but because ORP data discriminates individual sites at a scale of1 km (Baker et al., 2016) we list Burke and Alice Springs/Illium as two separate sites. Similarly, IRDB aggregates Archaean, Pika (3 km from Archaean), and Urashima (500 m from Pika) into a single site but we list Archaean and Pika/Urashima as two separate sites. Even though Pika lies5 km east of the ridge axis, we classify it as a back arc rather than volcanic arc site, following geochemical (Kakegawa et al., 2008) and geomorphological (Yoshikawa et al., 2012) evidence.
In contrast, Toto caldera, 7 km east of the axis and 26 km south of Pika, has been classified as an arc volcano (Gamo et al., 2004). Although improved surveying increases the site count, our expansion of the Mariana surveyed zone beyond the Malaguana-Gadao Ridge reduces the MarianaFsvalue from 9.2 (as presently cal- culated from the IRDB) to 3.2 sites/100 km. This value may decrease further once the northern half of the Mariana BASC has been surveyed because active spreading appears to cease north of208N (Martinez &
Taylor, 2003). However, north of 208N the axial ridge shallows considerably as it again approaches the arc and may be magmatically active because of slow rifting to the north that could enhance crustal extension and thus magma delivery (Stern et al., 1984).
For Manus, we remove the Western Ridge, which is properly outside the geological boundaries of the Manus BASC (Martinez & Taylor, 2003), and the Solwara 19 site, which is included as a back-arc site in Beau- lieu et al. (2015) but occurs well off any spreading ridge. These changes eliminate four sites, reduce the total BASC length from 455 km to 365 km, and slightly lower the exploration coverage to 86%. A summary of known sites compiled for ODP Leg 193 in Manus Basin (Barriga et al., 2000) includes four unnamed sites not in the IRDB, raising the total back to 11, for anFsvalue of 3.5, slightly higher than the existing IRDB value of 2.7 sites/100km (Table 3).
For the Lau Basin, we include only those BASCs along the western border of the Tonga plate—the Eastern Lau Spreading Center (ELSC, encompassing the Valu Fa Ridge), Fonualei Rift, and Spreading Center (FRSC), Mangatolo Triple Junction (MTJ), and the Northeast Lau Spreading Center (NELSC)—as BASCs associated with the subducting Tonga plate (Sleeper et al., 2016; Zellmer & Taylor, 2001). South of the ELSC (238S) the western boundary of the Tonga plate is interpreted as rifting, not spreading (Parson & Wright, 1996). The IRDB lists 59 active vent sites on ocean spreading centers in the Lau Basin, including those in its northwest
Table 3
Hydrothermal Site Densities (Sites/100 km) on BASC Segments<90 km and>90 km From an Arc
BASCs
Survey length (km)
Survey
length (%) Sites (No.)
Sites (% of total)
Fs(sites/
100 km)
90 kmFs
>90 kmFs
90 kmFs
totalFs
Segments<90 km
Mariana (<70 km)a 124 20 9 47 7.3 3.5 2.3
Manus (<90 km)b 94 30 8 73 8.5 7.7 2.4
Lau (<70 km)c 498 62 83 66 17.3 1.3 1.1
FRSC 156 19 12 10 7.7
ELSC 272 34 65 52 23.9
NELSC 70 9 6 5 8.6
Segments>90 km
Mariana 476 80 10 53 2.1
Manus 270 70 3 27 1.1
Laud 327 38 41 33 11.5
FRSC 60 7 4 3 6.7
ELSC 150 19 30 24 20.0
MTJ 117 14 7 6 6.0
aDistance from the volcanic arc toMsegments.
bDistance from the volcanic arc to Southeast Ridges.
cDistance from the volcanic arc to NELSC (North East Lau Spreading Center); FRSC (Fonualei Rift and Spreading Cen- ter, segments south of 16.58S); and ELSC (Eastern Lau Spreading Center, segments south of 20.58S).
dFRSC, segments north of 16.58S; ELSC, segments north of 20.58S; MTJ (Mangatolo Spreading Center).
corner not bordering the Tonga plate (Beaulieu et al., 2015). Reanalyzing existing ELSC plume data (Baker et al., 2016) and using plume data not yet in the IRDB from the FRSC, MTJ, and NELSC (Walker & Baker, 2013;
https://www.pmel.noaa.gov/eoi/laubasin/documents/tn227-nelau-report-final.pdf; https://www.pmel.noaa.
gov/eoi/laubasin/documents/SRoF12-cruisereport-final.pdf; supporting information Data Set S5 and Table S1) results in a revised total of 124 sites, for anFsvalue of 14.5 (Table 3).
Survey quality also differs sharply among BASCs. Exploration of the Mariana (Baker et al., 2005; this paper), Manus (Massoth et al., 2008), and Lau (Baker et al., 2006, 2011) BASCs has featured continuous along-axis surveys with a combined optical/ORP sensor that substantially enhances the detection of vent sites, espe- cially those of low-temperature and/or a negligible optical signal. Such sites can comprise25% of sites detected on ridge sections continuously surveyed with both optical and ORP sensors (Baker et al., 2016), including the ELSC. Along the Mariana BASC, 21% of the sites had no detectable optical signal, and 68% are interpreted to vent low-temperature fluids only.
By contrast, East Scotia (German et al., 2000) and Okinawa Trough (Gamo et al., 2010) have been surveyed using tows but without benefit of an ORP sensor and with large gaps in coverage. Only two of nine East Scotia BASC segments have been towed, while other segments have been surveyed only with widely spaced vertical casts (Livermore, 2003). North Fiji (e.g., Sedwick et al., 1990), Bransfield Strait (Klinkhammer et al., 2001), and Woodlark (Laurila et al., 2012) BASCs have also been surveyed primarily (or only) with verti- cal casts. Thus, calculations ofFsalong those BASCs must still be regarded as less credible than those for the Mariana, Lau, and Manus BASCs.
5.3. Geological Setting and the Creation of Hydrothermal Activity on Back-Arc Spreading Centers The geologic setting of a BASC—including crustal extension, distance from an adjacent arc, and spreading rate—control its long-term level of hydrothermal activity. For example, Stern et al. (2013) and Brounce et al.
(2016) argue that strong crustal extension east of the Malaguana-Gadao Ridge has created multiple mag- matic pathways that form a band of small arc volcanoes parallel to the ridge rather than a single large edi- fice, as typical to the north. The broader spatial distribution of this magma, compared to elsewhere on the volcanic arc, may enhance magmatic capture by the BASC.
Even without unusual crustal extension, BASCs may be magmatically enhanced by hydrous melting. Sleeper et al. (2016) note that within70 km of the arc, BASCs in the Lau system acquire morphological characteris- tics of a magmatic budget higher than their present spreading rate would indicate (e.g., a shallow zero-age depth, a central volcanic high, and subdued along-axis relief). This distance range includes the NELSC, FRSC, and ELSC (except for the more arc-distant northerly two segments on the latter two ridges) among the Lau ridges, and bothMsegments on the Mariana. MeanFsvalues are 16.7 and 7.3, respectively, for these Lau and Mariana segments (Table 3). By contrast, the Lau and Mariana ridge segments beyond 70 km from their arc have substantially lower meanFsvalues: 11.5 for Lau and 2.1 for central Mariana (Table 3).
Manus also follows the Lau and Mariana pattern, but with a slightly larger distance scale. Eight of the 11 known Manus sites occur on the Southeast Ridges, within 90 km of the New Britain arc, yielding anFsvalue of 8.5 (Table 3). These ridges are the shallowest of the Manus BASCs and are covered in high-reflectivity and likely young lava flows, implying a robust magmatic budget (Martinez & Taylor, 2003).
Other BASCs are associated with a distant arc (East Scotia, North Fiji) or one that is no longer active (Wood- lark, Bransfield Strait). The East Scotia BASC is anomalous in experiencing intermediate-rate spreading (70 mm/yr) but expressing a typical slow spreading ridge morphology (magmatically inflated centers flanked by deep basins) on most of its segments (Livermore, 2003). Only the north and south end-most seg- ments, nearest (<150 km) to the arc, where magma lenses and hydrothermal vents have been identified, have magmatically robust characteristics. These differences have been attributed to mantle flow around the Scotia slab enhancing the magmatic budgets of the end segments, while depleted East Scotia mantle depresses magmatism in the central East Scotia BASC (Livermore, 2003). At present, there is insufficient evi- dence to determine if its overall lowFs(1.5) is a product of geological forces, inadequate exploration, or both.
BASC spreading rates in the poorly surveyed North Fiji Basin decline from 50 to 80 mm/yr in the central spreading ridge to 20–40 mm/yr farther west and show morphologies corresponding to MORs with those spreading rates (Auzende et al., 1994). Those ridge sections lie a minimum of 300 km west of the New
Hebrides arc, and thus hydrothermal activity should be predominantly controlled only by spreading rates, without benefit of any arc- influenced melt supply. As with East Scotia, hydrothermal coverage on the North Fiji BASC remains insufficient, through lack of coverage and high-precision sensor use, to test this presumption.
Because the mean spreading rate for BASCs (44628 mm/yr) is indis- tinguishable from MORs (46634 mm/yr), we would suppose that the long-term magma supply should similarly influence the level of hydro- thermal activity for both ridge categories. We test this inference by plottingFsvalues against spreading rate for a suite of 26 MOR ridge sections (Beaulieu et al., 2015) and the seven BASC sections with extensive surveys from Table 1. Although the two data sets overlap extensively (Figure 9), Mariana, Lau, and Manus plot above the MOR regression line while the remaining four BASCs plot below. Mariana, Lau, and Manus share two relevant characteristics that relate to both exploration and geology: high-quality surveys, and ridge sections close to their adjacent arcs.
High-quality surveys, as described in this paper, are a prerequisite for a quantitative comparison between geologic setting and hydrother- mal activity. A critical feature of geologic setting is arc proximity. The effect of crustal extension and hydrous flux melting enabled by slab- derived water (as distinct from plate-driven, decompressional melting) on back-arc ridge morphology increases with proximity to the arc and occurs at all spreading rates (e.g., Sleeper et al., 2016; Taylor & Marti- nez, 2003). Our results suggest that hydrothermal activity is also sensi- tive to arc proximity. Plotting the Fsvalue of the near-arc segments separately shows that those segments haveFsvalues 1.5–7.7 times higher than segments more distant from the arc, regardless of spreading rate (Figure 9 and Table 3). The effect of arc-proximity is most clearly expressed on Manus and Mariana because near-arc segments encompass <30% of the total explored length of each BASC, but account for 50–70% of the active sites. Near-arc segments are less influential on the overall LauFsbecause they encompass>60% of both total BASC length and vent sites.
We conclude that arc proximity is the dominant factor that increasesFsvalues above the global mean trend along portions of some BASCs (Figure 9). For Mariana, Lau, and Manus, a magmatic budget increased by hydrous melting and crustal extension may alter the crustal structure by creating a thick porous upper crust that can enhance hydrothermal circulation. For example, work by Dunn & Martinez (2011) on the ELSC sug- gests that back-arc ridge crust formed close (tens of kilometers) to an arc is of higher porosity (>15%) than that (<10%) of crust formed beyond the reach of hydrous mantle upwelling. Increased spreading rates, leading to increased decompressional melting, may play a secondary role in boostingFson arc-proximal segments (Figure 9). Manus is an extreme example, where spreading rates andFsvalues double on the arc- proximal segments. On Mariana and Lau, however, arc-proximal segments have a mean spreading rate simi- lar to that of the entire BASC. A remaining outstanding question is why Lau segments both near and distant from the adjacent arc, spanning some 800 km of ridge crest, and spreading at slow to fast rates, are uni- formly among the most hydrothermally active of all explored spreading ridges.
6. Conclusions
Our exploration of the southern Mariana BASC identified at least 19 active sites venting both high- temperature and low-temperature discharge, all occurring on the bathymetric highs of 7 of the 11 surveyed segments, including segments of all four geologic types. Sites were most concentrated on the two seg- ments with the highest spreading rates and the shortest distance (<40 km) to the adjacent arc. Three sites discovered in 1987 near 18.18N (Campbell et al., 1987; Hessler & Lonsdale, 1991) remain active in 2016. The resultingFsvalue of 3.2 sites/100 km is higher than expected for a mean spreading rate of 41 mm/yr, and 2–5 times higher than four other BASCs with mean spreading rates of 7–68 mm/yr. In broad terms, BASCs Figure 9.Mean spreading rate (us) versus sites/100 km (Fs) for a set of 26 MOR
sections (black dots) listed in the IRDB (Beaulieu et al., 2015) and seven BASCs in Table 1 (squares; Okinawa Trough not used because of sparse coverage).
Error bars show the standard deviation of mean spreading rate, where larger than the symbol itself. Black line is the linear regression for the 26 MOR sections (Fs50.6110.025us,r50.60). Green solid squares and dots show revisedFsvalues for three BASCs and three MOR sections based on high- quality surveys not yet included in the IRDB (e.g., Baker et al., 2016; this paper).
Open green squares showFsvalues for arc-proximal segments lying<90 km from the adjacent arcs of three BASCs.
show aFsversus spreading rate trend similar to a suite of 26 MOR segments. However, Mariana, Lau, and Manus lie above the MOR trend whereas other BASCs lie below. Mariana, Lau, and Manus are unique among BASCs both in the quality of hydrothermal surveying and in geologic setting. Each has been mapped with survey techniques employing continuous tows of optical and chemical sensors. Such tows can effectively detect vents issuing low-temperature (particle-poor) discharge, which apparently comprise 68% of all Mariana vent sites. They are also the only BASCs with extensive portions of their lengths (20–62%) within
<90 km of their adjacent arcs.Fsvalues of these arc-proximal sections are 1.5–7.7 times higher than more
distant segments. This limit is roughly the proposed distance within which additional magma can be sup- plied by hydrous flux melting in a subducting plate (Martinez & Taylor, 2003; Sleeper et al., 2016), perhaps facilitated when crustal extension creates widespread magmatic pathways (Brounce et al., 2016; Stern et al., 2013). Increased spreading rates in some arc-proximal segments may also generate increased decompres- sional melting. Thus, the enhanced magma budget affects hydrothermal, as well as previously recognized morphological, characteristics of these ridge sections.
References
American Public Health Association (1985).Standard methods for the examination of water and wastewater(16th ed.). Washington, DC:
American Public Health Association.
Anderson, M. O., Chadwick, W. W., Jr., Hannington, M. D., Merle, S. G., Resing, J. A., Baker, E. T.,. . .Augustin, N. (2017). Geological interpreta- tion of volcanism and segmentation of the Mariana back-arc spreading center between 12.78N and 18.38N.Geochemistry, Geophysics, Geosystems,18, 2240–2274. https://doi.org/10.1002/2017GC006813
Auzende, J. M., Pelletier, B., & Lafoy, Y. (1994). Twin active spreading ridges in the North Fiji Basin (southwest Pacific).Geology,22(1), 63–66.
Baker, E. T., Lowell, R. P., Resing, J. A., Feely, R. A., Embley, R. W., Massoth, G. J., & Walker, S. L. (2004). Decay of hydrothermal output follow- ing the 1998 seafloor eruption at Axial Volcano: Observations and models.Journal of Geophysical Reserach,109, B01205. https://doi.org/
10.1029/2003JB002618
Baker, E. T., Lupton, J. E., Resing, J. A., Baumberger, T., Lilley, M., Walker, S. L., & Rubin, K. (2011). Unique event plumes from a 2008 eruption on the Northeast Lau Spreading Center.Geochemistry, Geophysics, Geosystems,12, Q0AF02. https://doi.org/10.1029/2011GC003725 Baker, E. T., Massoth, G. J., Feely, R. A., Cannon, G. A., & Thomson, R. E. (1998). The rise and fall of the CoAxial hydrothermal site, 1993–1996.
Journal of Geophysical Research,103, 9791–9806.
Baker, E. T., Massoth, G. J., Nakamura, K., Embley, R. W., de Ronde, C. E. J., & Arculus, R. J. (2005). Hydrothermal activity on near-arc sections of back-arc ridges: Results from the Mariana Trough and Lau Basin.Geochemistry, Geophysics, Geosystems,6, Q09001. https://doi.org/10.
1029/2005GC000948
Baker, E. T., Resing, J. A., Haymon, R. M., Tunnicliffe, V., Lavelle, W., Martinez, F.,. . .Nakamura, K. (2016). How many vent fields? New esti- mates of vent field populations on ocean ridges from precise mapping of hydrothermal discharge locations.Earth and Planetary Science Letters,449, 186–196. https://doi.org/10.1016/j.epsl.2016.05.031
Baker, E. T., Resing, J. A., Walker, S. L., Martinez, F., Taylor, B., & Nakamura, K. (2006). Abundant hydrothermal venting along melt-rich and melt-free ridge segments in the Lau back-arc basin.Geophysical Research Letters,33, L07308. https://doi.org/10.1029/2005GL025283 Barreyre, T., Escartın, J., Sohn, R. A., Cannat, M., Ballu, V., & Crawford, W. C. (2014). Temporal variability and tidal modulation of hydrothermal
exit-fluid temperatures at the Lucky Strike deep-sea vent field, Mid-Atlantic Ridge.Journal of Geophysical Research,119, 2543–2566.
https://doi.org/10.1002/2013JB010478
Barriga, F., Binns, R., Baldauf, J., & Miller, D. J. (2000). Anatomy of an active, felsic-hosted hydrothermal system, eastern Manus basin: Leg 193,Scientific Prospectus. College Station, TX: Ocean Drilling Program, ODP/TAMU Publications. Retrieved from http://www-odp.tamu.
edu/publications/prosp/193_prs/193prosp.pdf
Beaulieu, S. E., Baker, E. T., & German, C. R. (2015). Where are the undiscovered hydrothermal vents on oceanic spreading ridges?Deep Sea Research Part II,121, 202–212. https://doi.org/10.1016/j.dsr2.2015.05.001
Bird, P. (2003). An updated digital model of plate boundaries.Geochemistry, Geophysics, Geosystems,4(3), 1027. https://doi.org/10.1029/
2001GC000252
Brounce, M., Kelley, K. A., Stern, R., Martinez, F., & Cottrell, E. (2016). The Fina Nagu volcanic complex: Unusual submarine arc volcanism in the rapidly deforming southern Mariana margin.Geochemistry, Geophysics, Geosystems,17, 4078–4091. https://doi.org/10.1002/
2016GC006457
Butterfield, D., & Shipboard Scientific Party (2017). Hydrothermal hunt at the Mariana back-arc, Leg 2. (Cruise Rep. FK161129 on RV Falkor).
Seattle, Washington. Retrieved from https://www.pmel.noaa.gov/eoi/marianas/Falkor-2016-FK161129-report-with-logs.pdf Campbell, A. C., Edmond, J. M., Colodner, D., Palmer, M. R., & Falkner, K. K. (1987). Chemistry of hydrothermal fluids from the Mariana
Trough backarc basin in comparison to mid-ocean ridge fluids.Eos, Transactions American Geophysical Union,68(44), 1531.
Chadwick, W. W., Jr., Merle, S. G., Kaiser, C. L., Baker, E. T., Walker, S. L., Resing, J. A.,. . .Rubin, K. H. (2017). A recent volcanic eruption discov- ered on the central Mariana back-arc spreading center. Abstract presented at IAVCEI 2017 General Assembly, 14–18 August, Portland, OR.
Craig, H., Horibe, Y., Farley, K. A., Welhan, J. A., Kim, K.-R., & Hey, R. N. (1987). Hydrothermal vents in the Mariana Trough: Results of the first Alvin dives.Eos, Transactions American Geophysical Union,68(44), 1531.
Dunn, R. A., & Martinez, F. (2011). Contrasting crustal production and rapid mantle transitions beneath back-arc ridges.Nature,469, 198–202.
Gamo, T., Masuda, H., Yamanaka, T., Okamura, K., Ishibashi, J., Nakayama, E.,. . .Watanabe, M. (2004). Discovery of a new hydrothermal vent- ing site in the southernmost Mariana Arc: Al-rich hydrothermal plumes and white smoker activity associated with biogenic methane.
Geochemical Journal,38, 527–534.
Gamo, T., Tsunogai, U., Ichibayashi, S., Chiba, H., Obata, H., Oomori, T.,. . .Sano, Y. (2010). Microbial carbon isotope fractionation to produce extraordinarily heavy methane in aging hydrothermal plumes over the southwestern Okinawa Trough.Geochemical Journal,44(6), 477–487.
German, C. R., Livermore, R. A., Baker, E. T., Bruguier, N. I., Connelly, D. P., Cunningham, A. P.,. . .Tyler, P. A. (2000). Hydrothermal plumes above the East Scotia Ridge: An isolated high-latitude back-arc spreading centre.Earth and Planetary Science Letters,184(1), 241–250.
Acknowledgments
We thank J.W. Lavelle for modeling plume rise heights, the Woods Hole Oceanographic InstitutionSentryteam for expert support during our cruise, and F. Martinez for insightful comments on the manuscript. We also recognize helpful comments from R.
Stern and two anonymous reviewers.
This research was supported by the NOAA Ocean Exploration and Research Program, the NOAA/PMEL Earth-Ocean Interactions Program, the Cooperative Institute for Marine Resources Studies (CIMRS), and the Joint Institute for the Study of the Atmosphere and Ocean (JISAO) under NOAA Cooperative Agreements NA11OAR4320091 and NA10OAR4320148. The Schmidt Ocean Institute funded the use of the R/V Falkor, the AUVSentry, and the participation of MOA on the cruise.
The authors declare no financial conflicts. Previously unpublished data used in this paper are found in the supporting information. PMEL contribution 4678, JISAO contribution 2017-090.