In situ growth and bioerosion rates of
Lophelia pertusa in a Norwegian fjord and open shelf cold-water coral habitat
Janina V. Büscher1, Max Wisshak2, Armin U. Form1, Jürgen Titschack2,3, Kerstin Nachtigall1and Ulf Riebesell1
1Biological Oceanography, GEOMAR Helmholtz Centre for Ocean Research Kiel, Kiel, Germany
2Marine Research Department, Senckenberg am Meer, Wilhelmshaven, Germany
3Current Affiliation: Marine Sedimentology, MARUM—Center of Marine Environmental Sciences, Bremen, Germany
ABSTRACT
Coral reef resilience depends on the balance between carbonate precipitation, leading to reef growth, and carbonate degradation, for example, through bioerosion. Changes in environmental conditions are likely to affect the two processes differently, thereby shifting the balance between reef growth and degradation. In cold-water corals estimates of accretion-erosion processes in their natural habitat are scarce and solely live coral growth rates were studied with regard to future environmental changes in the laboratory so far, limiting our ability to assess the potential of cold-water coral reef ecosystems to cope with environmental changes. In the present study, growth rates of the two predominant colour morphotypes of liveLophelia pertusaas well as bioerosion rates of dead coral framework were assessed in different environmental settings in Norwegian cold-water coral reefs in a 1-year in situ experiment. Net growth (in weight gain and linear extension) of liveL. pertusawas in the lower range of previous estimates and did not significantly differ between inshore (fjord) and offshore (open shelf) habitats. However, slightly higher net growth rates were obtained inshore. Bioerosion rates were significantly higher on-reef in the fjord compared to off-reef deployments in- and offshore. Besides, on-reef coral fragments yielded a broader range of individual growth and bioerosion rates, indicating higher turnover in live reef structures than off-reef with regard to accretion–bioerosion processes. Moreover, if the higher variation in growth rates represents a greater variance in (genetic) adaptations to natural environmental variability in the fjord, inshore reefs could possibly benefit under future ocean change compared to offshore reefs. Although not significantly different due to high variances between replicates, growth rates of orange branches were consistently higher at all sites, while mortality was statistically significantly lower, potentially indicating higher stress-resistance than the less pigmented white phenotype. Comparing the here measured rates of net accretion of live corals (regardless of colour morphotype) with net erosion of dead coral framework gives afirst estimate of the dimensions of both processes in natural cold-water coral habitats, indicating that calcium carbonate loss through bioerosion amounts to onefifth to one sixth of the production rates by coral calcification (disregarding accretion processes of other organisms and proportion of live and dead coral framework in a reef). With regard to likely accelerating bioerosion and diminishing growth rates of corals under ocean acidification, the balance of reef
Submitted26 February 2019 Accepted30 July 2019 Published24 September 2019 Corresponding author Janina V. Büscher, jbuescher@geomar.de Academic editor Mark Benfield
Additional Information and Declarations can be found on page 29
DOI10.7717/peerj.7586 Copyright
2019 Büscher et al.
Distributed under
Creative Commons CC-BY 4.0
accretion and degradation may be shifted towards higher biogenic dissolution in the future.
Subjects Marine Biology, Climate Change Biology, Biological Oceanography
Keywords Lophelia pertusa, Cold-Water Corals, In situ study, Growth, Bioerosion, North Atlantic, Inshore vs. offshore, Mortality
INTRODUCTION
Cold-water corals are important carbonate factories in the upper bathyal realm, which can build large reefs on continental shelves and slopes. Mean Holocene carbonate
accumulation accounts to 103 g cm−2kyr−1in Norwegian cold-water coral reefs in the North Atlantic, therewith representing significant carbonate sinks on a local and
potentially even global scale (Lindberg & Mienert, 2005;Titschack et al., 2015). Moreover, they are among the most prominent ecosystem engineers on Earth, hosting more than 2,700 species associated to cold-water coral reefs around the world, using them as nursery grounds or feeding places (Freiwald et al., 2004;Roberts & Cairns, 2014). In contrast to their tropical counterparts, cold-water coral reefs are usually built by only one or two dominant coral species. The most abundant framework-forming cold-water coral is the caryophyllid scleractinianLophelia pertusa(Linnaeus, 1758).L. pertusais widely distributed and builds extended reefs in almost all oceans except for the polar regions (Cairns, 1994;Rogers, 1999;Freiwald et al., 2004). Reefs built by L. pertusahave most frequently been found in the eastern Atlantic Ocean with a dense band of reefs extending from northern Norway in the Barents Sea to the coasts of West Africa (Freiwald et al., 2004). While this is partly a consequence of higher emphasis on research efforts in these areas, the North Atlantic continental shelves and slopes appear to represent particularly suitable grounds for the development of such reefs, butLopheliaoccurrences have also been documented from the Gulf of Mexico in the western Atlantic (Schroeder, 2002;Ross &
Nizinski, 2007;Brooke & Young, 2009;Hübscher et al., 2010;Larcom et al., 2014) and the US mid-Atlantic coast (Mienis et al., 2014;Brooke et al., 2017). The reported depths of L. pertusaoccurrences encompass a broad bathymetric range from 39 m to over 3,300 m in the North Atlantic, butL. pertusais most commonly found between 200 and 1,000 m (Roberts et al., 2009).L. pertusainhabits temperatures between 4 to 13.9C and salinities from 32 to 38.8 (Freiwald et al., 2004,2009).
Cold-water coral reefs are often characterised by colonies of different colour
morphotypes (in the following short: colourmorphs). In the NorwegianL. pertusareefs the typically white coral framework is accompanied by an orange phenotype of this species.
Elde et al. (2012)found different pigment concentrations of astaxanthin, one of the main carotenoids inLophelia, between the colourmorphs with more than twice the content in the soft tissue and skeleton of orangeL. pertusacompared to the white phenotype. To date, it is unclear whether these variations in astaxanthin content are genetically or
environmentally controlled in cold-water corals. Colour variation in organisms often results from different food sources (Elde et al., 2012). In the case ofLopheliait is rather
unlikely that colour variation among colonies is related solely to food sources, since orange and white specimens grow side by side and have access to the same food. Instead, it may be related to differences in the composition of bacterial communities associated to the corals as reported forL. pertusa, which may be linked to a nutritional advantage of the corals (Neulinger et al., 2008). Pigmentation might also be an inherited characteristic transferred from individual to individual (Elde et al., 2012), as the orange pigment was also found to be vertically transmitted to the eggs of orange specimens (Larsson et al., 2014). Moreover, a role in the function as antioxidant or antibacterial agent was suggested as potential physiological advantage of these pigments to protect the corals against pathogens and to remove particles and sediment (Shnit-Orland & Kushmaro, 2008;
Elde et al., 2012). In a recent study byProvan et al. (2016)the authors observed that the protein content of the mucus ofL. pertusavaried between the two colour variants, which was suggested to be linked to the differences in mucus-associated bacterial symbionts.
Like many other deep-sea organisms,L. pertusagrows slowly, but has a long colony lifespan (Rogers, 1999). Many experimental laboratory studies report on growth rates of whiteL. pertusaunder various conditions (Maier et al., 2009,2012;Form & Riebesell, 2012;
Lunden et al., 2014;Hennige et al., 2014a,2015;Büscher, Form & Riebesell, 2017).
Comparisons with growth rates in the natural habitat are scarce, as cold-water corals are difficult to access and in situ studies challenging to apply. Reported estimates of growth rates have a broad range from 2.4 to 35 mm per year, depending on regional differences and application of different methods, including potential sampling errors (for instance, in the complex skeletal sampling for isotope analyses) or lack of resolution (Duncan, 1877;
Wilson, 1979;Mikkelsen et al., 1982;Freiwald, Heinrich & Pätzold, 1997;Mortensen, Rapp & Båmstedt, 1998;Bell & Smith, 1999;Roberts, 2002;Orejas, Gori & Gili, 2008;Orejas et al., 2011;Brooke & Young, 2009;Lartaud et al., 2013;Larcom et al., 2014).
In situ growth estimates ofL. pertusatypically refer to linear and radial extension rates (reviewed inRogers, 1999;Freiwald et al., 2004;Roberts et al., 2009). The majority of in situ growth rate estimates originate from non-invasive, indirect approaches through video and still inspection of corals grown on artificial substrates such as submarine cables and energy installations (Duncan, 1877;Wilson, 1979;Larcom et al., 2014), oil and gas platforms (Bell & Smith, 1999;Roberts, 2002;Gass & Roberts, 2006), and shipwrecks (Roberts et al., 2003;Larcom et al., 2014) that allow for estimates of minimum growth rates when considering the maximum age of coral colonies. Inspection of video surveys and still images revealed the highest reported growth estimates of 34–35 mm yr−1(Gass & Roberts, 2006;Larcom et al., 2014), though these high growth rates ofL. pertusacolonies from artificial substrates may be a result of very favourable conditions with regard to currents and food availability (Mortensen, 2001;Larcom et al., 2014).
Direct in situ measurements of linear extensions ofL. pertusawerefirst performed by Brooke & Young (2009)by means of a 1-year mark and recapture approach in the northern Gulf of Mexico. The coral fragments from their experiment yielded far lower linear extension rates of 2.44–3.77 mm yr−1on average compared to extensions from indirect analyses. Another mark and recapture study withL. pertusafrom the Mediterranean Sea
reported average linear extension rates of 7.5 mm yr−1(Lartaud et al., 2013). No direct measurements of natural growth rates were previously reported from Norwegian cold-water coral reefs, although these reefs comprise the most densely populated
cold-water reefs known (Freiwald et al., 2004). Laboratory investigations on calcification rates revealed more than an order of magnitude lower growth rates ofL. pertusafrom the Northeast Atlantic (0.006–0.009% d−1;Form & Riebesell, 2012;Büscher, Form &
Riebesell, 2017) compared to the Mediterranean (0.02–0.03% d−1;Orejas et al., 2011;Maier et al., 2009,2012).
Reef development is, however, not solely dependent on active growth of live corals.
Cold-water coral reefs are characterised by a large proportion of dead coral framework that accounts for more than 70% of L. pertusacolonies (Vad et al., 2017). As for their warm-water relatives, also cold-water coral reef development comprises a balance of reef accretion and degradation. The proportion of living corals in an established colony was presumed to decrease compared to an increasingly higher amount of dead coral framework as a result of natural reef development (Vad et al., 2017). Therefore, it is important to consider the counter-acting processes of dissolution and particularly bioerosion of the dead coral framework when assessing reef growth and development.
Bioerosion is defined as‘the process by which animals, plants and microbes sculpt or penetrate surfaces of hard substrates’(Neumann, 1966;Bromley, 1994). In fossil and recent L. pertusaskeletons a variety of bioerosion traces such as borings, attachment scars, and grazing traces produced by a wide spectrum of organotrophic bioerosion agents (e.g.
excavating sponges and bryozoans, microbial bioeroders including fungi and bacteria, grazing gastropods and echinoids, and parasitic foraminifers) was documented (Beuck &
Freiwald, 2005;Bromley, 2005;Wisshak et al., 2005;Wisshak, 2008;Beuck, López-Correa &
Freiwald, 2008;Beuck, Freiwald & Taviani, 2010). The majority of these bioeroders chemically etch and dissolve the host substrate. This process acts particularly on the bare dead coral skeleton, which lacks protection by organic tissue or defence mechanisms such as the secretion of mucus (Beuck, Freiwald & Taviani, 2010). Qualitative assessments of bioerosion patterns inL. pertusahave shown that for the majority of recorded bioerosion traces, that is, their trace makers, an exclusive or at least partial chemical mode of penetration is known or inferred. This also applies for the two most common organotrophic agents of bioerosion in these substrates, bioeroding marine fungi and excavating hadromerid sponges. For the latter group, which often take the lion share of internal macrobioerosion, several experiments with representatives of the most common genus, Cliona, have demonstrated a significant increase in bioerosion capacity with increasing carbon dioxide concentrations (Wisshak et al., 2012,2013,2014).
The growth of cold-water corals depends largely on environmental conditions including temperature, currents, food availability, and seawater chemistry (Mortensen, Rapp &
Båmstedt, 1998;Dullo, Flögel & Rüggeberg, 2008;Flögel et al., 2014). Ongoing ocean change may affect the capability of these fragile organisms of building their calcareous skeletons, as ocean acidification caused by anthropogenic carbon dioxide (CO2) emissions results in lowered seawater pH and decreasing carbonate ion concentrations in the oceans and consequently in a diminished calcium carbonate (CaCO3) saturation state (Orr et al.,
2005). Carbonate chemistry investigations at cold-water coral reefs and modelling assessments indicate that someL. pertusahabitats face already now low carbonate ion availability and projections suggest that ~70% of the known cold-water corals are expected to be exposed to calcium carbonate undersaturated waters by the end of the century due to ocean acidification (Guinotte et al., 2006;Zheng & Cao, 2015;Georgian et al., 2016).
To make reliable predictions on the growth performance of cold-water corals and reef development in the future, it is therefore important to identify the natural range of growth rates and their thresholds at current ocean conditions and bring rates measured in situ in line with rates yielded from laboratory investigations. This may also help to assess if results yielded in the laboratory might represent over-targeted accretion as potential compensation response of the corals for suboptimal conditions, for example.
With regard to reef degrading processes under proposed future ocean conditions (IPCC, 2014), empirical studies on warm-water coral reef ecosystems suggest that bioerosion of CaCO3will be accelerated in the future due to the promotion of chemical dissolution through lower coral skeletal densities under ocean acidification (Tribollet, Atkinson &
Langdon, 2006;Tribollet et al., 2009;Wisshak et al., 2012,2013,2014;Reyes-Nivia et al., 2013; and seeSchönberg et al., 2017for a review). Based on such experimental data, model calculations have shown an alarming situation with regard to increasingly fragile carbonate balance of coral reefs and call for local and global action (Kennedy et al., 2013).
These include conservation efforts and climate change mitigation strategies to prevent degradation of reef structures and eventually coral reef structural collapse. Despite the potentially significant effects, most studies regarding climate change related threats to corals do not consider bioerosion and almost all studies including degradation processes in coral reefs were carried out in tropical reef ecosystems. While studies have shown that bioerosion sometimes balances or even exceeds carbonate production temporarily in tropical reef ecosystems even at current ocean conditions (Perry, Spencer & Kench, 2008), to date there is no corresponding experimental data available for cold-water coral reefs.
Studies of bioeroders from an intermediate, cold-temperate environment suggest that the observed patterns of accelerated bioerosion under future conditions may apply across species and latitudes (Wisshak et al., 2014). Hence, to gain a better understanding of baseline in situ bioerosion rates of cold-water coral reef substrates and to allow predictions with regard to the impacts of ocean change on reef degradation, it is crucial to include bioerosion analyses in studies assessing growth in cold-water coral habitats.
Thus, the aim of this study was to simultaneously assess in situ growth and bioerosion rates ofL. pertusain a 1 year mark and recapture experiment. We thereby compare two different methodological approaches, the change in weight over time (buoyant weight before and after deployment) and linear extension rates (determined via staining). In addition, we compare two different cold-water coral reef locations (off-shore vs. coastal reef) in mid- Norway, allowing for a better representation of the natural variability of environmentally differing reef settings. Moreover, live corals of white and orangeL. pertusawere compared at each location in order to determine physiological differences between different
colourmorphs in a reef with regard to their growth performance. Last but not least, normalisation of physiological rates will be expanded by determining volume and area of
each coral fragment after recovery in addition to dry weight and biomass. This provides us with a variety of normalisation parameters and conversion factors between them, which can be used in future cold-water coral growth studies for more easily comparability.
MATERIAL AND METHODS
Studied reef sites
For a 1 year in situ growth and bioerosion rate assessment, two NorwegianLophelia reef sites with different environmental characteristics were chosen for collection and re-deployment of live corals and dead erect coral framework. The approximately 13 km long and 700 m wide Sula Reef Complex on the Sula Ridge off the coast of Sør-Trøndelag is the second largest known Lopheliareef on the Norwegian Shelf (Freiwald et al., 2002;
Hovland et al., 2005). This offshore location comprises a relatively constant habitat in terms of environmental parameters such as temperature, salinity, pH, and currents, while the selected inshore location, a reef near the island Nord-Leksa in the outer Trondheimsfjord (henceforth referred to as Leksa Reef), is exposed to a highly variable environment due to strong tidal and compensatory currents (Form et al., 2015Cruise Report POS473). At this location the in situ experiments were placed both in the living area of the reef and in the zone of dead coral debris a few tens of metres downslope.
Collection ofLophelia pertusaand maintenance on board
Sampling of coral specimens of the speciesL. pertusawas conducted with kind permission of the Norwegian Directorate of Fisheries (Fiskeridirektoratet) under permit number 12/17918. Corals from the Leksa Reef were collected on 29thand 30th June 2013 at 6336.46′N and 922.76′E and 157 m water depth (white specimens) and 6336.43′N and 922.45′E and 152 m (orange specimens) during research cruise POS455 with RV POSEIDON (GEOMAR Helmholtz-Zentrum für Ozeanforschung, 2015). At the Sula Reef, corals of both colourmorphs were collected on 4thJuly 2013 at 6406.62′N, 807.1′E in 303 m water depth. At both sites, dead erect coral framework, bearing established bioeroder communities (chiefly bioeroding fungi, bacteria, bryozoans, and sponges), was sampled from the reef basis. All samples were collected by means of the manned submersible JAGO with its sensitive claw for non-destructive sampling (GEOMAR Helmholtz-Zentrum für Ozeanforschung, 2017). On board, corals and dead coral framework were placed in large holding tanks (120 × 110 × 80 cm)filled with 500 L natural seawater obtained from ~70 m depth. Four of those holding tanks were connected in order to create a recirculating system. An interconnected cooling unit (Titan 4000;
Aqua Medic GmbH, Bissendorf, Germany) kept the water temperature in the tanks at ambient seabed temperature of 7.5–8.5C.
Preparation of the corals and dead erect coral framework for re-deployment
Live coral colonies as well as dead erect coral framework were fragmented intofist-sized pieces soon after collection. Afterwards, live corals were stained with Alizarin Red S. For this purpose, live coral branches were placed in separate staining tanks (2 × 30 L
plastic containers) mounted within the holding tanks for temperature equilibration.
The dye, pre-dissolved in ethanol, was slowly added until a concentration of 10–15 mg L−1 was reached according to the protocol applied inBrooke & Young (2009)forL. pertusa.
Live specimens were incubated in the staining tanks for 2–3 days, as cold-water corals incorporate the dye more slowly than faster growing warm-water corals (Brooke & Young, 2009;Form & Riebesell, 2012). The dead framework was examined for calcifying epibionts, which were carefully removed with tweezers and a scalpel in order to eliminate weight gain due to their ongoing calcification during the experiment. All living and dead coral fragments were weighed under water following the buoyant weighing technique described byDavies (1989), employing a Sartorius BP 310 P (Göttingen, Germany;d= 0.001 g) with a purpose built free hanging weighing gondola to enable weighing on board the vessel and to reduce transmission of vibrations onto the balance. Weighing on board was performed at very calm sea, but was nevertheless unsteady. Therefore, the average of 10 consecutive values was taken for each fragment to improve precision. Shortly before deployment of the fragmented and stained corals, one white and one orange coral fragment were attached with cable ties inside a ‘coral cage’(168 × 178 × 156 mm PP NalgeneÒ autoclave baskets). Four such coral cages were prepared for each study site.
Bioeroded coral fragments were attached in smaller baskets (123 × 154 × 105 mm, PP, NalgeneÒ autoclave baskets). For each location six‘bioerosion cages’filled with dead coral framework material were weighed under water using the buoyant weighing technique (Davies, 1989) and attached as a cluster for facilitating deployment and recovery.
In bioeroded deadL. pertusaframework, a number of successive stages of bioerosion, characterised by certain bioerosion trace assemblages, have been identified (Beuck, Freiwald & Taviani, 2010). For the purpose of our experiment, we attempted to distribute skeletons of these different bioerosion stages (stages 3 to 6 sensu Beuck, Freiwald &
Taviani, 2010) as evenly as possible to the different replicates and locations, though the amount of bioeroders per fragment can still vary considerably. As in Sula only little and relatively young dead coral framework could be collected, the material in the Sula cages comprised a mixture of dead erect coral framework from both collection sites in Sula and Nord-Leksa. Apart from this, we attempted to distribute skeletons as evenly as possible to the different replicates and locations with regard to their appearance of bioerosion stages.
Deployment and recovery of coral and bioerosion cages
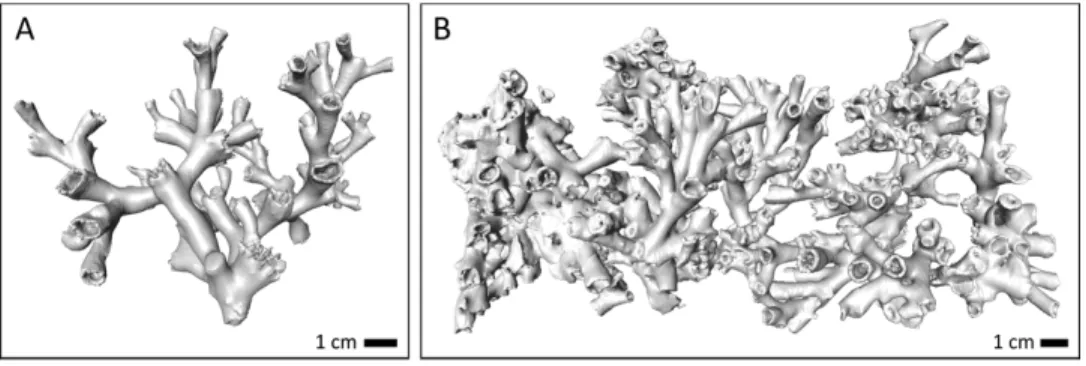
Four coral cages and six bioerosion cages were deployed simultaneously at each of the three deployment locations, two at the inshore reef south of Nord-Leksa and one at the offshore Sula Reef in July 2013. To assure constant submersion in seawater, the cages were immersed in a sampling box installed in front of JAGOfilled with seawater before lifting the submersible into water. On the ground, the baskets were positioned at the desired locations one by one with the submersible’s manipulator arm. At thefirst Leksa station (Leksa on-reef), the cluster and the coral cages were placed into a living reef area at 180 m water depth (Fig. 1A). At the second Leksa location (Leksa off-reef), baskets were placed on the bare sediment off the live reef zone at 218 m (Fig. 1B) to determine whether coral
survival and growth is also supported in areas of no coral growth in the vicinity of the living reef. At the Sula Reef Complex (Sula), coral cages and the bioerosion cluster were deployed at the southernmost third of the reef chain in a small depression almost completely engulfed by the live reef at 304 m, about 50–100 m away from the nearest living Lopheliacolonies. Unfortunately, in Sula no coral baskets could be deployed into the living reef structures because of limited dive possibilities due to rough weather conditions.
After 1 year, in July/August 2014, all locations were revisited with RV POSEIDON (POS473) and all coral cages and bioerosion clusters were recollected by means of JAGO and brought back aboard (permit number 14/1781 of Directorate of Fisheries for cruise POS473), where they were immediately transferred to large holding tanks. Except for one coral cage in the Leksa off-reef location, all coral cages and clusters could be retrieved. Soon after recovery, the coral fragments and bioerosion cages were weighed on board following the same protocol and using the same equipment as outlined above. Afterwards, all samples were dried at 60C on board and packed cushioned for later laboratory analyses.
Post-cruise analyses
After the cruise, all samples were dried at 70C for several days until constant weight was reached. Dry weights of empty baskets, cable ties, and corals were separately measured.
Calcifying epibionts grown on the dead erect coral framework as well as on the live coral fragments (carbonate accretion) over the year of exposure were removed with a scalpel and weighed separately after drying to constant weight. Then, all samples were scanned via computed tomography (CT) for volume and surface area analysis (see detailed description of the methods below), before linear extension rates of the ‘live’coral fragments were determined by measuring the distance from the Alizarin Red S band of each corallite to the rim of the calyx using a digital calliper. As growth of the calices is sometimes more pronounced on one side of the calyx than on the other, this measurement was done on two opposing sides, with the lowest and the highest distance between stain bands and rim of each corallite. In addition, the numbers of newly grown (completely unstained) corallites, as well as the number of died polyps (calices without tissue) of the ‘live’coral fragments were counted. When being deployed in 2013 it was made sure that only intact corallites
Figure 1 Live coral and bioerosion cages deployed within living reef structures (on-reef, (A)) and on the sediment in the off-reef location (B) in Nord-Leksa. Image courtesy: JAGO-Team, GEOMAR
Kiel. Full-size DOI: 10.7717/peerj.7586/fig-1
remained on the fragments, while all empty corallites were removed. Counted newly grown corallites and dead polyps were compared to the total number of corallites of each branch to assess budding rate as well as mortality as a percentage over the course of the experiment. Finally, all samples were dried again to constant weight and combusted at 500C for 5 h for differentiation of organic vs. inorganic content.
All fragments were dried to constant weight at 68C before tissue residuals were removed with chlorine bleach according to the method described byDavies (1989).
Afterwards, the buoyant weight of the fragments without tissue residuals was measured.
In order to get rid of all accumulated air bubbles within the skeletal structures, fragments were treated in a vacuum drying cabinet in beakersfilled with seawater, so that the weights were not falsified by additional buoyancy. After being washed in distilled water, the fragments were dried and weighed again until constant weight was reached and the skeletal densities were calculated from the following equation following the method by Davies (1989):
dSkeleton¼ dsw
1DWBW;
withδsw= density of the seawater, BW = buoyant weight of the coral fragments without tissue, and DW = the dry weight of the fragments without tissue.
CT scanning
Computed tomography scans of all dried samples (‘live’coral fragments and dead framework) for volume and surface area analyses were carried out with a Toshiba Aquilion 64 computer tomograph at the hospital Klinikum Bremen-Mitte with a voltage of the X-ray source of 120 kV and a current of 600 mA. The resulting CT image stacks have a resolution of 0.35 mm inx- andy-direction and 0.5 mm resolution inz-direction (0.3 mm reconstruction unit). Images were reconstructed using Toshiba’s patented helical cone beam reconstruction technique and are provided in DICOM-format. The data were processed with the ZIB edition of the Amira software (version 2013.47; ZIB, Berlin, Germany) (Stalling, Westerhoff & Hege, 2005). With Amira, the corals were segmented with theMulti-Thresholdingmodule (threshold value: 0). The segmentation result was evaluated and the coral cage was removed from the computation of each sample with the Segmentation Editor. Afterwards, the Generate-Surfacemodule was used to compute a surface model of the coral specimens. Finally, the volume and the area of the specimens were determined using the Surface Area Volumemodule.
Calculations and statistical analyses
Growth and bioerosion rates were calculated according to descriptions inDavies (1989) based on buoyant-weight gain or loss of the coral skeleton over time. The gained rates were normalised to weight change per day as a percentage of the initial weight of the coral (G % d−1) as parameterisation predominantly used in experimental studies with live corals applying the buoyant weighing technique. In addition, rates were normalised to weight change in grams per square metre coral surface (gained from the CT
measurements) per year (g m2yr−1), which represents the most common unit in bioerosion studies. Data are depicted as mean ± standard deviation (SD). Statistical analyses were performed using SigmaPlot© (version 12.0; Systat Software, Inc., San Jose, CA, USA) and MS Excel Redmond, WA, USA. For statistically comparing the results between the three locations of white as well as orange coral colourmorphs, One-way analysis of variance tests (ANOVAs) were carried out withn= 4 replicates per location, except for the Leksa off-reef location at which one basket and therewith one orange and one white replicate were missing. In case of statistical differences, a post-hoc test for pairwise multiple comparisons following the Holm-Sidak method was carried out to distinguish differences among groups/locations. Whenever data were pooled to increase the sample size and statistical power, this was done upon confirmation that there were no significant differences in the statistical tests among pooled groups. For direct comparisons of white and orange corals or only two locations,t-tests were performed.
In order to obtain more accurate and reliable means for conversion factor calculations, outlier tests were carried out in MS Excel (Excel QUARTILE and OR functions).
RESULTS
Coral structural analyses
Coral surface area, volume, corallite number, and skeletal density of live and dead coral fragments (Table 1) were gathered post-experiment after recovery of the coral and bioerosion baskets. Volume and surface area were significantly different between live corals from both Leksa sites and the Sula Reef in both colourmorphs (p≤0.001; One-way
Table 1 Coral surface area, volume, and skeletal density of live and dead coral fragments as well as polyp counts of live corals.Surface area (in mm2) and volume (in mm3) are calculated from CT scans and given for live white and orange coral fragments as average of all replicates (n= 4 white as well as orange corals at Leksa on-reef and Sula, andn= 3 white as well as orange corals at Leksa off-reef) ± standard deviation at the three deployment locations.
Location Replicates Surface area (mm2) Volume (mm3) Polyps/
corallites (N) Skeletal density (g cm−3) Leksa (inshore, on-reef) White
corals
51,074.1 ± 1,793.9 36,403.1 ± 5,607.8 126 ± 55 2.764 ± 0.011 Orange
corals
30,064.7 ± 11,692.6 21,150.5 ± 11,044.0 91 ± 10 2.733 ± 0.057 Dead
framework
1,72,819.7 ± 12,298.6 1,44,023.3 ± 13,345.2 – 2.777 ± 0.024 Leksa (inshore, off-reef) White
corals
44,529.3 ± 8,823.8 34,855.6 ± 7,881.5 111 ± 33 2.746 ± 0.031 Orange
corals
48,469.5 ± 23,321.8 32,660.8 ± 17,937.6 154 ± 57 2.700 ± 0.022 Dead
framework
1,69,054.3 ± 11,319.0 1,41,679.3 ± 13,145.4 – 2.770 ± 0.010 Sula (offshore, off-reef) White
corals
20,323.5 ± 7,228.6 13,304.7 ± 5,139.5 38 ± 10 2.722 ± 0.062 Orange
corals
16,063.2 ± 5,236.2 11,052.1 ± 3,955.8 33 ± 12 2.411 ± 0.135 Dead
framework
1,41,404.2 ± 15,298.4 1,10,715.6 ± 11,055.5 – 2.727 ± 0.030
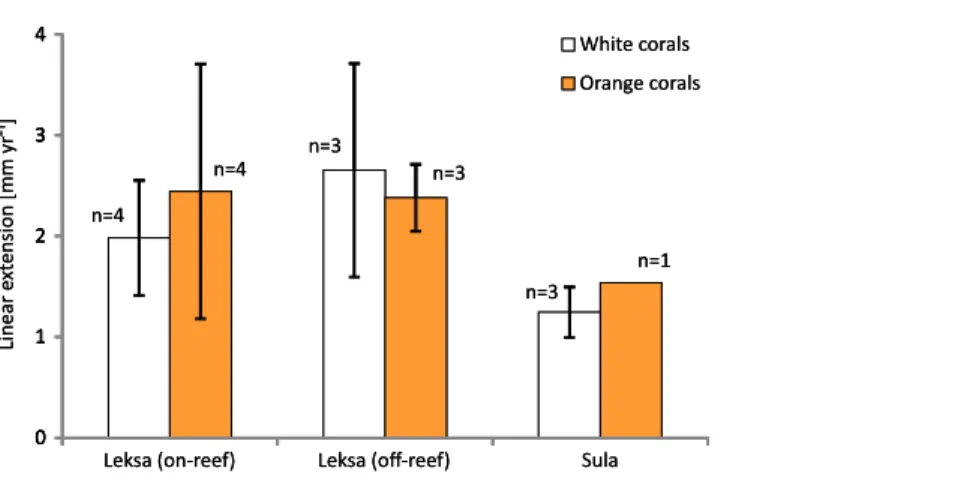
ANOVAs), with significantly less bulky coral fragments deployed in Sula compared to both Leksa locations. While Leksa corals had 119 ± 44 polyps/corallites per fragment on average, the Sula corals had only 35 ± 11 polyps per branch (Table 1). This is attributable to the different morphology of the offshore corals. While fjord colony growth is more compact, offshore coral growth tends to be more extended and branched, which corresponds to lower polyp numbers as well as surface area and volume in Sula despite similar fragment sizes like the Leksa fragments. Both surface area and volume of the coral branches correlated well with polyp count (R2= 0.7) with a slightly better correlation of surface area with total polyp count than volume.Figure 2shows exemplary CT scan images of a live coral fragment (A), and dead coral framework (B) from one basket of the cluster.
Mean skeletal density of all live corals was 2.734 ± 0.043 g cm−3. Orange corals had a slightly lower skeletal density (<1%) by trend than white corals. Note that the skeletal density of the orange coral fragments from the Sula Reef was considerably lower than the densities of all other fragments and was identified as outliers. The outlier values were therefore omitted from the average skeletal density of live corals.
Bioeroded skeleton material had slightly higher densities than live corals averaging 2.758 ± 0.031 g cm-3. Both, white vs. orange live as well as bioeroded vs. live coral skeletons were not significantly different in densities (t-tests). For the calculation of growth and bioerosion rates the specific density means of live or bioeroded skeleton material was used.
Mortality of live Lopheliafragments
Polyp mortality of the branches was quite variable between the replicates within and among locations, ranging from 0–86% dead polyps per branch. The highest variability was found in the Leksa on-reef location (Fig. 3). There was no statistically significant difference in mortality between locations (white and orange live coral branches separately tested or pooled). However, lowest mortality was found in Sula with only half as many dead polyps as a percentage of the total polyp count of a branch (10 ± 14%) as in the Leksa off-reef location (21 ± 19%) and one third of the percentage of the Leksa on-reef group (30 ± 27%). Comparison of polyp mortality between white and orange fragments (Fig. 4)
Figure 2 Example images of the CT scans of (A) a live coral fragment (orange coral branch from Leksa on-reef) and (B) dead coral framework from one basket of the cluster (Leksa off-reef).
Full-size DOI: 10.7717/peerj.7586/fig-2
revealed a statistically significant difference when white and orange corals were pooled over all three locations (p= 0.002; Mann–Whitney Rank Sum Test). While the orange coral fragments had on average 8 ± 9% dead polyps per replicate, the white corals had 33 ± 23%
(Table 2).
Linear extension rates
The overall mean extension rate of all stained corallites of the living coral branches (not all corallites incorporated the dye) from all sites was 2.12 ± 0.86 mm yr−1(n= 18;Table 3).
Examples of coral branches with corallites showing the Alizarin Red S band are depicted in the photographs inFig. 5. There were no statistically significant differences in average linear extension rates of the replicates, neither between the three locations (One-Way ANOVA) nor between colourmorphs (t-test) (Fig. 6). Nevertheless, the orange specimens tended to have ~15% higher linear extensions than the white ones (pooled over all locations: 2.31 ± 0.90 mm yr−1;n= 8 (orange) vs. 1.96 ± 0.84 mm yr−1;n= 10 (white);
0 10 20 30 40 50 60 70 80
Leksa (on-reef) Leksa (off-reef) Sula White corals Orange corals
Mortality [%]
(n = 3)
(n = 3) (n = 4)
(n = 4)
(n = 4)
(n = 4) 0
10 20 30 40 50 60 70 80
Leksa (on-reef) Leksa (off-reef) Sula White corals Orange corals
Mortality [%]
(n = 3)
(n = 3) (n = 4)
(n = 4)
(n = 4)
(n = 4)
Figure 3 Mortality (in percent dead polyps per branch) of white and orange corals at three deployment sites. Error bars represent ± standard deviation (SD) of white and orange corals each at the inshore on-reef and off-reef deployment locations at Nord-Leksa and at the Sula Reef.
Full-size DOI: 10.7717/peerj.7586/fig-3
0 10 20 30 40 50 60
White Orange
*
Mortality [%]
White corals Orange corals
(n = 11)
(n = 11) (p = 0.002)
0 10 20 30 40 50 60
White Orange
*
Mortality [%]
White corals Orange corals
(n = 11)
(n = 11) (p = 0.002)
Figure 4 Mortality (in percent dead polyps per branch) of white and orange corals averaged over all three locations.Error bars represent ± SD. The asterisk denotes that there is a statistically significant difference (p= 0.002) of the percentage of polyp mortality between white and orange corals.
Full-size DOI: 10.7717/peerj.7586/fig-4
Table 2 Percent mortality of white and orange coral branches after 1 year of deployment.The percentage of polyp mortality per branch is given as replicate means ± standard deviation for each deployment location and colourmorph.
Location Mortality rate
white (%)
Mortality rate orange (%)
Leksa (inshore, on-reef) 48 ± 26 12 ± 14
Leksa (inshore, off-reef) 33 ± 19 9 ± 7
Sula (offshore, off-reef) 18 ± 17 3 ± 5
Mean of all locations 33 ± 23 8 ± 9
Mean all live corals 20 ± 22
Table 3 Calcification and linear extension rates of live corals at three different deployment sites over 1 year experimental duration.Rates (in percent per day (% d−1) as well as grams per square metre and year (g m−2yr−1) for weight gain and in mm per year (mm yr−1) for linear extension) are given as replicate means ± standard deviation per deployment site for white and orange corals. The calcification rate in g m−2yr−1is based on surface area of the coral substrate calculated from the CT scans (see text for details).
Location Calcification
rate—white (% d−1)
Calcification rate—orange (% d−1)
Calcification rate—white (g m−2yr−1)
Calcification rate—orange (g m−2yr−1)
Linear
extension—white (mm yr−1)
Linear
extension—orange (mm yr−1) Leksa (inshore, on-reef) 0.0109 ± 0.0086 0.0202 ± 0.0203 56.07 ± 42.31 99.31 ± 86.73 1.98 ± 0.57 2.44 ± 1.26 Leksa (inshore, off-reef) 0.0120 ± 0.0058 0.0165 ± 0.0085 74.01 ± 38.94 76.80 ± 45.83 2.65 ± 1.06 2.38 ± 0.33 Sula (offshore, off-reef) 0.0095 ± 0.0030 0.0053 ± 0.0030 42.49 ± 6.82 28.51 ± 15.03 1.25 ± 0.25 1.54 (n= 1) Mean of all locations 0.0107 ± 0.0057 0.0138 ± 0.0137 56.02 ± 32.01 67.42 ± 61.51 1.96 ± 0.84 2.31 ± 0.90
Mean all live corals 0.0122 ± 0.0103 61.72 ± 48.20 2.12 ± 0.86
Figure 5 Exemplary branches of the stained live corals of a white (A + B) and an orange (C + D) coral from the Nord-Leksa on-reef location.Photos (B) and (D) depict close-ups of the most distant polyps of the coral branches from (A) and (C). Linear extension rates were measured from the Alizarin Red S staining mark to the terminal, unstained rim of the calices. Full-size DOI: 10.7717/peerj.7586/fig-5
Table 3). However, especially the orange corals showed high variances between replicates, which was pronounced most strongly in the on-reef replicates of Leksa, similarly to weight gain. Moreover, Sula corals showed considerably lower growth (~46% less average linear extension) compared to inshore sites. Within the orange coral group this is, however, based on only one replicate of the Sula location as the dye was visibly incorporated in only one of the four replicates at Sula. Thus, averaging all Leksa corals regardless of white or orange from both Leksa sites and comparing Leksa and Sula extension rates revealed a statistically significant difference with ~44% higher extension rates (p= 0.03;t-test; 2.34 (n= 14) vs. 1.31 mm yr−1(n= 4); Fig. 7). Average linear extension rates correlated well with weight gain in percent per day (R2= 0.83).
The amount of newly grown corallites that developed after staining was similar in all locations and averaged 47.4 ± 12.5%. New corallites alone had significantly higher
n=4
n=3
n=3
n=4 n=3
n=1
0 1 2 3 4
Leksa (on-reef) Leksa (off-reef) Sula -Linear extension [mm yr¹]
White corals Orange corals
0 1 2 3 4
n=4
n=3
n=3
n=4 n=3
n=1
0 1 2 3 4
Leksa (on-reef) Leksa (off-reef) Sula -Linear extension [mm yr¹]
White corals Orange corals
0 1 2 3 4
Figure 6 Average linear extension rates (in mm per year) of white and orange corals over 1 year at the three deployment sites Leksa on-reef, Leksa off-reef, and Sula Reef.Number of replicates (n) per site and colour morphotype is indicated next to the bars. Error bars represent ± standard deviation.
Full-size DOI: 10.7717/peerj.7586/fig-6
-Linear extension [mm yr¹]
Leksa Sula
*
0 1 2 3 4
0 1 2 3
4 White and orange corals pooled
(n = 4) (n = 14)
(p = 0.03) -Linear extension [mm yr¹]
Leksa Sula
*
0 1 2 3 4
0 1 2 3
4 White and orange corals pooled
(n = 4) (n = 14)
(p = 0.03)
Figure 7 Average linear extension rates (in mm per year) of inshore (Leksa) and offshore (Sula) live corals.Given are mean extension rates of pooled white and orange corals in mm per year ± standard deviation as error bars. The asterisk denotes a statistically significant difference between inshore and offshore corals when white and orange corals are pooled at both locations (p= 0.03).
Full-size DOI: 10.7717/peerj.7586/fig-7
extension rates (p= 0.043;t-test) than all stained polyps of the branches (total extensions;
including newly grown polyps and all corallites where staining bands could be
determined). Mean linear extension of newly grown polyps/corallites over all locations and specimens was 2.84 ± 1.04 mm yr−1compared to 2.11 ± 0.86 mm yr−1total extension on average (Fig. 8), and compared to 1.87 ± 0.59 mm yr−1when taking only the‘old’
stained corallites alone (p= 0.003;t-test comparing newly grown and stained corallites excluding newly grown). Comparing new vs. total extensions (averaged over all stained and newly grown corallites) of the different groups shows that the greatest effect of new growth took place in the Leksa on-reef location. On-reef, 60–75% higher linear extension rates of new corallites of white and orange specimens were gained, while in the Leksa off-reef location it was less than half as much (20–33%). In Sula, growth rates of newly grown corallites were not different or even lower than total stained corallites, although the percentage of newly grown corallites per branch was similar to the percentage of newly grown polyps on the Leksa branches. As newly grown corallites make up for almost half of all stained corallites the pattern of the slight differences between location and/or
colourmorph is similar to average extensions of all (old and young) corallites.
Calcification rates of live corals
Overall net carbonate production rate of all observed live coral fragments based on buoyant weight measurements (SD of the 10 consecutive measurements of each fragment of the Leksa weighing session = 0.052 g and Sula weighing session = 0.082 g) was 0.0122 ± 0.0103% d−1 or 61.7 ± 48.2 g m−2yr−1(n= 22;Fig. 9;Table 3). Mean values of white and orange coral fragments averaged over all locations were 0.0107 ± 0.0057% d−1or 56.02 ± 32.01 g m−2yr−1 (n= 11) and 0.0138 ± 0.0137% d−1corresponding to 67.42 ± 61.51 g m−2yr−1(n= 11), respectively. Calcification rates did not differ statistically significantly between white and orange corals (averaged over all locations;t-test), nor between the different sites (One-way ANOVAs). However, corals from Sula Reef generally showed lower calcification rates with only half as much CaCO3precipitation on average (48%) as the Leksa off-reef corals when
Total polyps Newly grown polyps
0 1 2 3 4
-Linear extension [mm yr¹]
0 1 2 3
4 White and orange corals pooled
*
(p = 0.04) (n = 18)
(n = 13)
Total polyps Newly grown polyps
0 1 2 3 4
-Linear extension [mm yr¹]
0 1 2 3
4 White and orange corals pooled
*
(p = 0.04) (n = 18)
(n = 13)
Figure 8 Average linear extension rates (in mm per year) of total stained polyps and polyps grown newly after staining.Data are averaged over all three reef sites. Error bars represent ± standard deviation.
The asterisk denotes that there is a statistically significant difference between only newly grown polyps and all stained polyps in average linear extension (p= 0.04). Full-size DOI: 10.7717/peerj.7586/fig-8
comparing all live corals (white and orange pooled) of the single sites (p= 0.029;t-test).
Although growth rates in the top reef replicates in Leksa on-reef were even higher on average than at the Leksa off-reef site, the top reef corals were not significantly different from the Sula corals. A similar comparison of all inshore vs. offshore replicates as for the linear extension rates (compareFig. 7) revealed a similar picture with 50% higher growth rates in weight gain in % d−1, though not statistically significant due to the high variability in the Leksa on-reef location (0.015% d−1(n= 14) vs. 0.0074% d−1(n= 8)).
Differences between the different locations and between the two colourmorphs of L. pertusaare shown inFig. 10.
Bioerosion rates and epibiont carbonate accretion rates of dead erect coral framework
Carbonate degradation rates presumably resulted primarily from bioerosion processes, as the aragonite saturation of the seawater was supersaturated at all locations at the time of deployment as well as recovery of the cages (Ω > 1.7;Table 4) and seasonal
undersaturation (Ω< 1) is expected very unlikely. Thus, physicochemical dissolution of the corals’skeleton is considered negligible here and degradation rates are referred to as bioerosion rates in the following. Bioerosion rates of the dead erect framework integrated over all locations (expressed here as negative values for indicating a loss in weight as opposed to the gain in weight by coral calcification) was−0.0020 ± 0.0015% d−1, corresponding to−12.37 ± 9.40 g m−2coral surface yr−1(Fig. 9). Highest degree of bioerosion took place in the Leksa on-reef location with−0.0036 ± 0.0012% d−1or
−23.20 ± 7.87 g m−2yr−1, which was 74% higher than the off-reef site in Leksa with
−0.0009 ± 0.0007% d−1or−5.88 ± 4.42 g m−2yr−1and 64% higher than the offshore location Sula with−0.0013 ± 0.0003% d−1or−8.03 ± 2.24 g m−2yr−1. Values from the on-reef Leksa location were statistically different from both off-reef placements (p≤0.001;
(n = 22) -Delta CaCO₃ [% d¹]
-0.01 0 0.01 0.02 0.03
Dead framework bioerosion Dead framework accreon Live white and orange corals pooled
(n = 18)
(n = 18) (n = 22)
-Delta CaCO₃ [% d¹]
-0.01 0 0.01 0.02 0.03
Dead framework bioerosion Dead framework accreon Live white and orange corals pooled
(n = 18)
(n = 18)
Figure 9 Growth rates (calcification) of live corals and bioerosion and accretion rates of dead coral framework averaged over all three deployment sites.Given are mean net calcification rates of live corals averaged over all locations and colourmorphs as well as bioerosion rates of the dead erect coral fragments and accretion rates of calcifying fauna on the dead framework averaged over the deployment sites. Error bars represent ± standard deviation and the number of replicates (n) is indicated next to the bars.
Full-size DOI: 10.7717/peerj.7586/fig-9
One-Way ANOVA;Fig. 10;Table 5), despite highest variation between replicates in the on-reef site. The off-reef locations (in Leksa and Sula) were not significantly different from one another.
Carbonate accretion by calcifying epibionts that grew during the 1 year of exposure was 0.0029 ± 0.0013% d−1(18.48 ± 8.54 g m−2yr−1), accounting for about one-fourth (23.7%) of the growth in percent per day of the living corals (Fig. 9;Table 5). However, this number has to be taken with caution, as particularly accretion might be subject to estimation errors.
Intensity of carbonate accretion in the dead framework was found to covary with the observed bioerosion rates, with highest accretion in the Leksa on-reef location and lower accretion rates in both off-reef sites. Carbonate accretion differed significantly only
-0.01 0 0.01 0.02 0.03 0.04 0.05
Leksa (inshore, on-reef)
Live white corals Live orange corals
-Delta CaCO₃ [% d¹]
Dead framework bioerosion Dead framework accreon
(n = 6) (n = 6)
(n = 6) (n = 6)
(n = 6) (n = 6)
(n = 4) (n = 4)
(n = 3)
(n = 3)
(n = 4) (n = 4)
Leksa (inshore, off-reef)
Sula (offshore, off-reef) -0.01
0 0.01 0.02 0.03 0.04 0.05
Leksa (inshore, on-reef)
Live white corals Live orange corals
-Delta CaCO₃ [% d¹]
Dead framework bioerosion Dead framework accreon
(n = 6) (n = 6)
(n = 6) (n = 6)
(n = 6) (n = 6)
(n = 4) (n = 4)
(n = 3)
(n = 3)
(n = 4) (n = 4)
Leksa (inshore, off-reef)
Sula (offshore, off-reef)
Figure 10 Growth (calcification) and bioerosion rates of 1 year in situ investigation at the three deployment sites Leksa on-reef, Leksa off-reef, and Sula Reef. Average calcification rates of white and orangeL. pertusa, and bioerosion rates of dead coral framework and associated carbonate accretion by calcifying epibionts (in percent per day) over 1 year of exposure. Error bars represent ± standard deviation and the number of replicates (n) is indicated next to the bars, respectively.
Full-size DOI: 10.7717/peerj.7586/fig-10
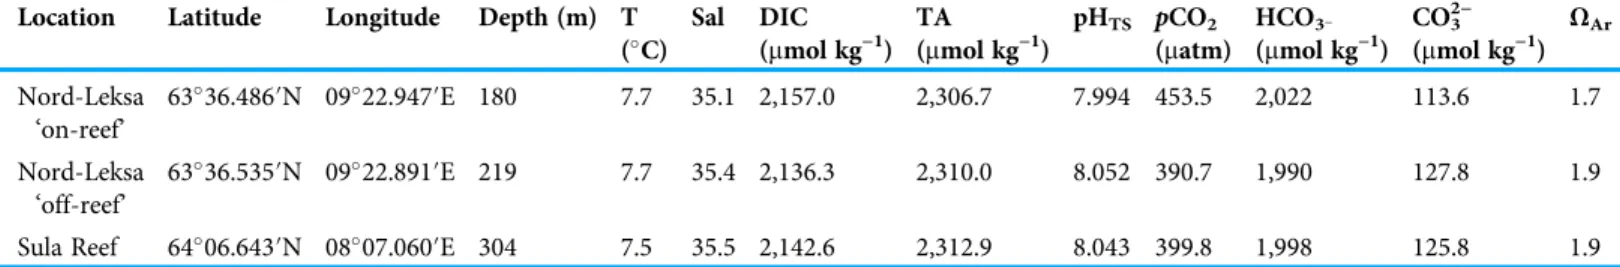
Table 4 Carbonate chemistry and physical seawater properties at three deployment locations (inshore at two sites in the Trondheimsfjord (Leksa on- and off-reef) and offshore at the Sula Reef).Environmental seawater properties measured from samples taken directly at the coral cages deployment sites at the time of recovery in 2014. Water samples were collected by means of the NISKIN bottle of JAGO for measurements of total alkalinity (TA) and dissolved inorganic carbon (DIC) (inmmol per kg seawater). Physical seawater parameters (temperature (T) and salinity (Sal)) were measured with a CTD attached to JAGO (GEOMAR Helmholtz-Zentrum für Ozeanforschung, 2017). Remaining carbonate chemistry parameters (pCO2, bicarbonate (HCO3−), carbonate (CO32−), and the aragonite saturation (ΩAr)) were computed with CO2SYS.
Location Latitude Longitude Depth (m) T (C)
Sal DIC (mmol kg−1)
TA (mmol kg−1)
pHTS pCO2
(matm)
HCO3−
(mmol kg−1) CO32−
(mmol kg−1) ΩAr
Nord-Leksa
‘on-reef’ 6336.486′N 0922.947′E 180 7.7 35.1 2,157.0 2,306.7 7.994 453.5 2,022 113.6 1.7
Nord-Leksa
‘off-reef’
6336.535′N 0922.891′E 219 7.7 35.4 2,136.3 2,310.0 8.052 390.7 1,990 127.8 1.9
Sula Reef 6406.643′N 0807.060′E 304 7.5 35.5 2,142.6 2,312.9 8.043 399.8 1,998 125.8 1.9
between the Leksa on-reef location and the Sula Reef (p= 0.006; One-Way ANOVA;
Table 5;Fig. 10).
Similar to the growth rates of living corals, bioerosion as well as accretion rates showed the highest variability of rates (highest SD of the mean) at the on-reef location.
Conversion factors
We used various methods for growth rate measurements as well as for the normalisation of the different variables, and are thereby able to provide conversion factors for coral growth in size and weight and for the standardisation of these data (Table 6). Since there were no statistically significant differences between colourmorphs and locations, conversion factors for growth rates based on differences in buoyant weight or linear extension rates as well as buoyant weight vs. dry weight, dry weight vs. volume and surface area, and weight, volume or surface area vs. number of polyps were averaged across all samples of live corals. Weight, size, and polyp number correlated well (R2ranging from 0.616 to 0.999).
DISCUSSION
In this in situ study, net growth- as well as bioerosion rates from environmentally contrasting cold-water coral ecosystems were obtained in a 1 year experiment in a Norwegian fjord and open shelf coral reef environment in the Northeast Atlantic using complementing established standard methods. In situ net calcification rates of healthy calcifying livingL. pertusaof different morphological structure and colour were
0.011% d−1on average over three different reef sites. Bioerosion rates of dead erect coral framework averaged−0.002% d−1(−12.37 g m−2yr−1) of the same reef habitats
(disregarding the relatively high accretion rates of epibionts). Calculating a net production rate of accretion and bioerosion of live and dead coral fragments of this experiment is not legitimate, as here two different sample sizes are compared. For this reason we refrained from adding up calcification rates of living corals and erosion rates of dead coral
framework, since the obtained rates do not reflect the actual reef carbonate budget, which would demand the determination of the proportions of live and exposed dead coral framework in a given reef. However, considering that bioerosion rates amounted to one fifth to one sixth of calcium carbonate loss compared with the production rates through
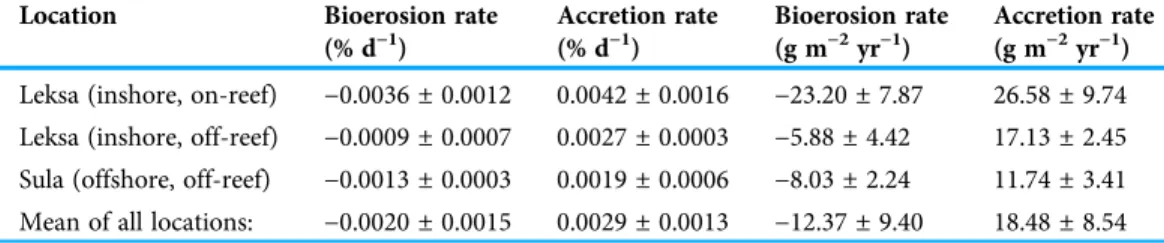
Table 5 Bioerosion and carbonate accretion rates of the dead coral framework over 1 year experimental duration at one offshore and two inshore deployment sites.Rates are given in per- cent bioerosion as well as carbonate accretion per day (% d−1), and in grams per coral framework surface and year (g m−2yr−1). Data are presented as replicate means ± standard deviation for all three locations (Leksa on-reef, Leksa off-reef, Sula Reef).
Location Bioerosion rate
(% d−1)
Accretion rate (% d−1)
Bioerosion rate (g m−2yr−1)
Accretion rate (g m−2yr−1) Leksa (inshore, on-reef) −0.0036 ± 0.0012 0.0042 ± 0.0016 −23.20 ± 7.87 26.58 ± 9.74 Leksa (inshore, off-reef) −0.0009 ± 0.0007 0.0027 ± 0.0003 −5.88 ± 4.42 17.13 ± 2.45 Sula (offshore, off-reef) −0.0013 ± 0.0003 0.0019 ± 0.0006 −8.03 ± 2.24 11.74 ± 3.41 Mean of all locations: −0.0020 ± 0.0015 0.0029 ± 0.0013 −12.37 ± 9.40 18.48 ± 8.54