Paleoseawater density reconstruction and its
implication for cold-water coral carbonate mounds in the northeast Atlantic through time
Andres Rüggeberg1,2,3, Sascha Flögel2, Wolf-Christian Dullo2, Jacek Raddatz2,4, and Volker Liebetrau2
1Unit of Earth Sciences, Department of Geosciences, University of Fribourg, Fribourg, Switzerland,2GEOMAR Helmholtz Centre for Ocean Research Kiel, Kiel, Germany,3Renard Centre of Marine Geology, Ghent University, Gent, Belgium,4Now at Institute of Geosciences, Goethe University Frankfurt, Frankfurt am Main, Germany
Abstract
Carbonate buildups and mounds are impressive biogenic structures throughout Earth history.In the recent NE Atlantic, cold-water coral (CWC) reefs form giant carbonate mounds of up to 300 m of elevation. The expansion of these coral carbonate mounds is paced by climatic changes during the past 2.7 Myr. Environmental control on their development is directly linked to controls on its main constructors, the reef-building CWCs. Seawater density has been identified as one of the main controlling parameter of CWC growth in the NE Atlantic. One possibility is the formation of a pycnocline above the carbonate mounds, which is increasing the hydrodynamic regime, supporting elevated food supply, and possibly facilitating the distribution of coral larvae. The potential to reconstruct past seawater densities from stable oxygen isotopes of benthic foraminifera has been further developed: a regional equation gives reliable results for three different settings,peak interglacials(e.g., Holocene),peak glacials(e.g., Last Glacial Maximum), andintermediatesetting (between the two extremes). Seawater densities are reconstructed for two different NE Atlantic CWC carbonate mounds in the Porcupine Seabight indicating that the
development of carbonate mounds is predominantly found at a seawater density range between 27.3 and 27.7 kg m3(σΘnotation). Comparable to recent conditions, we interpret the reconstructed density range as a pycnocline serving as boundary layer, on which currents develop, carrying nutrition and possibly coral larvae. The close correlation of CWC reef growth with reconstructed seawater densities through the Pleistocene highlights the importance of pycnoclines and intermediate water mass dynamics.
1. Introduction
Cold-water coral (CWC) reefs are spectacular marine ecosystems [e.g.,Freiwald et al., 2004], promoting high biodiversity and a high density of marine life almost comparable to shallow-marine tropical reefs. These pro- minent systems are under varying degrees of pressure due to bottom trawling, hydrocarbon extraction, deep-sea mining and bio prospecting, bottom water warming, and ocean acidification [European Commission, 2007;Intergovernmental Panel on Climate Change, 2014]. The European continental margin is known for its high density of CWC reefs [Roberts et al., 2006]. In the Porcupine Seabight along the margin off SW Ireland these CWC reefs form carbonate mounds, which occur in distinct provinces [Henriet et al., 1998;Dorschel et al., 2010] (Figure 1). IODP Expedition 307 drilled through Challenger Mound and indicates earliest CWC growth at 2.5–2.7 million years ago (Ma) [Kano et al., 2007], while later studies assume a slightly earlier initiation between 2.7 Ma and 3 Ma [Foubert and Henriet, 2009;Raddatz et al., 2011, 2014;Thierens et al., 2013].
The geographical distribution and sustained development of CWC reefs have proven to be strongly related to climate influences over the past three glacial-interglacial cycles [Frank et al., 2011]. More important for the carbonate mounds, the formation of CWC reefs strongly relies on the sediment baffling capacity of their major frame builders, the azooxanthellate cold-water corals Lophelia pertusa and Madrepora oculata.
Further physical and chemical parameters like temperature, nutrition, currents, and the existence of a well- expressed pycnocline (density gradient) have been identified as important drivers of environmental control for these CWC ecosystems during past glacial-interglacial times [e.g.,Dorschel et al., 2005;Roberts et al., 2006;
Rüggeberg et al., 2007; Wienberg et al., 2010]. More recently, different studies report of the possible significance of seawater carbonate parameters like dissolved inorganic carbon, pH, total alkalinity, aragonite saturation (Ωaragonite), pCO2, [HCO3], and [CO32] on the growth of different CWC species and their
Paleoceanography
RESEARCH ARTICLE
10.1002/2015PA002859
Key Points:
•Regional seawater density reconstruction for the NE Atlantic during the Pleistocene
•Cold-water coral carbonate mounds in relation to seawater density during the Pleistocene
•Importance of intermediate water mass dynamics on cold-water coral ecosystems
Supporting Information:
•Supporting Information S1
Correspondence to:
A. Rüggeberg,
andres.rueggeberg@unifr.ch
Citation:
Rüggeberg, A., S. Flögel, W.-C. Dullo, J. Raddatz, and V. Liebetrau (2016), Paleoseawater density reconstruction and its implication for cold-water coral carbonate mounds in the northeast Atlantic through time, Paleoceanography,31, 365–379, doi:10.1002/2015PA002859.
Received 14 JUL 2015 Accepted 22 FEB 2016
Accepted article online 26 FEB 2016 Published online 12 MAR 2016
©2016. American Geophysical Union.
All Rights Reserved.
distribution [e.g.,Maier et al., 2011;Form and Riebesell, 2012;Thiagarajan et al., 2013;Flögel et al., 2014].
However, as corals also depend on particulate organic matter and zooplankton as prime nutrition, it was argued that their distribution along the European continental margin follows distinct water mass signatures and their dynamical regimes [Freiwald, 2002;De Mol et al., 2002, 2005;White, 2007]. Detailed regional and local oceanographic studies have shown the significance of physical parameters on living CWC reef occur- rences [Davies et al., 2008;White and Dorschel, 2010] among which the potential seawater density (σΘ) refer- enced to the surface appears to be a key factor [Dullo et al., 2008]. At present, all prolific growing CWC reefs (Category I in the sense ofFlögel et al. [2014]) along the European continental margin from the Iberian margin (42°N), the Porcupine Seabight (50°N), to northern Norway (70°N) are found in a density range ofσΘ= 27.35– 27.65 kg m3[De Mol et al., 2011;Flögel et al., 2014;Somoza et al., 2014;Sánchez et al., 2014]. This density range is also characterized by a steep gradient, which is an increase in seawater density within a short bathy- metric range [Dullo et al., 2008;Hebbeln et al., 2014], favoring the widespread development of nepheloid layers [Dickson and McCave, 1986;Rice et al., 1991;Mazzini et al., 2012]. Due to this pycnocline, horizontal cur- rents develop and internal waves may propagate carrying nutrition and may even influence the distribution of larvae [Dullo et al., 2008;Henry et al., 2014]. Past variations of seawater density, especially across glacial- interglacial cycles, have been documented by, e.g.,Dokken and Jansen[1999],Lynch-Stieglitz et al. [1999a, 1999b], orPeck et al. [2006] indicating a dynamic and variable environment at depths.
The aim of this study is (1) to test regionally calibrated equations to reconstruct seawater densities following the method ofLynch-Stieglitz et al. [1999a, 1999b] and based on this (2) to test whether CWC mound growth during the past also occurred in similar seawater densities as today. To answer these questions, we analyzed sediment Figure 1.Locations of investigated carbonate mounds, intermediate water mass circulation, and carbonate mound pro- vinces (grey areas) within the Porcupine Seabight. Depth lines correspond to 200 m intervals, PB = Porcupine Bank, PSB = Porcupine Seabight, RB = Rockall Bank. Sketch illustrates present water mass configuration along the slopes of the Porcupine Seabight or Bank (not to scale). Eastern North Atlantic Water (ENAW, blue) overlies Mediterranean Outflow Water (MOW, green). The position of the pycnocline (σΘ= 27.5) varied during the past ~3 Myr being shallower during peak glacial (e.g., Last Glacial Maximum) or deeper during peak interglacial periods (e.g., Holocene and Marine Isotope Stage 5.5) or in times before the Northern Hemisphere glaciation (>2.7 Ma).
cores and reconstructed seawater densities from two different and well-studied carbonate mounds; Propeller Mound of the Hovland mound province, northern Porcupine Seabight [e.g., Dorschel et al., 2005, 2007;
Rüggeberg et al., 2005, 2007; Beuck and Freiwald, 2005; Heindel et al., 2010; Schönfeld et al., 2011], and Challenger Mound of the Belgica mound province, eastern Porcupine Seabight [e.g., Foubert et al., 2005;
Williams et al., 2006;Kano et al., 2007;Thierens et al., 2010;Titschack et al., 2009] (Figure 1).
2. Approach
2.1. Age Determination and Stratigraphic Framework 2.1.1. Sample Preparation
In several depth intervals of core GeoB 6730-1 coral fragments ofLophelia pertusawere selected to determine absolute age data using the U/Th isotope systematic of the aragonite skeleton. The selection followedfirst interpretations of sedimentological data and stable isotopes on foraminifera [Dorschel et al., 2005;
Rüggeberg et al., 2007] and before or after identified hiatuses [Dorschel et al., 2005]. All coral samples werefirst rigorously mechanically cleaned with dental-technical driller and abrasion tools down to millimeter-sized fragments of massive aragonitic internal skeleton parts and repeatedly ultrasonified in MQ-water (>18 MΩ) in order to remove remnants of exterior contaminants (sediments, iron-manganese crusts, and coatings). Each precleaned fragment was bathed in 50/50 mixture of 30% H2O2and 1MNaOH and MQ-water alternately for 15 min with ultrasonification [Cheng et al., 2000a]. This procedure was performed up to three times to ensure high removal rates for particles, organic stains, and oxides potentially left after mechanical procedure on the coral and within the open pore space surfaces. However, the last HClO4 cleaning step described byCheng et al. [2000a] was skipped due to the related risk of increased sample loss on small frag- ments. Before element separation, all samples were checked again for the cleanness and purely aragonitic crystal structures under the binocular. Element separation procedure was based on Eichrom-UTEVA resin (according to manufacturer notes andFietzke et al. [2005]).
X-ray diffraction (XRD) on selected samples additionally helped to determine calcite content to be below the detection limit (<2%, defined by an artificial calibration mixture). All subsamples for XRD measurements were taken with a microdriller from freshly cut surfaces of cleaned fragments ofL.pertusa, after discardingfirst drill steps as additional surface cleaning procedure.
2.1.2. Uranium-Series Geochronology
Uranium-series measurements for U/Th coral ages were performed at GEOMAR Helmholtz Centre for Ocean Research Kiel, Germany, on a Finnigan MAT 262 RPQ+ (Mat262), a Thermo-Finnigan Triton-RPQ (Triton) ther- mal ionization mass spectrometer (TIMS), and a VG Axiom multicollector inductively coupled plasma mass spectrometer (MC-ICP-MS) applying lab procedures and methods ofFietzke et al. [2005] andEdwards et al.
[1986], and decay constants ofCheng et al. [2000b]. Sample 6730/108 (Table S1 in the supporting informa- tion) is measured twice for Th with MC-ICP-MS in independent sessions (Axiom 1 and 2) and for U with TIMS (MAT262 and Triton) and MC-ICP-MS as well. The resulting mean value of multiple measurements reflects reproducibility and robustness of applied methods.
For isotope dilution measurements a combined233/236U/229Th spike was used, with stock solutions calibrated for concentration using NIST-SRM 3164 (U) and National Institute of Standards and Technology-Standard Reference Material (NIST-SRM) 3159 (Th), as combi-spike calibrated against CRM-145 uranium standard solu- tion (also known as NBL-112A) for U isotope composition and against a secular equilibrium standard (HU-1, uranium ore solution) for determination of230Th/234U activity ratio. Characteristic whole procedure blanks at time of sample preparation were around 14 to 60 pg for U, 6 to 9 pg for232Th, and 0.5 to 5 fg for230Th.
Calculation of geochronological data and activity ratios is based on the decay constants published by Cheng et al. [2000b] (further details, see supporting information).
The applied data reduction includes a correction for isotopic composition of incorporated Th of detrital ori- gin, according to continental crust values [Wedepohl, 1995] as approximation for potentially involved shelf sediments (details given in Table S1 in the supporting information). In most cases this correction is negligible due to sufficiently high230Th/232Th activity ratios and low Th concentrations in the corals. Due to the gener- ally high ages in this sample set, the impact of age correction on the interpretation ofδ234U values is signifi- cant and criteria for isotopic reliability of230Th age data may be applied. Recent reef forming cold-water corals showed within their uncertainties similarδ234U(0) values of 145.5 ± 2.3‰ [Cheng et al., 2000a] and
146.3 ± 3.9‰[Liebetrau et al., 2010] for different depth and location, supporting the application of theδ234U
(T)reliability criteria presented for cold-water corals by different studies (e.g., 145.5–148.3‰:Robinson et al.
[2004]; 146.2 ± 3.4‰:Frank et al. [2004]; 146 ± 7‰:López Correa et al. [2012],McCulloch et al. [2010], and Robinson et al. [2007]; 146 ± 15‰:Eisele et al. [2011]).Wienberg et al. [2010] used the criteria in the style of Blanchon et al. [2009] but for CWC with strictly reliable (SR) forδ234U(T)= 146.6–149.6‰, reliable (R) for δ234U(T)= 149 ± 10‰, and not reliable (NR) forδ234U(T)values below 139‰and above 159‰. We also follow these criteria in this study (Figure S1 and Table S1).
Regarding the application ofδ234U(T)reliability criteria on U-Th data sets of CWCs covering interglacial and glacial time intervals, a constant and homogeneousδ234U value throughout the water column and across major changes in continental runoff is a prerequisite. Noteworthy, only a few data points from glacial periods have been reported suggesting initial δ234U(T) was as low as 136‰ during most of the past glaciation [Thompson et al., 2003]. However, the majority of ourδ234U(T) data set is in general accordance with the published reliability criteria. Due to sorrowful selection of massive and pristine appearing coral fragments combined with rigorous cleaning procedures, 9 of 11 analyzed samples reached the reliable (“R”) or even strictly reliable (“SR”) level (Table S1) and could be considered for geochronological interpreta- tion (Figure 4). The two samples with clearly deviating values of 119 and 164‰(Table S1 and Figure S1), respectively, provide data set integrity and are regarded as examples for the diagenetic impact of carbonate-rich fluids potentially percolating within the porous mound structures around buried reef fragments. Four samples (6730-1: 18 cm, 68 cm, 178 cm, and 318 cm) are characterized by elevated Th concentrations (>50 ppb) and consequently accompanied by slightly enlarged age uncertainty and reduced age reliability. Conservatively, these dates should be considered as maximum ages.
Due to two observations and its general importance, the highest age of the record determined for 318 cm core depth (sample 6730-1/318, 296 ± 18 kyr B.P.) is given in italics (1) but still considered (2) in Figure 4 and discussed in detail below:
1. Itsδ234U(T)value of 139.4 ± 9.9‰is slightly to low and reaches the highest quality level SR only by taking the unusual large uncertainty into account. The latter is mainly introduced by the high Th content (>100 ppb) and the subsequently high impact of the error propagation from the uncertainty of detrital correction (sup- porting information Text S1) on the U-Th age (T), providing the basis for theδ234U(T)calculation.
2. The calculation of the completely Th independent234U excess age, considering an initialδ234U(T)value of 146 ± 2‰of modern seawater [Henderson and Anderson, 2003] as reasonable starting point, ends up in an age of 314 ± 15 kyr B.P., overlapping with the U-Th age at similar precision. This age corresponds to the time span required for the decay of the unsupported (excess)234U of the initially incorporated U down to the today measured234U/238U activity ratio and is determined by (T= (1/λ234U) × LN (δ234U(modern sea- water)/δ234U(sample measured))).
In addition to this less precise but robust accordance of two chronometer, the slightly lowδ234U(T)of the U-Th age could be interpreted following suggestions inThompson et al. [2003] concerning glacial periods which may provide lower δ234U values when compared to interglacial and modern ocean signatures.
Consequently, theδ234U(T)reliability criteria applied byWienberg et al. [2010] for CWC andBlanchon et al.
[2009] for tropical corals would be not perfectly adequate or even misleading for samples of marine glacial carbonates. However, the remarkable age around 300 kyr is pointing to cold-water coral growth at the transi- tion from the late MIS 9 (9.1) interglacial to the early MIS 8 (8.4) glacial period. Due to the slight difference between the mean U-Th and234U(exc.)ages and their range of uncertainty, a clear discrimination between both stages cannot be given based on the actual data set.
Independently and by far more precise, the U-Th age of 176 ± 3 kyr B.P. at 178 cm core depth is reflecting CWC growth at early MIS 6.5 according the LR04 stack [Lisiecki and Raymo, 2005]. However, the 178 cm data do not reflect any indication of lowerδ234U values (149.8 ± 3.4‰δ234U(T)) as suggested for glacial periods [Thompson et al., 2003].
2.1.3. Stratigraphic Framework
Absolute ages of CWCL.pertusaand additional U/Th dates of corals and AMS14C dates from sediments of Propeller Mound, Galway Mound, and Challenger Mound were collected from published studies [Dorschel et al., 2005;Eisele et al., 2008;Frank et al., 2011;Raddatz et al., 2014] (Table 1) and used to identify phases of carbonate mound growth and decline in comparison to the LR04 marine isotope stack ofLisiecki and
Table1.AgeData,Correspondingδ18 OCValues,andCalculatedSeawaterDensitiesa SampleDepth (cm)Age (kyrB.P.)Error (kyr)ReferenceMethodδ18 OC (‰VPDB)Reference
Seawater Density(kg/m3 ) Interglacial Equation(3)Intermediate Equation(7)Glacial Equation(6) HMPBW0–Thisstudy–1.48b Thisstudy27.427.226.6 BMPBW0–Thisstudy–1.68b Thisstudy27.527.326.8 IODP1317C101.20.1Raddatzetal.[2014]CoralU-Th1.33Raddatzetal.[2011]27.227.126.4 GeoB6730-131.90.1ThisstudyCoralU-Th1.49Dorscheletal.[2005]27.427.226.6 GeoB6730-1234.50.1Dorscheletal.[2005]Sed-14C1.5Dorscheletal.[2005]27.427.226.6 GeoB6730-1185.20.1ThisstudyCoralU-Th1.45Dorscheletal.[2005]27.327.126.5 GeoB9223-11685.50.1Franketal.[2011]CoralU-Th1.55Eiseleetal.[2008]27.427.226.6 GeoB9214-11787.30.1Eiseleetal.[2008]Sed-14C1.56Eiseleetal.[2008]27.427.226.7 GeoB9213-11438.30.1Eiseleetal.[2008]Sed-14C1.57Eiseleetal.[2008]27.427.226.7 GeoB9214-12138.70.1Eiseleetal.[2008]Sed-14C1.44Eiseleetal.[2008]27.327.126.5 GeoB9214-11808.70.2Franketal.[2004]CoralU-Th1.66c Eiseleetal.[2008]27.527.326.8 GeoB9213-11509.20.2Franketal.[2004]CoralU-Th1.58d Eiseleetal.[2008]27.427.226.7 GeoB6719-19818.60.6Dorscheletal.[2005]Sed-14C3.54Dorscheletal.[2005]28.327.728.0 GeoB6725-116823.50.8Dorscheletal.[2005]Sed-14C3.61Dorscheletal.[2005]28.327.728.0 GeoB6719-116325.41Dorscheletal.[2005]Sed-14C3.45Dorscheletal.[2005]28.327.728.0 GeoB6719-127330.80.7Dorscheletal.[2005]Sed-14C3.13Dorscheletal.[2005]28.227.727.8 GeoB6729-123551Dorscheletal.[2005] andthisstudyCoralU-Th2.85Dorscheletal.[2005]28.127.627.7 GeoB6730-168972ThisstudyCoralU-Th2.21Dorscheletal.[2005]27.827.527.2 GeoB6730-158991ThisstudyCoralU-Th1.84Dorscheletal.[2005]27.627.326.9 IODP1317C4751051Raddatzetal.[2014]CoralU-Thn.d.–––– GeoB6730-11081112ThisstudyCoralU-Th2.27Dorscheletal.[2005]27.927.527.3 GeoB6730-11081121ThisstudyCoralU-Th2.27Dorscheletal.[2005]27.927.527.3 GeoB6730-11081121ThisstudyCoralU-Th2.27Dorscheletal.[2005]27.927.527.3 GeoB6730-11081121ThisstudyCoralU-Th2.27Dorscheletal.[2005]27.927.527.3 GeoB9214-12811291Franketal.[2011]CoralU-Th1.68Eiseleetal.[2008]27.527.326.8 GeoB6728-131523Dorschel etal.[2005] andthisstudy
CoralU-Th3.27Dorscheletal.[2005]28.327.727.9 GeoB6730-11781763ThisstudyCoralU-Th2.43Dorscheletal.[2005]28.027.627.4 GeoB6729-1731844Dorscheletal.[2005] andthisstudyCoralU-Th3.06Dorscheletal.[2005]28.227.727.8 GeoB6728-1831934Dorscheletal.[2005] andthisstudyCoralU-Th3.28Dorscheletal.[2005]28.327.727.9 GeoB6730-12382045ThisstudyCoralU-Th2.25Dorscheletal.[2005]27.727.527.3 GeoB6728-12182296Dorscheletal.[2005] andthisstudyCoralU-Th2.47Dorscheletal.[2005]28.027.627.4 GeoB6730-12732406ThisstudyCoralU-Th1.78e Dorscheletal.[2005]27.627.326.9 GeoB9214-13782699Franketal.[2004]CoralU-Th1.39Eiseleetal.[2008]27.327.126.5 GeoB9213-13852775Eiseleetal.[2008]CoralU-Th2.28f Eiseleetal.[2008]27.927.527.3 GeoB6730-131829618ThisstudyCoralU-Th2.89Dorscheletal.[2005]28.227.627.7 GeoB6728-136830011Dorscheletal.[2005] andthisstudyCoralU-Th1.72Dorscheletal.[2005]27.527.326.8 GeoB9213-146230012Eiseleetal.[2008]CoralU-Th1.69g Eiseleetal.[2008]27.527.326.8 IODP1317C2,01838625Raddatzetal.[2014]CoralU-U1.91Raddatzetal.[2011]27.727.427.0 IODP1317C2,27442637Raddatzetal.[2014]CoralU-U2.33Raddatzetal.[2011]27.927.527.3 IODP1317C2,8691,670+220/-150Raddatzetal.[2014]Coral87/88 Sr2.44Raddatzetal.[2011]28.027.627.4
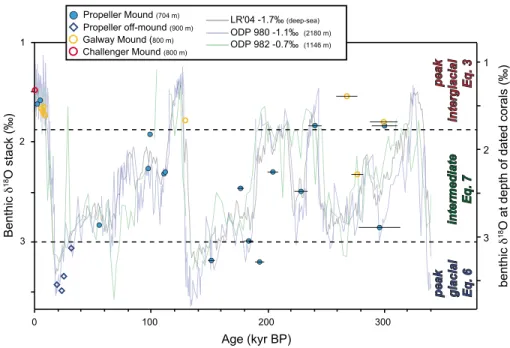
Raymo[2005] (Figure 2). Stable oxygen isotope values for the absolutely dated corals derive from calcite tests of epi- benthic foraminifera (δ18OC) from the same depth interval of the coral within the core (Table 1 and Figure 2). We use the generalized glacial-interglacial cycles as consisting of three quite distinct settings (peak interglacial,peak glacial, andintermediate settings, Figure 2), similar to other studies [e.g.,Peacock et al., 2006]. Peak glacial corresponds to the Last Glacial Maximum (LGM) and similar periods of low sea level stand, cold conditions, and high sediment input with typical benthicδ18OCvalues of>3.2‰for the study area.
Peak interglacial periods are those such as the Holocene, where sea level was high, warm conditions prevailed and benthicδ18OCvalues of<1.9‰are common. Theinter- mediatestage corresponds to the periods between peak glacial and peak interglacial phases, roughly the moderate glacial and interglacial phases as well as the interstadials (warm glacial periods), where benthicδ18OC values lay between 1.9 and 3.2‰(Figure 2).
2.1.4. Error Analysis
One source of errors is the uncertainty between sediment and coral age. Especially at hiatuses strong mixing of sedi- ment averages time, which can attain several millennia [López Correa et al., 2012]. Age differences reported from carbonate mounds of the Rockall Bank and Porcupine Seabight are generally ~ 500–1000 years, occasionally up to 2000 years [Lutringer et al., 2005; Eisele et al., 2008;
Mienis et al., 2009;de Haas et al., 2009]. These differences are within the age uncertainty of investigated samples older than 50 ka (Table 1). Only one larger age difference of ~ 40 kyr (AMS14C age of 45 ka compared to U-Th date of 93 ka) has been published so far from sediments cover- ing a big hiatus [Dorschel et al., 2005]. This has been inter- preted by enhanced coral growth supported by strong currents followed by a period with weaker currents allow- ing the deposition of fine sediments among the older coral framework. Therefore, for data close to a hiatus pos- sible large age offsets should be taken into consideration.
The presented data set in Figure 2 exhibits only one sam- ple at 269 ka, which does notfit to the oxygen isotope record (offset ~1.5‰) implying a hiatus as a result of reworking. All other samples, however,fit to the curve of LR04, even in older parts within the error bars (Figure 2).
2.2. Determination of Past Seawater Density In order to determine past seawater densities, we followed the established approach ofLynch-Stieglitz et al. [1999a, 1999b], using stable oxygen isotopes of calcite tests (δ18OC) of epibenthic foraminifera from carbonate mound sediments. This reconstruction is based on the fact that a change of seawater density andδ18OCis driven by two independent parameters: salinity (evaporation and preci- pitation) and temperature (ice volume). The dependency of seawater density on salinity and temperature is
Table1.(continued) SampleDepth (cm)Age (kyrB.P.)Error (kyr)ReferenceMethodδ18 OC (‰VPDB)Reference
Seawater Density(kg/m3 ) Interglacial Equation(3)Intermediate Equation(7)Glacial Equation(6) IODP1317C14,5692,930+1260/-530Raddatzetal.[2014]Coral87/88 Sr1.95h Raddatzetal.[2011]27.727.427.0 a Datacompilationofcoralages(CoralU-Th,U-U,87/88 Sr)onLopheliapertusaandsedimentages(Sed-14C)withcorrespondingδ18 OCvaluesofbenthicforaminifera(seeFigure2)andcalculated potentialseawaterdensitiesusingequationsforpeakinterglacial(equation(3)),peakglacial(equation(6)),andintermediate(equation(7))settings.Boldnumberscorrespondtoacceptedvalues forthetimeperiodandequationused.HMP=HovlandMoundProvince,BMP=BelgicaMoundProvince,BW=bottomwater. b Reconstructedδ18 OCusingrelationofMarchittoetal.[2014](equation(2))andownδ18 OSW,salinity,andtemperaturedata. c δ18 OCvaluefrom183cmcoredepth. d δ18 OCvaluefrom148cmcoredepth. e δ18 OCvaluefrom268cmcoredepth. f δ18 OCvaluefrom388cmcoredepth. g δ18 OCvaluefrom463cmcoredepth. h δ18 OCvaluefrom14565cmcoredepth.
assumed to be constant throughout the oceans and geological time [Lynch-Stieglitz et al., 1999a]. Eight different equations were proposed to reconstruct paleoseawater densities fromδ18OCaccounting for different oceano- graphic settings and temperature regimes [Lynch-Stieglitz et al., 1999b]. Based on these equations, we devel- oped regionallyfitted equations for the Porcupine Seabight using bottom water temperature, salinity, seawater density, and stable oxygen isotope data of seawater (δ18OSW) from research cruises with R/V METEORM61/1 and M61/3, R/VPOSEIDONP316, and data from the Global Seawater Oxygen 18 Database [Schmidt et al., 1999]. Recent δ18OSW to salinity (S) relationship (Figure S2 and Table S2) for the Porcupine Seabight is expressed in equation (1) (Figure 3a):
δ18OSW¼0:446S15:39 R2¼0:44 (1)
FollowingLynch-Stieglitz et al. [1999b] we calculatedδ18OCusing the recently developedδ18OC/δ18OSW-tem- perature relation ofMarchitto et al. [2014]. This equation is based on the calibration ofCibicidesandPlanulina δ18OCdata from Atlantic, Pacific, and Arctic sites covering a temperature range of1 to +26°C given in equa- tion (2) for recent values:
δ18OC¼ δ18OSW0:27
0:224Tþ3:53 R2¼0:99 (2) The present-day, regional (PSB)δ18OSW and temperature data (Table S2) were used to determineδ18OC values, which are in good agreement with recent epibenthicδ18OCvalues. Therefore, we also used this equa- tion to estimate temperature ranges for the investigated time intervals (see supporting information Text S3 and Tables S4 and S5). The recent calculatedδ18OCand measuredσΘvalues give the relation expressed in equation (3), which we applied for the reconstruction of seawater densities for the Holocene and equivalent peak interglacial periods (see Figure 3b):
σΘ¼25:86þ1:23δ18OC0:15δ18OC2 R2¼0:91 (3) Difference between calculated and measured seawater densities for the recent calibration is relatively small with ±0.06 kg m3(Table S2).
Figure 2.Comparison ofδ18OCof benthic foraminifera at depths of U-Th dated coral fragments (L.pertusa) and AMS14C dated sediments (Last Glacial Maximum) from different carbonate mounds (700–800 m water depths) of the past 300 kyr with benthicδ18O records ofLisiecki and Raymo[2005] (black curve), ODP Leg 980 from 2180 m water depth [Oppo et al., 2006] (blue curve), and ODP Leg 982 from 1146 m water depths [Venz et al., 1999] (green curve). Please note that these records are adjusted by1.7,1.1, and0.7‰, respectively, to align with the core data from the Porcupine Seabight. Age uncertainty is smaller than the symbol for ages<130 ka or indicated by horizontal bars (>MIS 6), precision ofδ18OCdata is 0.07‰. Horizontal dotted lines indicate the division into peak glacial, intermediate, and peak interglacial settings with their respective equations (further details, see text).
Forpeak glacialssuch as the Last Glacial Maximum (LGM) we derived temperatures (TLGM) and salinities (SLGM) from model data (PMIP2 HadCM3M2,Braconnot et al. [2007], and Table S3) and calculated seawater densities (σΘ-LGM). We usedSLGMdata and applied equation (1) to determineδ18OSW-LGM, which was corrected by 0.75‰following the considerations ofSchrag et al. [2002] (Figure 3a):
δ18OSW-LGM¼0:446SLGM½15:39þ0:75 (4) Consequently,δ18OC-LGMwas determined using equation (2) but for LGM values:
δ18OC-LGM¼ δ18OSW-LGM0:27
0:224TLGMþ3:53 (5) Analogously to equation (3) we derived seawater densities fromδ18OC-LGMto determine the relation between δ18OC-LGMandσΘ-LGMgiven in equation (6) (Figure 3b):
σΘ-LGM¼24:80þ1:41δ18OC0:14δ18OC2 (6) Modeled LGM seawater densities at 667 m of 27.7 kg m3(Table S3) are slightly lighter but also shallower and from different age compared to the reconstructed values based onδ18OC-LGMof 28.0 at 760 m (18.6 kyr B.P.) and 28.1 kg m3at 820 m (23.5 kyr B.P.), respectively (Table 1).
For the intermediate time intervals we developed a best estimate equation (equation (7)). This equation is a rea- sonable estimation comparable to the Global Open Ocean calibration or its modifications with 4‰higher fresh end-member ofLynch-Stieglitz et al. [1999b]. Since there are no local and regional transient model data covering the interval available for temperature and salinity nor equivalent proxy-based calculations for the depth interval of interest, this best nonlinear estimate links the defined warm and cold end-member estimates (Figure 3b):
σΘ-Intermediate¼26:0þ1:0δ18OC0:15δ18OC2 (7) The onset of mound growth ~2.7 Ma coincides with the beginning of the Northern Hemisphere glaciation [Haug and Tiedemann, 1998]. This early phase of mound growth, however, was characterized by oceano- graphic and climatic conditions close to those of interglacials [Thierens et al., 2010;Raddatz et al., 2011], with most of theδ18OCvalues correlating with the upper range of our intermediate setting [Lisiecki and Raymo, 2005, 2007]. Therefore, we use equation (7) for paleoseawater reconstruction of carbonate mound develop- ment back to the early initiation at around 2.7 Ma. We applied the same equation to the Miocene sediments below the mound base for comparative reason. However, the method for reconstructing seawater densities as described byLynch-Stieglitz et al. [1999b] might not be applicable for middle Miocene sediments and should be therefore treated with caution.
b) a)
Figure 3.(a)δ18OSW-salinity relation for the recent Porcupine Seabight in comparison with GEOSECS stations (from Global Seawater Oxygen-18 Database) [Schmidt et al., 1999] and the regional Last Glacial Maximum (LGM)δ18OSW-salinity relation (see text for detailed explanation). (b) Regionalδ18OC-potential seawater density relation forpeak interglacials(based on the recent calibration,<1.8‰), peak glacials (based on LGM calibration,>3‰), and intermediate for the times between peak glacials andinterglacials(see Figure 2) in comparison to relations determined byLynch-Stieglitz et al. [1999b] of Global Open Ocean calibration (equation (2)) or its modifications with 4‰higher fresh end-member (equation (7)).
The relation between seawater density and CWC growth is interpreted only on larger time scales, especially taking the large age error at mound initiation based on Sr-isotope stratigraphy into account, which does not allow the discussion on small time scales and in high resolution, yet. Investigated sediment core of Propeller Mound covers the past ~300 kyr while samples of IODP 307 Site U1317C on Challenger Mound have a middle Miocene age below the mound base and a late Pliocene/early Pleistocene age of ~2.7 Ma above the mound base [Kano et al., 2007;Raddatz et al., 2014]. The error for paleoseawater densities is relatively low due to the combined effect of temperature and salinity onδ18OC. At higher temperatures, lines of constantδ18Ocand lines of constant potential density anomaly are roughly parallel [Lynch-Stieglitz et al., 1999b], but deviation between the lines increases with decreasing temperature, especially below 5°C. Therefore, we established a regional glacial equation (equation (6)) based on modeled data (PMIP2 HadCM3, [Braconnot et al., 2007]), which is in reasonable agreement with measuredδ18Ocof benthic foraminifera from the last glacial period, but also underlining the difficulties of reconstructions at low temperatures. The error estimate of the recent calibration is relatively small with ΔσΘ= 0.06 kg m3, but we expect a slightly larger error ofΔσΘ= 0.1– 0.15 kg m3for the paleoreconstruction.
3. Results and Discussion
3.1. Cold-Water Coral Reef Development During the Past 300,000 Years
The studied core from the top of Propeller Mound is 350 cm long. According to the U-Th geochronology of 11 CWC fragments (Lophelia pertusa), the core dates back to approximately MIS 9.1 (MIS 8.4–9.2, ~300 ka;
Figure 4a). Several well-recognized hiatuses, indicated by dashed lines in Figure 4a, comprise times of non- deposition equivalent to time intervals of no CWC reef growth and subordinate erosion [Dorschel et al., 2005]. The uppermost part represents the Holocene (MIS 1) with meanσθvalues of 27.3 kg m3, indicating a rather marginal position on the envelope defined for prolific recent CWC reef growth of category I in the sense ofFlögel et al. [2014], which is characterized by a horizontal area covered with living CWCs of several 100 m2and a distinct vertical elevation due to biogenic frame building. In the Hovland mound province Propeller Mound is situated in a slightly shallower bathymetric range (690–710 m water depths) [Rüggeberg et al., 2007] with the present-day seawater density values of 27.4 kg m3(Table S2) compared to the active coral growth in the Belgica mound province at, e.g., Galway Mound (780–950 m water depths, Dorschel et al. [2007]; present-dayσθvalues of 27.5 kg m3, Table S2). Thefirst hiatus in Propeller Mound cov- ers the time interval between MIS 2 and MIS 5.2 (Figure 4a). The section below, MIS 5.3 and 5.4, documents active CWC reef growth under reconstructedσθvalues of 27.4 kg m3. Based on our age data and the LR04 marine isotope stack [Lisiecki and Raymo, 2005], the second hiatus covers the time from MIS 5.5 to MIS 6.4.
Although MIS 6 represents a glacial period, there is one warmer phase defined as MIS 6.5 (Figure 2).
Propeller Mound recorded that specific time window by active accumulation reflecting characteristicσθ
values of 27.5 kg m3and cold-water coral growth with an age of 176 ± 3 ka at 178 cm core depth for the basal layer above another hiatus (Figure 4a). The interglacial stage of MIS 7 displays prolific CWC reef growth of more than 1 m having meanσθvalues of 27.4 kg m3back to an age of 204 ± 5 ka. Prior to this time, there is still CWC reef growth but more on a marginal position of theσθenvelope illustrated by minor coral contribu- tions to silty sediments [Rüggeberg et al., 2007]. The lowermost section of the core has a calculatedσθrange of 27.3–27.6 kg m3. The upper part, from 273 down to 318 cm, is interrupted by a hiatus around 303 cm. Below the reconstructedσθvalues have a mean of 27.6 kg m3. The U-Th systematic implies an age of cold-water coral formation around 300 ka covering (within uncertainty) the glacial/interglacial transition between MIS 9.1 and MIS 8.5 (Table S1). The corresponding core section is generally characterized by minor coral content [Rüggeberg et al., 2007] with intercalated layers enriched in small coral fragments (Figure 4a).
Based on U-Th-series ages of cold-water corals of the NE Atlantic region,Frank et al. [2011] suggested a strong climatic influence on the geographical distribution and the sustained development over the past three glacial-interglacial cycles. They showed that middepth temperatures and primary productivity might play a crucial role as drivers of these ecosystems. Rüggeberg et al. [2007] already presented the existence of a well-expressed pycnocline (density gradient) as important parameter for the CWC ecosystem. This was sub- sequently identified as an important factor in understanding the recent distribution of cold-water coral reefs in the NE Atlantic [Dullo et al., 2008;De Mol et al., 2011;Rüggeberg et al., 2011;Flögel et al., 2014] and the Gulf of Mexico [Hübscher et al., 2010;Hebbeln et al., 2014]. Here we argue that the pycnocline represented by the
density range ofσθ= 27.5 ± 0.2 kg m3also controls the development of CWC reefs and contemporaneously of the carbonate mounds during the past ~300 kyr. All paleodensity values of reef buildup phases recorded in core GeoB 6730-1 plot within or close to the modern density range of prolific CWC reef growth, with the Holocene (MIS 1) at the lighter (“warmer, more saline”) margin and MIS 6.5 and MIS 9.1 at the heavier (“colder, fresher”) one (Figure 5).
3.2. Cold-Water Coral Reef Development at the Begin of the Northern Hemisphere Glaciation At the base of Challenger Mound we investigated 10 m of IODP core U1317C representing the transition from the glauconitic siltstones of the middle Miocene to the coral-bearing, unlithified, mixed siliciclastic/pelagic-carbonate sediments [Ferdelman et al., 2006] indicating the onset of CWC reef growth at ~2.7 Ma [Kano et al., 2007;Raddatz et al., 2014] (Figure 4b). For the late Pliocene-early Pleistocene sediments of U1317C meanδ18OCvalues of 2.0
± 0.18‰correspond to the early interglacial periods (Figure 4b and Table S5). The range of these values is mainly at the lighter part of the intermediate setting (1.9–3.2‰); therefore, we applied equation (7) to reconstruct paleo- densities for the early CWC reef growth. For comparative reasons we applied the same equation (7) for the data Figure 4.(a) Downcore record of core GeoB6730-1 of the past ~300 kyr for Propeller Mound. U/Th age data are in thousand years before present (kyr B.P.); corresponding Marine Isotope Stages (MIS) are indicated. The vertical gray bar highlights the present-day density range ofσΘ= 27.35–27.65 kg m3for living cold-water corals reefs of the NE Atlantic [Dullo et al., 2008]. Reconstructed paleoseawater densities are shown by black line; dark grey envelope indicates the error bar.
Computer tomographic (CT) images indicate occurrence of corals throughout the core with varying densities. An asterisk denotes mean value of three age determinations (see Table S1), and two asterisks denote large error comprising MIS 8.3 to MIS 9.2 (see supporting information). (b) Sedimentary record of IODP Site U1317C between 151 m and 141 m below the seafloor (mbsf). The vertical grey bar corresponds to the present-day density envelope. Stable oxygen isotopes and reconstructedσΘvalues show a pronounced shift from middle Miocene to the onset of mound growth at ~2.7 Ma. Core pictures (CP) indicate the transition of dark grey, clayey sediments of the middle Miocene to the light grey, coral-bearing sediments of the late Pliocene with varying coral densities.
below the mound base, although meanδ18OCvalues of 0.12 ± 0.12‰ refer to a completely different set- ting during the middle Miocene.
After the long hiatus cold-water cor- als started to build-up Challenger Mound closely related to major changes in Pliocene-Pleistocene paleoceanography [Kano et al., 2007]. The dramatic increase of 1.8‰in δ18OCat the mound base indicates the mound initiation and corresponds to a shift of ~1.3 kg m3 from lighter seawater densities for the middle Miocene (26.11
± 0.12 kg m3) to late Pliocene-early Pleistocene values of 27.41
± 0.08 kg m3 (Figure 4b) applying the same equation. The late Pliocene-early Pleistocene paleosea- water density record is comparable to the late Pleistocene record of Propeller Mound showing values of 27.27–27.60 kg m3 (Figure 4).
Taking reconstructed temperatures ofRaddatz et al. [2014] into account the Pliocene-Pleistocene values plot close to the Holocene values of core GeoB6730-1 (Figure 5).
Khélifi et al. [2014] reconstructed MOW flow patterns along the European continental margin between 2.5 and 3.7 Ma using among other proxies alsoδ18OCand Mg/Ca temperatures to derive paleoseawater densities. Their values are slightly heavier (between 28 and 29 kg m3) from drill cores situated 400 m deeper than Challenger Mound, but also fluctuations to <27.5 kg/m3 occur at ~2.8 Ma. Using their benthic δ18OC data for DSDP Site 548 (1200 m water depth) at ~2.8 Ma of 3 to 4‰, bottom water densities of 27.7 to 28.2 kg m3can be determined using equation (7), comparable values as ofKhélifiet al. [2014]. The variability of reconstructed bottom water den- sities at Challenger Mound (IODP Site U1317C) can be directly linked tofluctuations of intermediate water masses of the early MOW and other North Atlantic Central Water masses (e.g., ENAW; Figure 1). The early CWC reefs started to develop and actively buildup Challenger Mound, when the intermediate water mass setting developed a pycnocline with associated mechanisms (horizontal currents transporting nutrition and possible disperse coral larvae) as described byDullo et al. [2008] orWhite and Dorschel[2010]. This intermediate water mass setting has been hypothesized by different studies [e.g.,De Mol et al., 2002;Sakai et al., 2009;Li et al., 2011;Raddatz et al., 2014] but not proven by reconstructed bottom water parameters or seawater densities so far. Furthermore, this hydrographic setting controlled by the MOW outflow dynamics may have accounted for the whole Porcupine Seabight as all mounds root on the same unconformity [De Mol et al., 2002] and were under the influence of same water masses upstream or downstream.
3.3. Critical Assessment of Paleodensity Reconstructions
The determination of paleoseawater densities based on benthicδ18OCusing the method developed by Lynch-Stieglitz et al. [1999b] allows the reconstruction with a smaller uncertainty compared to other methods Figure 5.Potential temperature and salinity plot including pycnoclines of
potential seawater density (σΘin kg m3). Grey band corresponds to the present-day potential density range of CWC reefs along the European con- tinental margin. Paleodensities derived for the middle Miocene before mound initiation are much lighter than the late Pliocene-Pleistocene- Holocene reconstructions. Paleotemperatures for the Miocene are from Raddatz et al. [2011] andKhélifiet al. [2009]. The onset of mound growth at
~3–2.7 Ma (late Pliocene-early Pleistocene, LP-EP) and the Holocene (H) plot at the lighter end of the present-day density range (27.3–27.6 kg m3). MIS 5 (= 5.3–5.4) and MIS 7 are directly on the isopycnal of 27.5 kg m3, while MIS 6.5 and MIS 9.1 show the tendency to heavier values (27.4–27.7 kg m3).
They exhibit cooler temperatures (Tables S4 and S5 in the supporting infor- mation) equivalent to modern cold-water coral reefs of northern Norway [Dullo et al., 2008;Rüggeberg et al., 2011]. The Last Glacial Maximum (LGM) reconstruction plots around 28 kg m3at temperatures below 5°C. For these temperatures the accuracy becomes increasingly larger (see section 2).