https://doi.org/10.5194/bg-18-1719-2021 This work is distributed under
the Creative Commons Attribution 4.0 License.
Modeling silicate–nitrate–ammonium co-limitation of algal growth and the importance of bacterial remineralization based on an
experimental Arctic coastal spring bloom culture study
Tobias R. Vonnahme1, Martial Leroy2, Silke Thoms3, Dick van Oevelen4, H. Rodger Harvey5, Svein Kristiansen1, Rolf Gradinger1, Ulrike Dietrich1, and Christoph Völker3
1Department of Arctic and Marine Biology, UiT – The Arctic University of Norway, Tromsø, Norway
2Université Grenoble Alpes, Grenoble, France
3Department of Biogeosciences, Alfred Wegener Institute Helmholtz Centre for Polar and Marine Research, Bremerhaven, Germany
4Department of Estuarine and Delta Systems, Royal Netherlands Institute for Sea Research (NIOZ), and Utrecht University, Texel, Yerseke, the Netherlands
5Department of Ocean and Earth Sciences, Old Dominion University, Norfolk, USA
Correspondence:Tobias R. Vonnahme (t.r.vonnahme@gmail.com) and Christoph Voelker (christoph.voelker@awi.de) Received: 14 August 2020 – Discussion started: 4 September 2020
Revised: 30 January 2021 – Accepted: 4 February 2021 – Published: 11 March 2021
Abstract. Arctic coastal ecosystems are rapidly changing due to climate warming. This makes modeling their produc- tivity crucially important to better understand future changes.
System primary production in these systems is highest dur- ing the pronounced spring bloom, typically dominated by di- atoms. Eventually the spring blooms terminate due to sili- con or nitrogen limitation. Bacteria can play an important role for extending bloom duration and total CO2 fixation through ammonium regeneration. Current ecosystem mod- els often simplify the effects of nutrient co-limitations on al- gal physiology and cellular ratios and simplify nutrient re- generation. These simplifications may lead to underestima- tions of primary production. Detailed biochemistry- and cell- based models can represent these dynamics but are difficult to tune in the environment. We performed a cultivation ex- periment that showed typical spring bloom dynamics, such as extended algal growth via bacterial ammonium remineraliza- tion, reduced algal growth and inhibited chlorophyll synthe- sis under silicate limitation, and gradually reduced nitrogen assimilation and chlorophyll synthesis under nitrogen limita- tion. We developed a simplified dynamic model to represent these processes. Overall, model complexity in terms of the number of parameters is comparable to the phytoplankton growth and nutrient biogeochemistry formulations in com-
mon ecosystem models used in the Arctic while improv- ing the representation of nutrient-co-limitation-related pro- cesses. Such model enhancements that now incorporate in- creased nutrient inputs and higher mineralization rates in a warmer climate will improve future predictions in this vul- nerable system.
1 Introduction
Marine phytoplankton are responsible for half of the CO2
fixation on Earth (Field et al., 1998; Westberry et al., 2008).
In high-latitude oceans, diatoms are an important group con- tributing 20 %–40 % of the global CO2 fixation (Nelson et al., 1995; Uitz et al., 2010). Marine primary production can be bottom-up limited by light and/or nutrients like nitrogen (N), phosphorous (P), silicon (Si), and iron (Fe). Their avail- ability is affected by pronounced geographical and seasonal variations (Eilertsen et al., 1989; Loebl et al., 2009; Iversen and Seuthe, 2011; Moore et al., 2013). Arctic coasts are one of the fastest changing systems due to climate change.
Thus, modeling their dynamics is difficult but crucial for predictions of primary production with climate change (e.g., Slagstad et al., 2015; Fritz et al., 2017; Lannuzel et al.,
1720 T. R. Vonnahme et al.: Modeling silicate–nitrate–ammonium co-limitation of algal growth 2020). In Arctic coastal ecosystems, primary production is
typically highest in spring. In spring, previous winter mix- ing supplied fresh nutrients, and a stratified surface layer with sufficient light is facilitated by increasing temperatures and potentially sea ice melt (Sverdrup, 1953; Eilertsen et al., 1989; Eilertsen and Frantzen, 2007; Iversen and Seuthe, 2011). With increasing temperatures and runoff, stratifica- tion in coastal Arctic systems is expected to increase (Trem- blay and Gagnon, 2009). This will lead to decreased mixing and nutrient upwelling in autumn and winter and an earlier stratified surface layer in spring, which may lead to an ear- lier spring bloom (Tremblay and Gagnon, 2009). However, at the same time, brownification and increased sediment re- suspension is already leading to light inhibition in spring, which may lead to a delayed spring bloom (Opdal et al., 2019). The spring bloom typically consists of chain-forming diatoms and is terminated by Si or N limitation (Eilertsen et al., 1989; Iversen and Seuthe, 2011). Zooplankton graz- ing is typically of low importance for terminating blooms (e.g., Saiz et al., 2013), while inorganic nutrients are consid- ered to drive bloom termination (Krause et al., 2019, Mills et al., 2018). Heterotrophic bacteria remineralization of organic matter may supply additional N and Si (Legendre and Ras- soulzadegan, 1995; Bidle and Azam, 1999; Johnson et al., 2007). N regeneration has been described as a mostly bac- teria related process (Legendre and Rassoulzadegan, 1995), while Si dissolution is mainly controlled by abiotic dissolu- tion of silica (Bidle and Azam, 1999). Zooplankton may also release some ammonium and urea after feeding on phyto- plankton, but we suggest that this process is likely far less important than bacterial regeneration (e.g., Saiz et al., 2013).
Previously measured ammonium excretion of Arctic meso- zooplankton is typically low compared to bacterial reminer- alization (Conover and Gustavson, 1999), with the exception of one study in summer in a more open ocean setting (Al- caraz et al., 2010). In some Arctic systems urea excreted by zooplankton may be an important N source for regenerated algae production (Conover and Gustavson, 1999). A warmer climate will increase both bacteria-related remineralization rates (Legendre and Rassoulzadegan, 1995; Lannuzel et al., 2020) and abiotic silica dissolution (Bidle and Azam, 1999).
However, the magnitude is not well understood.
Phytoplankton blooms may be dominated by a single or a few algal species, often with a similar physiology during certain phases of the bloom (e.g., Eilertsen et al., 1989; Degerlund and Eilertsen, 2010; Iversen and Seuthe, 2011). Chain-forming centric diatoms share physiological needs and responses to nutrient limitations (e.g., Eilertsen et al., 1989; von Quillfeldt, 2005) and typically dominate these blooms. In some Arctic and sub-Arctic areas the Arc- tic phytoplankton species chosen for this model, Chaeto- ceros socialis, can be dominant during spring blooms (Rey and Skjoldal, 1987; Eilertsen et al., 1989; Booth et al., 2002; Ratkova and Wassmann, 2002; von Quillfeldt, 2005;
Degerlund and Eilertsen, 2010). Such spring phytoplankton
blooms are accompanied by heterotrophic bacterioplankton blooms also showing typical succession patterns and dis- tinct re-occurring taxa that dominate the community (Teel- ing et al., 2012, 2016). The importance of bacterial nutri- ent recycling for regenerated production has been recog- nized in several ecosystem models (e.g., van der Meersche et al., 2004; Vichi et al., 2007; Weitz et al., 2015) and al- gae bioreactor models focusing on nutrient conversions (e.g., Zambrano et al., 2016). However, these models are typically highly simplified or omitted in more sophisticated dynamic multi-nutrient, quota-based models (e.g., Flynn and Fasham, 1997; Wassmann et al., 2006; Ross and Geider, 2009). These latter models have been often developed and tuned based on cultivation experiments in which microbial remineraliza- tion reactions were assumed to be absent (e.g., Geider et al., 1998; Flynn, 2001) despite the fact that most algae cul- tures, likely including Geider et al. (1998) and Flynn (2001), are not axenic. Parameters estimated by fitting axenic mod- els on non-axenic experiments may be misleading, mostly due to an inflated efficiency of dissolved inorganic nitrogen (DIN) uptake. Additional positive effects of bacteria include vitamin synthesis (Amin et al., 2012), trace metal chelation (Amin et al., 2012), the scavenging of oxidative stressors (Hünken et al., 2008), and exchange of growth factors (Amin et al., 2015). Especially in the stationary algal growth phase, Christie-Oleza et al. (2017) found that marine phototrophic cyanobacteria cultures are dependent on heterotrophic bacte- ria contaminants mainly due to their importance in degrad- ing potentially toxic dissolved organic matter (DOM) exu- dates and regenerating ammonium. The current study aimed to bridge the gap between detailed representations of algae physiology and the role of microbial activity in an accurate way while keeping model complexity low.
Most ecosystem models consider only a single limiting nu- trient to control primary production following Liebig’s law of the minimum (Wassmann et al., 2006; Vichi et al., 2007).
Yet we know that nutrient co-limitation is more complex.
For example, ammonium and glutamate can inhibit nitrate uptake (Morris, 1974; Dortch, 1990; Flynn et al., 1997); C and N uptake is reduced under Fe limitation, while Si up- take continues (Werner, 1977; Firme et al., 2003); and the effects on photosynthesis differ for nitrogen and silicon lim- itations and for different algal groups (Werner, 1977; Flynn, 2003; Hohn et al., 2009). Complex interaction models con- sidering intracellular biochemistry (NH4–NO3co-limitation, Flynn et al., 1997), transporter densities and mobility (Flynn et al., 2018), and cell cycles (Si limitation, Flynn, 2001) can accurately describe these dynamics (Flynn, 2003) but are ul- timately too computationally expensive to be integrated and parameterized in large-scale ecosystem models. Some mod- els (Hohn et al., 2009; Le Quéré et al., 2016) implemented multi-nutrient (Hohn et al., 2009) and heterotrophic bacterial dynamics (Le Quéré et al., 2016) in Southern Ocean ecosys- tem models but have their limitations in representing bacte- rial remineralization (Hohn et al., 2009) or ammonium and
silicate co-limitations (Le Quéré et al., 2016). In contrast to Antarctica, DIN is the primary limiting nutrient for phyto- plankton growth, while iron is not limiting in most Arctic systems (Tremblay and Gagnon, 2009; Moore et al., 2013).
While simple lab experiments cannot represent all nutri- ent dynamics found in the environment (e.g., N excretion by zooplankton), they can focus on the quantitatively most important dynamics, to facilitate the development of simple multi-nutrient models, which are scalable to larger ecosys- tem models. The present study investigated the impact of silicate, ammonium–nitrate co-limitation and bacterial nu- trient regeneration on photosynthesis, nitrogen assimilation, and cellular quotas based on data from a culture-based Arc- tic spring bloom system. The culture consisted of an axenic isolate ofChaetoceros socialis, dominating a phytoplankton net haul of a Svalbard fjord. The cultivation experiment was conducted either under axenic conditions or after inoculation with mostly free-living bacteria cultures, isolated beforehand from the non-axenic culture. Parametrization and insights from these incubations were then used to develop and param- eterize a simple carbon-quota-based dynamic model (based on Geider et al., 1998), aiming to keep the number of param- eters and computational costs as low as possible to allow for its implementation in large-scale ecosystem models.
The aims of the study were (i) to study the bloom dynam- ics of a simplified Arctic coastal pelagic system in a culture experiment consisting of one Arctic diatom species and co- cultured bacteria, (ii) to develop a simple dynamic model representing the observed interactions, and (iii) to discuss the importance of more complex bloom dynamics for their accu- rate representation in ecosystem models.
We hypothesize that (i) bacterial regeneration extends a phytoplankton growth period and gross carbon fixation, (ii) diatoms continue photosynthesis under silicate limitation at a reduced rate if DIN is available, and (iii) cultivation ex- periments are powerful for understanding the major spring bloom dynamics.
2 Methods
2.1 Cultivation experiment
The most abundant phytoplankton species from a net haul (20 µm mesh size) in April 2017 in van Mijenfjorden (Sval- bard)Chaetoceros socialiswas isolated via the dilution iso- lation method (Andersen et al., 2005) on F/2 medium (Guil- lard, 1975). Bacteria were isolated on LB-medium (evalu- ated by Bertani, 2004) agar plates using the algae culture as inoculum and sequenced at GENEWIZ LLC using the Sanger method and standard 16S rRNA primers targeting the V1-V9 region (forward 50-AGAGTTTGATCCTGGCTCAG- 30, reverse 50-ACGGCTACCTTGTTACGACTT-30) provided by GENEWIZ LLC for identification via blastn (Altschul et al., 1990). Two strains of Pseudoalteromonas elyakovii,
a taxon previously isolated from the Arctic (Al Khudary et al., 2008) and known to degrade algae polysaccharides (Ma et al., 2008) and to excrete polymeric substances (Kim et al., 2016), were successfully isolated and used for the ex- periments. Before the start of the experiment, all bacteria in the algae culture were killed using a mixture of the an- tibiotics penicillin and streptomycin. The success was con- firmed via incubation of the cultures on LB agar plates and bacterial counts after DAPI staining (Porter et al., 1980). The axenic cultures were diluted in fresh F/2 medium lacking ni- trate addition (Guillard, 1975) using sterile filtered seawa- ter of Tromsø sound (Norway) as basis. The algae cultures were transferred into 96 200 mL sterile cultivation bottles with three replicates for each treatment. Half of the incuba- tions were inoculated with bacteria cultures (BAC+), while the other half was kept axenic (BAC−). The cultures were in- cubated at 4◦C and 100 µE m−2s−1of continuous light and mixed two to three times a day to keep the algae and bacteria in suspension. We ensured sterile conditions during the ex- periment by keeping the cultivation bottles closed until sam- pling. However, endospores may survive the antibiotic treat- ment in low numbers and start growing especially towards the end of the experiment. Over 16 d three axenic and three BAC+ bottles were sacrificed daily for measurements of chlorophylla(Chl), particulate organic carbon (POC) and ni- trogen (PON), bacterial and algal abundances, nutrients (ni- trate, nitrite, ammonium, phosphate, silicate), dissolved or- ganic carbon (DOC), and the maximum quantum yield (QY) of photosystem II (PSII) (Fv/Fm) as a measure of healthy photosystems. Due to technical problems not all replicates could be measured on all days, and an overview of replica- tion is given in Supplement Table S2.
Chlorophylla was extracted from a GF/F (50 mL filtered at 200 mbar) filter at 4◦C for 12–24 h in 98 % methanol in the dark before measurement in a Turner Trilogy™ fluorometer (evaluated by Jacobsen and Rai, 1990). POC and PON were measured after filtration onto precombusted (4 h at 450◦C) GF/F (Whatman) filters (50 mL filtered at 200 mbar), using a Flash 2000 elemental analyzer (Thermo Fisher Scientific, Waltham, MA, USA) and Euro elemental analyzer (HEKAt- ech) following the protocol by Pella and Colombo (1973) af- ter removing inorganic carbon by fuming with saturated HCl in a desiccator. Bacteria were counted after fixation of a wa- ter sample for 3–4 h with 2 % formaldehyde (final concentra- tion), filtration of 25 mL on a 0.2 µm pore size polycarbonate filter, washing with filtered seawater and ethanol, DAPI stain- ing for 7 min following Porter et al. (1980), and embedding in Citifluor–Vectashield (3:1). Bacteria were counted in at least 20 grids under an epifluorescence microscope (Leica DM LB2, Leica Microsystems, Germany) at 10×100 mag- nification. In the same sample the average diameter of di- atom cells at the start and end of the experiment was mea- sured. Algae were counted in 2 mL wells under an inverted microscope (Zeiss Primovert, Carl Zeiss AG, Germany) at 20×10 magnification after gentle mixing of the cultivation
1722 T. R. Vonnahme et al.: Modeling silicate–nitrate–ammonium co-limitation of algal growth bottle. Algae cells incorporated in biofilms after day 9 in
the BAC+cultures were counted after sonication in a son- ication bath until all cells were in suspension. Nutrient and DOC samples were sterile filtered (0.2 µm) and stored at
−20◦C before measurements. Nutrients were measured in triplicates after using standard colorimetric methods on a nu- trient analyzer (QuAAtro 39, SEAL Analytical, Germany) using the protocols no. Q-068-05 rev. 12 for nitrate (detec- tion limit=0.02 µmol L−1), no. Q-068-05 rev. 12 for nitrite (detection limit=0.02 µmol L−1), no. Q-066-05 rev. 5 for silicate (detection limit=0.07 µmol L−1), and no. Q-064-05 rev. 8 for phosphate (detection limit=0.01 µmol L−1). The data were analyzed using the software AACE. The nutrient analyzer was calibrated with reference seawater (Ocean Sci- entific International Ltd., United Kingdom). Ammonium was measured manually using the colorimetric method following McCarthy et al. (1977) on a spectrophotometer (Shimadzu UV-1201, detection limit=0.01 µmol L−1). Ammonium val- ues >100 µmol L−1 were removed as outliers caused by too high a filtration pressure. DOC was measured by high- temperature catalytic oxidation (HTCO) using a Shimadzu TOC-5000 total C analyzer following methods for seawater samples (Burdige and Homstead, 1994). The photosynthetic quantum yield was determined using an AquaPen-C AP 100 (Photon Systems Instruments, Czech Republic).
Certain factors, such as grazing, settling out of the eu- photic zone, and bacterial and algae succession, were not in- cluded into the experimental setup to reduce complexity and focus on nutrient dynamics. Trace metals, phosphate, and vi- tamin B12 in coastal systems are assumed to be not limit- ing in Arctic coastal systems and were supplied in excess to the culture medium. Realistic pre-bloom DOC concentra- tions were present in the medium as it was prepared with sterilized seawater from the Fjord outside Tromsø before the onset of the spring bloom (March 2018).
The f ratio as indication for the importance of regen- erated production (Eppley, 1981) was calculated based on the average PON fixation in the last 3 d of the experiment (Eq. C1). Here, nitrogen assimilation in the BAC−culture was assumed to be based on new (nitrate-based) production, while fixation in the BAC+experiment was assumed to also be based on regenerated (ammonium-based) production.
2.2 Model structure
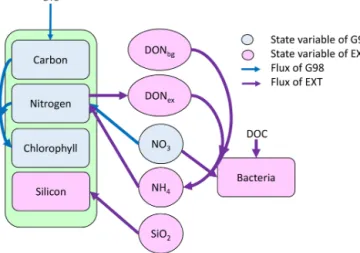
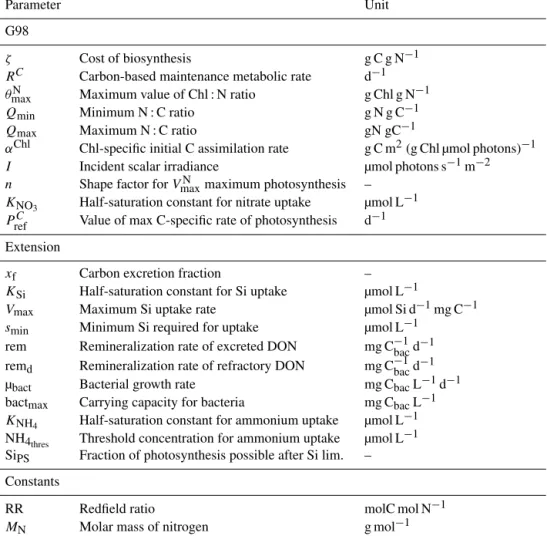
This section outlines the overall model structure followed by a description of the chosen parametrization approach for each relevant process. Details regarding model equations are pro- vided in the Appendix (Tables A6 and A7), and a schematic representation of the models is given in Fig. 1. We used a dy- namic cell quota model by Geider et al. (1998) to describe the BAC−experiment (G98). We then extended the G98 model to represent the role of silicate limitation, bacterial regen- eration of ammonium, and different kinetics for ammonium and nitrate uptake (EXT) and fitted it to the BAC+exper-
Figure 1.Schematic representation of the state variables and con- nections and controls in the G98 model (blue) and EXT model (pur- ple). The EXT model has the same formulations as G98, with the additions shown in purple.
iment while retaining the parameter values previously esti- mated for G98.
The Geider et al. (1998) model (G98) describes the re- sponse of phytoplankton to different nitrogen and light con- ditions and is based on both intracellular quotas and extra- cellular dissolved inorganic nitrogen (DIN) concentrations, allowing decoupled C and N growth (Fig. 1). Within this model, light is a controlling factor on photosynthesis and chlorophyll synthesis. C : N ratios and DIN concentrations control nitrogen assimilation, which is coupled to chloro- phyll synthesis and photosynthesis. Chl : N ratios are con- trolling photosynthesis and chlorophyll synthesis. G98 has been used in a variety of large-scale ecosystem models, with some extensions representing the actual conditions in the en- vironment or mesocosms (e.g., Moore et al., 2004; Schartau et al., 2007; Hauck et al., 2013). Photoacclimation dynam- ics in Geider-type models have been evaluated as quick and robust (Flynn et al., 2001), while the N assimilation compo- nent has some shortcomings in regard to ammonium–nitrate interactions. The original model of Geider et al. (1998) for C and N was corrected for minor typographical errors (see Ross and Geider, 2009; Appendix Tables A6, A7).
One aim of the study was to develop a model (EXT) with simplified dynamics of nutrient co-limitation, which is suit- able for future implementation in coupled biogeochemistry–
circulation models. The EXT model keeps all formulations of the G98 and adds dynamics and interactions of silicate, ni- trate and ammonium uptake, carbon and nitrogen excretion, and bacterial remineralization (Fig. 1). The aim of the model was to describe the response in photosynthesis, chlorophyll synthesis, and nitrogen assimilation with a minimal number of parameters. Hence, dynamics in silicate cycling and bac- terial physiology were highly simplified. The limitations of
these simplifications and the potential need for more complex models are discussed later.
Silicate uptake was modeled using Monod kinetics fol- lowing Spilling et al. (2010). The effect of silicate limita- tion on photosynthesis and chlorophyll synthesis was imple- mented after findings by Werner (1978), Martin-Jézéquel et al. (2000), and Claquin et al. (2002). Werner (1978) found that silicate limitation can lead to a 80 % reduction in pho- tosynthesis and a stop of chlorophyll synthesis in diatoms within a few hours. Hence, we added a parameter for the re- duction of photosynthesis under silicate limitation (SiPS) and formulated a stop of chlorophyll synthesis under silicate lim- itations.
N and Si metabolism have different controls and intra- cellular dynamics, with N uptake driven by photosynthe- sis (as PCref in G98) and Si mainly linked to algal respira- tion (Martin-Jezequel et al., 2000). Besides earlier cultivation studies, the reduction of photosynthesis after Si limitation has been shown via photophysiological (inhibited PSII re- action center, Lippemeier et al., 1999) and molecular (down- regulated photosynthetic proteins, Thangaraj et al., 2019) ap- proaches. In general, we assume that nitrogen metabolism is not directly affected by silicate limitation (Hildebrand, 2002;
Claquin et al., 2002), but we expect cellular ratios to be af- fected by reduced photosynthesis and chlorophyll synthesis under Si limitation (Hildebrand, 2002; Gilpin, 2004).
The algal respiration term included both respiration and excretion of dissolved organic nitrogen and carbon as a frac- tion of the carbon and nitrogen assimilated. For testing the importance of DON excretion, we also ran the EXT model without DON excretion (EXT-excr). Dissolved organic nitro- gen (DON) was recycled into ammonium via bacterial rem- ineralization. It was assumed that this process is faster for freshly excreted DON compared to DON already present in the medium. Thus, we implemented a labile DON pool (DONl) for freshly excreted DON and a refractory (DONr) DON pool with the respective remineralization rates rem and remd. We also assumed that excreted DON and DOC do not coagulate as extracellular polymeric substances (EPS) during the course of the experiment. Following Tezuka (1989), net bacterial regeneration of ammonium occurs at DOM C : N molar ratios below 10 and is proportional to bacterial abun- dances. Higher thresholds up to 29 have been found (e.g., Kirchman, 2000), but we selected a lower number to stay conservative. DOM C : N ratios are assumed to be propor- tional to algae C : N ratios (van der Meersche et al., 2004), with algal molar C : N ratios below 10 representing sub- strate (DOM) molar C : N ratios below 10.5. Hence, we as- sumed net bacterial ammonium regeneration to occur at mo- lar POC/PON ratios below 10, while higher ratios lead to bacteria retaining more N for growth than they release. Bac- teria abundance change was estimated using a simple logis- tic growth curve as a function of DOM since the number of parameters is low (2) and the fit sufficient for the pur- pose of modeling algae physiology. Michaelis–Menten ki-
netics based on bacteria growth on DOM with different la- bilities could give a more accurate representation of bacterial growth but would not change the fit of the other model pa- rameters aiming for the best fit of the model output to algal PON, POC, Chl, and DIN. Algal nitrate uptake was mod- eled after the original model by Geider et al. (1998), and am- monium assimilation was based on the simplified SHANIM model by Flynn and Fasham (1997), excluding the inter- nal nutrient and glutamine concentrations. Ammonium up- take is preferred over nitrate (lower half-saturation constant) and reduces nitrate assimilation if available above a certain threshold concentration of ammonium (Dortch, 1990; Flynn, 1999). Ammonium is the primary product of bacterial regen- eration after remineralization of DON. Nitrification was as- sumed to be absent, since the bacteria in our experiment are not known to be capable of nitrification.
2.3 Model fitting
The model was based on a set of ordinary differ- ential equations (ODEs) and was written in R. All model equations are provided in the Appendix (Ta- bles A6 and A7), the newest version of the R code is available on GitHub (https://github.com/tvonnahm/
Dynamic-Algae-Bacteria-model, last access: 29 Jan- uary 2021), and the version used in this paper is archived at zenodo (https://doi.org/10.5281/zenodo.4459550). The ODEs were solved using the ode function of the deS- olve package (Soetaert et al., 2010) with the second- to third-order Runge–Kutta method with automated step size control.
The parameters of the G98 model were fitted to the BAC−
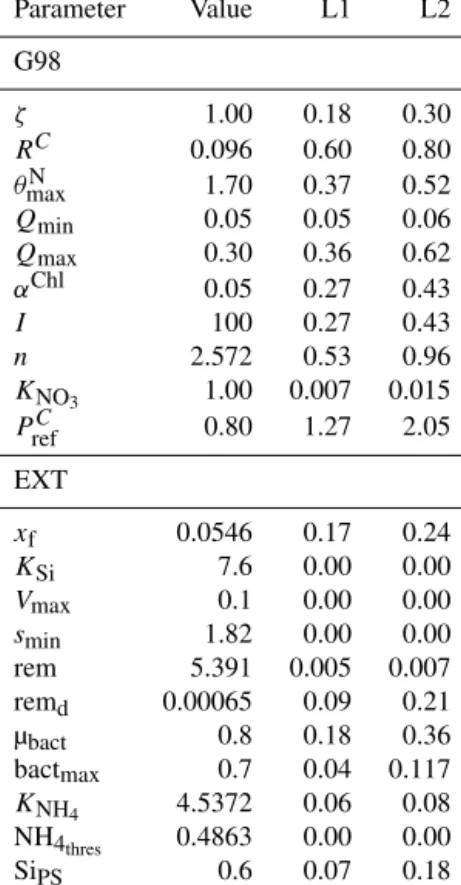
experiment data, and those of the EXT model were fitted to the BAC+experiment data. The model fitting started with data from day 1 in order to avoid artifacts during acclima- tion of the cultures after transfer to a new medium. Si and NOxwere not measured at day 1, and the mean of day 0 and day 2 was used. The G98 parameter values were fitted first and retained without changes for the EXT model fitting. The maximum Chl : N ratio (θmaxN ), minimum and maximum N : C ratios (Qmin,Qmax), and irradiance (I) were available as ex- perimental data and needed no further fitting (Appendix Ta- ble A2). The start values and constraints for the remaining six variables (ζ,RC,αChl,n,KNO3,PrefC, Table A3) were based on model fits of G98 to other diatom culture in previous stud- ies (Geider et al., 1998; Ross and Geider, 2009). The parame- ters were first fitted manually via graphical comparisons with the experimental data (POC, PON, Chl, DIN, Figs. 5 and 6) and via minimizing the model cost calculated as the root of the sum of squares normalized by dividing the squares with the variance (RMSE Eq. C2, Stow et al., 2009). The initial manual tuning approach allowed control of the model dy- namics, considering potential problems with known limita- tions of the G98 model (e.g., lag phase not modeled; Pahlow, 2005). The manual tuning also allowed obtaining good start
1724 T. R. Vonnahme et al.: Modeling silicate–nitrate–ammonium co-limitation of algal growth parameters for the automated tuning approach and sensitiv-
ity/collinearity analyses, which are sensitive to the start pa- rameters.
After the manual tuning, an automated tuning approach was used to optimize the fits. The automated tuning was done using the FME package (Soetaert and Petzoldt, 2010), a package commonly used for fitting dynamic and inverse models based on differential equations (i.e., deSolve) to mea- sured data. The automated analyses were based on minimiz- ing the model cost calculated as the sum of squares of the residuals (SSR, fitted vs. measured data). The experimen- tal data were normalized so that all normalized data were in a similar absolute range of values. This involved increasing Chl and PON values by an order of magnitude while decreas- ing DIN (NH4+NO3) data by 1 order of magnitude. The data were not weighted, assuming equal data quality and impor- tance. Prior to the automated fitting, parameters were tested for local sensitivity (sensFun) and collinearity or parameter identifiability (collin; e.g., Wu et al., 2014). sensFun tests for changes in output variables at each time point based on local perturbations of the model parameter. The sensitivity is cal- culated as L1 and L2 norms (Soetaert et al., 2009, 2010). The sensFun output is further used as input for the collinearity or parameter identifiability analyses. Parameters were con- sidered collinear and not identifiable in combination with a collinearity index higher than 20 (Brun et al., 2001). In this case, only the more sensitive parameter was used for further tuning. Eventually,RC,KNO3,n, andαChlwere subject to the automated tuning approach using the modFit function, based on minimizing the SSR within the given constraints. Param- eters were first fitted using a pseudorandom search algorithm (Price, 1977) to ensure a global optimum. The resulting pa- rameters were then fine-tuned using the Nelder–Mead algo- rithm (Soetaert et al., 2010) for finding a local optimum. A model run with the new parameters was then compared to the initial model via graphical comparisons of the model fit to the experimental data and via the RMSE value.
The parameter values obtained for the G98 fit to the BAC− experiment were retained without changes or further fitting in the EXT model. The additional parameters of the EXT model were then fitted to the BAC+experimental data (POC, Chl, PON, DIN). The model was only fitted to total DIN due to the potential uncertainties related to ammonium immobiliza- tion in the biofilm, which could be released during filtration and be part of the measured data. In fact, in a test run, fitting the EXT model to NO3 and NH4 separately led to a sub- stantially worse overall fit (RMSE=3.49). Otherwise, the data were not weighted. Since the aim of the study was to model the effects of silicate and bacteria on algae growth and not to develop an accurate model for bacteria biomass and silicate concentrations, the parameters µbact, bactmax, KSi, and Vmax were only fitted to the corresponding data (bac- teria, silicate) prior to fitting the other parameters of the EXT model. Bacterial growth parameters (µbact, bactmax) were fit- ted to the bacterial growth curve using common bacterial car-
bon conversion units (20 fg C per cell as described by Lee and Fuhrman, 1987). Silicate-related parameters (KSi,Vmax) were constrained by the study of Werner (1978) and fitted to the measured silicate concentrations. The remaining param- eters were subject to the tuning approach described for G98.
Ammonium-related parameters (KNH4, NH4thres) were con- strained by measured ammonium concentrations and con- stants available for other diatom taxa described by Eppley et al. (1969). Remineralization parameters for excreted (rem) and background (remd) DOM were constrained by the data with the limitation of rem>remd, assuming that the ex- creted DOM is more labile. The parameters related to the effect of silicate limitation on photosynthesis and chloro- phyll production (smin, SiPS) were constrained by the study of Werner (1978) and fitted as described for G98. None of the added parameters were collinear/unidentifiable or given by the measured data and thus retained for the automated tun- ing approach. Eventually, the 15 parameters (Table A3) were fitted against 160 data points (Table A1).
Due to the biofilm formation in the stationary phase of the BAC+ experiment, we tested two additional model- ing approaches representing different dynamics in biofilms:
(i) DOC coagulation to EPS as part of the POC pool, which was assumed absent in our EXT model (Schartau et al., 2007), and (ii) increased DOM excretion in the stationary phase (e.g., Christie-Oleza et al., 2017). However, we sug- gest that the photosynthesis reduction term SiPScan give very similar model outputs, while being similarly or more sensi- tive. Thus, we tested the sensitivity of the added parameters of the two extended biofilm models in comparison to SiPS
by testing the magnitude of perturbations of SiPS needed to reverse the effects of the added biofilm parameter (Figs. S1–
3). The effects could be mostly reversed with similar or lower perturbations of SiPS. However, DOC coagulation to EPS can yield in a better overall better fit than SiPSalone. The main ef- fect of the biofilm that we could not model with the available data appears to be ammonium immobilization in the biofilm, potentially by adsorption, accumulation in pockets, or con- version to ammonia due to the locally reduced pH caused by increased bacterial respiration. Model stability was estimated by extending the model run for 120 d to test for unrealistic model dynamics (Fig. S3).
3 Results
3.1 Cultivation experiment
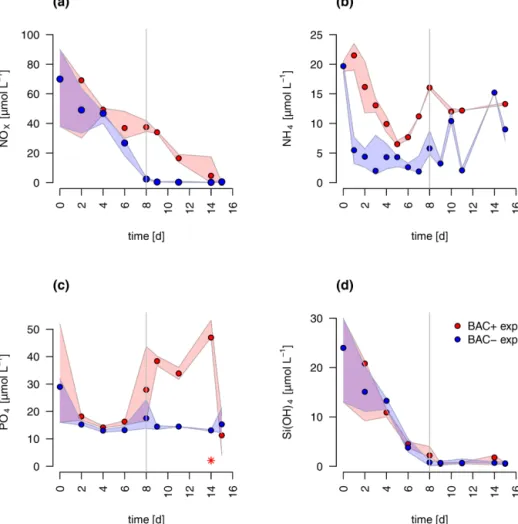
The concentrations of nitrate and silicate declined rapidly over the course of the experiment (Fig. 2). After 8 d, silicate decreased to concentrations below 2 µmol L−1 – a thresh- old known to limit diatom dominance in phytoplankton (Egge and Aksnes, 1992), while inorganic nitrogen (nitrate, nitrite, and ammonium) became limiting (<0.5 µmol L−1, POC : PON>8–9 DIN : DIP<16) only in the BAC− cul-
ture. DIN : DIP ratios far below 16, or DIN concentrations below 2 µmol L−1, have been described as indication for DIN limitation (Pedersen and Borum, 1996), as well as POC : PON ratios >9 (Geider and La Roche, 2002). Phos- phate was not potentially growth limiting, with molar DIN- to-PO4 ratios consistently far below 16 (Redfield, 1934) and concentrations around 15 µmol L−1. Typically, phos- phate concentrations below 0.3 µmol L−1are considered lim- iting (e.g., Haecky and Andersson, 1999). Regeneration of ammonium and phosphate were important after 8 d as seen by increasing concentrations of both nutrients and showed higher concentrations in the BAC+ experiments compared to the BAC− cultures (Fig. 2a, b). Ammonium concentra- tions were consistently higher, and nitrate was removed more slowly in the presence of bacteria, especially during the ex- ponential phase. With the onset of the stationary phase in the BAC+experiment, PO4and NH4concentrations doubled within 2 to 4 d and stayed high with variations in phosphate concentrations, while they stayed low in BAC−. With deple- tion of NO3in BAC+, NH4 concentrations remained high, while PO4concentrations dropped. While not all ammonium measured is also available for algae growth, discussion of the dynamics (decrease in the start, increase with the onset of the stationary phase), especially if also shown in the EXT model, is still useful to understand multi-nutrient dynamics (e.g., regeneration). Considering the overall higher concen- trations of NO3, compared to NH4, discussions of total DIN dynamics, DIN : DIP ratios, and limitations are also mean- ingful. DOC values were very high from the start (approx.
2–4 mmol L−1) and remained largely constant throughout the experiment (Table A8).
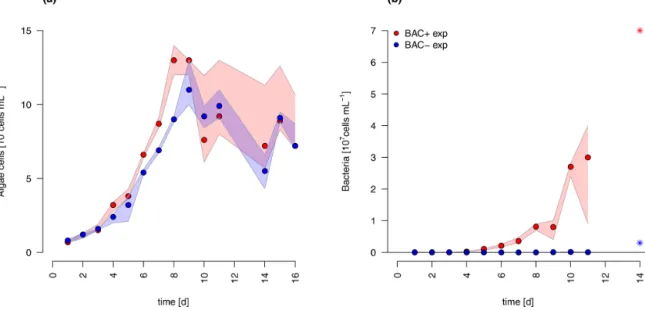
The diatom Chaetoceros socialis grew exponentially in both treatments until day 8 before reaching a stationary phase with declining cell numbers (Fig. 3). The growth rate of the BAC−culture (0.36 d−1) was slightly lower than in the treat- ment with bacteria present (0.42 d−1) during the exponential phase. Algal cellular abundance was higher in the BAC+cul- tures. Towards the end of the exponential phase, the diatom started to form noticeable aggregates in cultures with bacte- ria present, but only to a limited extent in the BAC−cultures.
Such aggregate formation with associated EPS production is typical forC. socialis. With the onset of the stationary phase in the BAC+cultures about 30 % of the cells formed biofilms on the walls of the cultivation bottles (estimated after sonica- tion treatment). Bacteria (Fig. 3) continued to grow through- out the entire experiment, but growth rates slowed down from 0.9 to 0.6 after day 8. In the BAC−cultures, bacterial num- bers increased after 8 d, but abundances remained 2 orders of magnitude below the BAC+cultures and effectively ax- enic over the experimental incubation period. The maximum photosynthetic quantum yield (Fv/Fm) is commonly used as a proxy of photosynthetic fitness (high QY), indicating the efficiency of energy transfer after adsorption in photosys- tem II. Low values are typically related to stress, including for example nitrogen (Cleveland and Perry, 1987) or silicate
(Lippemeier et al., 1999) limitation. We found an increase in QY from approx. 0.62 to 0.67 in the exponential phase and a decrease to approx. 0.62 in the BAC+treatment after 8 d and to approx. 0.58 in the BAC−treatment (Table A8).
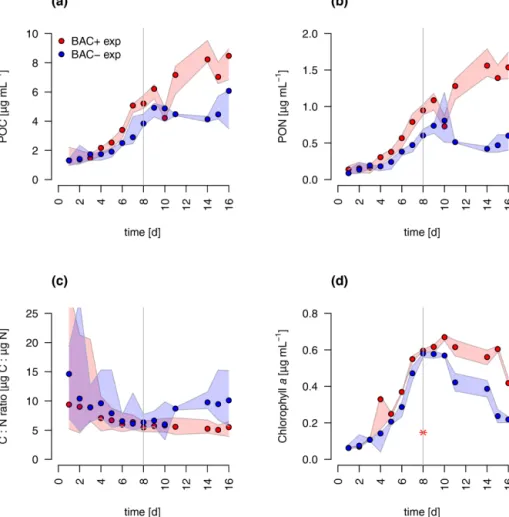
During algal exponential growth, POC and PON concen- trations followed changes in algal abundances, increasing 4-, 7-, and 19-fold, respectively, within 8 d (Figs. 3a, 4). Inter- estingly, with the beginning of the stationary phase, POC and PON continued to increase in the BAC+cultures, while their concentrations stayed constant (POC) or decreased due to maintenance respiration (PON) in BAC−cultures. POC and PON concentrations were consistently higher (1.2×POC, 1.4×PON) in BAC+cultures during the exponential phase.
POC : PON ratios decreased in both cultures, but increased again after 11 d in the BAC−culture. Chlorophyllaconcen- trations also increased exponentially over the first 8 d in both treatments, and thereafter they decreased within the station- ary phase in the BAC−cultures. In contrast, cell numbers remained nearly constant in the BAC+cultures, before de- clining at the last sampling day.
Overall, both experimental cultures showed similar growth dynamics until day 8, with silicate becoming limiting for both treatments and nitrogen only limiting in BAC− cul- tures. Algal growth with bacteria present was slightly but consistently higher during this phase. After 8 d, algae growth stopped in both treatments, but nitrogen and carbon were continuously assimilated in BAC+cultures. BAC−cultures started to degrade chlorophyll, while it stayed the same in BAC+cultures. Algal abundances in the BAC+treatment at the end of the experiment were ca. 30 % higher due to biofilm formation, and considerably more carbon (2×total POC, or 10 %–20 % per cell) and nitrogen (3×total PON) per cell was assimilated and considerably more chlorophyll (2–3×
total chlorophyll) was produced at day 16. Cell size differ- ences were not detectable (ca. 4 µm diameter, Table A8).
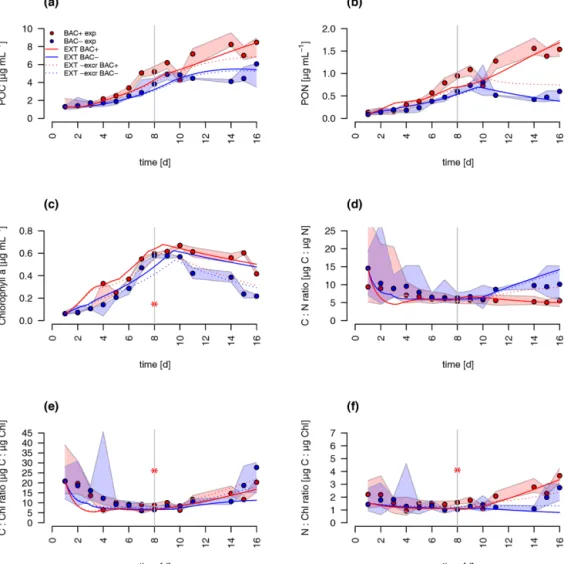
POC-to-PON ratios increased after 11 d in BAC−cultures but showed no change in BAC+cultures. POC-to-Chl ra- tios were comparable in both treatments (Fig. 5). Assuming BAC−N fixation was mostly based on new production (ni- trate as N source), while the algal N fixation in bacterial en- riched treatments was based on new and regenerated (ammo- nium as N source) production, two-thirds of the production was based on regenerated production (f ratio=0.31).
3.2 Modeling
A comparison of the traditional G98 model with the EXT model allowed an estimate of importance of bacterial DIN regeneration and Si co-limitations for describing the ex- perimental growth dynamics. The EXT model led to a slightly worse fit to the BAC− experiment (RMSEG98= 2.79 RMSEEXT=3.38, Figs. 5 and 6). The real strength of the EXT model was in representing growth dynamics with bacteria present (Figs. 5 and 6). Here, the RMSE was reduced by 47 % from RMSEG98=4.31 down to RMSEEXT=2.31.
1726 T. R. Vonnahme et al.: Modeling silicate–nitrate–ammonium co-limitation of algal growth
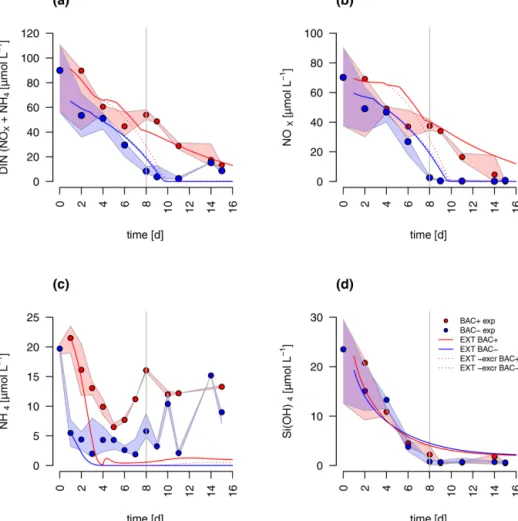
Figure 2.Nutrient measurements over the experimental incubations of(a)NOx, (NO−3+NO−2),(b)NH+4,(c)PO2−4 (the asterisk indicates a presumed measurement error),(d)silicate; blue circles are BAC−cultures and red symbols are BAC+cultures. Circles show median values (blue=BAC−, red=BAC+) and the colored polygons show maximum and minimum of measured data (n=1–3, Table S2). The grey line shows the beginning of the stationary growth phase ofChaetoceros socialis.
Both the G98 and EXT model fits of the BAC−experi- ment were similarly good for POC and PON with a slightly lower modeled growth rate. PON in the BAC+experiment was poorly modeled without consideration of silicate limita- tion or regenerated production specifically towards the end of the exponential phase and during the stationary phase.
Maximum PON values were about 3 times lower using the G98 model (Fig. B3). In addition, the start of the stationary phase in the BAC+experiment was estimated 3 d too late via G98, even though modeled DIN was depleted 3 d too soon (Fig. B3). Under BAC−conditions, where silicate limitation does not play a major role the G98 model appears sufficient.
The EXT model allowed representing detailed dynamics in a bacteria-influenced system such as the responses to sili- cate limitation with a decrease in POC production, continued PON production, and the stagnation of Chl synthesis (Fig. 5).
Apart from the lag phase, the mass ratios of gC : gN and gC : gChl were represented accurately (Fig. 5). The model fits of POC, PON and Chl without the separate carbon excre-
tion term (xf) were lower compared to the model with excre- tion, indicating the importance of excreted dissolved organic matter (DOM) concentrations (RMSEEXT-exrof 5.73).
DIN dynamics caused by ammonium–nitrate interactions were represented well (Fig. 6a). However, at the onset of the stationary phase, ammonium concentrations of the model were 1 order of magnitude lower than in the experiment, showing a major weakness (Fig. 6c). Increased weighting of ammonium during the model fitting led to a slightly better fit to ammonium but a substantially worse fit of the model to POC, PON, and Chl (RMSEEXT=3.49). This indicates that the problem lies with the ammonium data, which in- clude immobilized ammonium in the biofilm released during the filtration but unavailable for diatom growth. Other poten- tial differences in biofilms were tested by means of differ- ent model extensions (DOC and DON aggregation to EPS, increase in DOM excretion). After including the DOC and DOM aggregation to the model, the overall fit was improved (RMSEEXT=2.31, RMSEEXT+eps=2.19, Fig. S1). How-
Figure 3.Abundances of(a)Chaetoceros socialisand(b)bacteria over the 14 d experimental period. Blue data are from BAC−cultures and red from BAC+cultures. The asterisks at day 14 indicate potential outliers as based on only one replicate. Circles represent median values (blue=BAC−, red=BAC+) and the colored polygons show maximum and minimum of measured data (n=1–3, Table S2, not visible for bacteria counts in BAC−cultures due to very small range). The maximum values of the BAC+experiment include algae cells in the biofilm (after day 9).
ever, in the absence of EPS data, we used the EXT model for the main discussion. Increased DOM excretion could be explained by the SiPSterm of the EXT model (Fig. S2). The silicate uptake estimation was highly simplified using simple Monod kinetics, leading to modeled values that are too high in the stationary phase and a depletion that is too quick at the start (Fig. 6d). Carbon excretion (xf) led to NOx depletion after 8 d.
The sensitivity analysis (Table A4) revealed that the sen- sitivity of the added parameters in EXT is overall compa- rable to the sensitivity of the original parameters in G98.
The model outputs were most sensitive toPCref (L1=1.27, L2=2.05), which is a parameter in both G98 and EXT.
The most sensitive added parameters in EXT were the DON excretion rate (xf, L1=0.17, L2=0.24), the bacterial growth rate (µbact, L1=0.18, L2=0.36), the remineraliza- tion rate of refractory DON (remd, L1=0.09, L2=0.21), and the inhibition of photosynthesis under Si limitation (SiPS, L1=0.07, L2=0.18), which was overall comparable to other sensitive parameters of the G98 model (Qmax, RC, αChl,ζ,n,I,2maxN , Table A1). Small perturbations of the pa- rameters only indirectly related to the fitted output variables did not lead to changes in POC, PON, Chl, or DIN.
4 Discussion
The experimental incubations showed that in the presence of bacteria both the growth period and gross carbon fixation were extended (Hypothesis I). The diatoms were able to con- tinue photosynthesis under silicate limitation at a reduced
rate as long as inorganic nitrogen was present (Hypothe- sis II). Overall, the experimental incubations represented typ- ical spring bloom dynamics for coastal Arctic systems, in- cluding an initial exponential growth phase terminated by N and Si limitation (Hypothesis III) and the potential for an ex- tended growth period via regenerated production. Our model incorporating these results was able to reflect these dynam- ics by adding NH4–NO3–Si(OH)4co-limitations and bacte- rial NH4regeneration to the widely used G98 model. In addi- tion, bacteria–algae interactions, DOC, and biofilm dynamics were important in the experiment, but those were not crucial for quantitatively modeling algal C : N : Chl quotas. WhileC.
socialismay not be the dominant species in all coastal Arctic phytoplankton blooms, we argue that it is representative for chain-forming diatoms typically dominating these systems due to their shared needs and responses to nutrient limita- tions (e.g., Eilertsen et al., 1989; von Quillfeldt, 2005).
4.1 Silicon–nitrogen regeneration
Spring phytoplankton dynamics in Arctic and sub-Arctic coastal areas is typically characterized by an initial exponen- tial growth of diatoms, followed by peaks of other taxa (like Phaeocystis pouchetii) soon after the onset of silicate limi- tation (Eilertsen et al., 1989). Thus, a shift in species com- position for the secondary bloom is linked to silicate limi- tation prior to final bloom termination caused by inorganic nitrogen limitation. As suggested by our second hypothe- sis, photosynthesis was reduced by approx. 70 % after sili- cate became limiting, which is comparable to earlier experi-
1728 T. R. Vonnahme et al.: Modeling silicate–nitrate–ammonium co-limitation of algal growth
Figure 4.Total particulate organic(a)carbon (POC)(b)nitrogen (PON),(c)C : N ratios, and(d)chlorophyllaconcentration in experimental cultures (the asterisk indicates a presumed measurement error). Blue symbols are BAC−cultures and red show BAC+cultures. Circles show median values (blue=BAC−, red=BAC+) and the colored polygons show the maximum and minimum of measured data (n=2–3, Table S2). The grey line indicates the start of the stationary phase.
mental studies (Tezuka, 1989). However, as suggested by our first hypothesis, the secondary bloom was extended in time by bacterial regeneration of ammonium, allowing regener- ated production to contribute about 69 % of the total pro- duction (f ratio=0.31) even during the diatom-dominated scenario in our experimental incubation. With the start of the stationary phase, NH4and PO4concentrations doubled, presumably due to decreased assimilation by the silicate- starved diatoms and increased regeneration by bacteria, sup- plied with increasing labile DOM (doubled remineralization rate in EXT) excreted by the stressed algae. However, NH4 concentrations doubled within 4 d, while PO4concentrations doubled in only 1 d, indicating some unexplained internal dynamics, potentially via different bacterial uptake and re- lease of N and P. After NO3 depletion at day 15, the PO4 concentrations also dropped, indicating a coupling of N : P metabolism but not of NH4: P metabolism. Thus, the sud- den drop may also indicate dynamics of bottle experiments, which are not accounted for, showing potential limitations of
these experiments. The presence of bacteria and thus regener- ated production allowed diatom growth to continue 8 d after silicate became limiting (Figs. 2, 3 and 4), nearly doubling the growth period similar to observations in the field (e.g., Legendre and Rassoulzadegan, 1995; Johnson et al., 2007), which supports our hypotheses I and III.
The G98 model has its most severe limitation in the mod- eling of PON, simply due to the lack of the ammonium pool, supplied via bacterial regeneration. The substantially better fit of PON in the EXT model therefore clearly shows that bacterial remineralization is crucial to successfully mod- eling spring bloom dynamics, especially near bloom ter- mination. Many biogeochemical models used in the Arctic include remineralization but rely on fixed or temperature- dependent rates and do not consider them bacteria-dependent (MEDUSA, LANL, NEMURO, NPZD; see Table 1). While this simplification allows modeling regenerated production, using bacteria-independent remineralization rates does have limitations under spring bloom scenarios, where bacteria
Figure 5.Model fit of the EXT model to the BAC− (blue) and BAC+(red) experiment. Circles show median values, and the colored polygons show the maximum and minimum of measured data (n=2–3, Table S2). Solid lines show the model outputs of(a)POC,(b)PON, (c)Chl (the asterisk indicates a presumed measurement error) ,(d)C : N,(e)C : Chl, and(f)N : Chl. Dotted lines show the model fit without additional carbon excretion termxf. At day 8 the threshold for silicate limitation is reached, leading to reduced photosynthesis (by the factor given by SiPS) and inhibited Chl synthesis, which is visible as sharp transitions in POC and Chl.
biomass can vary over orders of magnitudes (e.g., Sturluson et al., 2008) as also seen in our experimental study.
While we do not expect the f ratio in our bottle experi- ment to be directly comparable to an open-ocean system due to the higher biodiversity of field communities, a comparison can aid to identify limitations in our experiment and model.
The f ratio can be used as a measure to check how repre- sentative the cultivation study was for typical spring bloom dynamics (Hypothesis III). Regenerated production is sig- nificant in polar systems, and our estimated experimental f value of 0.31 is slightly below the average for polar sys- tems (Harrison and Cota, 1991, meanf ratio=0.54). Nitri- fication is a process supplying about 50 % of the NO3 used for primary production in the oceans, which may lead to a substantial underestimation of regenerated production (Yool et al., 2007), inflating the f ratio interpreted as an estimate
for new production, potentially also in the study by Harri- son and Cota (1991). The absence of vertical PON export in our experiment may be another explanation for the above- average fraction of regenerated production. In the ocean en- vironment, regenerated production is also affected by verti- cal export (sedimentation) and grazing, which are not repre- sented in the experimental incubations. Via sedimentation, a fraction of the bloom either in the form of direct algal sinking of fecal pellets is typically exported to deeper water layers, reducing the potential for N regeneration within the euphotic zone (e.g., Keck and Wassmann, 1996). Larger zooplankton grazing can lead to increased export of PON via fecal pel- let aggregation, or diel vertical migration (Banse, 1995), but may also release ammonium and urea (Conover and Gus- tavson, 1999; Saiz et al., 2013).
1730 T. R. Vonnahme et al.: Modeling silicate–nitrate–ammonium co-limitation of algal growth
Figure 6.Model fit of the EXT model to the BAC− (blue) and BAC+(red) experiment. Circles show median values, and the colored polygons show the maximum and minimum of measured data (n=1–3, Table S2). Solid lines show the model outputs of(a)DIN (NOXand NH4),(b)NOx,(c)NH4, and(d)Si(OH)4(all model fits overlap).
In contrast, bacterial death by microflagellate grazing and viral lysis may supply additional nutrients, or DON available for N regeneration in the euphotic zone (e.g., Goldman and Caron, 1985), which potentially leads to an overestimation of regenerated production. Another potentially important N source for regenerated production may be urea (Harrison et al., 1985), which would lead to an even higher importance of regenerated production as suggested by our study. Hence, ecosystem-scale models will need to consider these dynam- ics regarding bacterial abundances, microbial networks and particle export in addition to bacterial remineralization in order to model realistic ammonium regeneration in the eu- photic zone. Overall, our cultivation experiment was power- ful enough to represent major aspects of spring bloom dy- namics but has its limitations, thereby confirming our third hypothesis only to some extent.
Bacteria-mediated silicate regeneration is absent from the modeling approach, as indicated by the identical silicate con- centrations in both treatments and models (Fig. 2d). In the environment silicate dissolution is, in fact, mostly described
as an abiotic process with temperature as the main control and a minor contribution by bacterial remineralization (Bidle and Azam, 1999). Our experiment indicates that silicate dis- solution forChaetoceros socialiswas negligible at cold tem- peratures and the timescale of the incubations and typical for bloom durations and residence times of algae cells in the euphotic zone (Eilertsen et al., 1989; Keck and Wassmann, 1996). We conclude that silicate dissolution in coastal Arctic systems happens most likely in the sediment or deeper water layers and is only supplied via mixing in winter. In Antarc- tica substantial silicate dissolution has been observed but not in the upper 100 m, which has been related to the low tem- peratures (Nelson and Gordon, 1981) in agreement with our conclusion. Hence, modeling silicate regeneration in the eu- photic zone is not necessary in these systems.
4.2 Algal growth response to Si and N limitation The response of diatoms to Si or N limitation is based on different dynamics and different roles of N and Si in diatom growth. N is needed for proteins and nucleic acids, and its
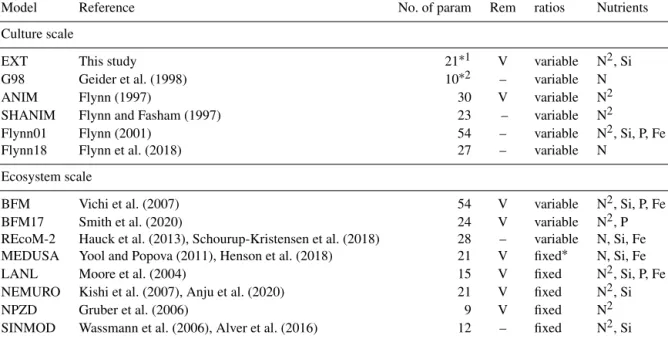
Table 1.A comparison of major components contributing to the complexity of different models discussed. “No. of param” is the number of parameters. In the case of ecosystem models (SINMOD, BFM, MEDUSA, LANL, NEMURO, NPZD) only the model formulations representing the components of the current model (phytoplankton growth, remineralization, nutrient dynamics) are considered. For the full ecosystem-scale models we give the original reference to the biogeochemical compartment of the ecosystem-scale models and examples for more recent versions with updated formulations of other model compartments (e.g., physical drivers). REM designates those models that include remineralization (Rem); marked with “V” is present and “–” is absent. Ratios shows if the stoichiometry in the model considers variable or fixed ratios of intracellular elements (C : N : Si : P : Fe). The nutrients considered are given under the nutrients column. If DIN is considered as both NH4and NO3, N is shown as N2. MEDUSA has Fe-dependent Si : N ratios, which makes them fixed in the Arctic (entry fixed∗in the Table).
Model Reference No. of param Rem ratios Nutrients
Culture scale
EXT This study 21∗1 V variable N2, Si
G98 Geider et al. (1998) 10∗2 – variable N
ANIM Flynn (1997) 30 V variable N2
SHANIM Flynn and Fasham (1997) 23 – variable N2
Flynn01 Flynn (2001) 54 – variable N2, Si, P, Fe
Flynn18 Flynn et al. (2018) 27 – variable N
Ecosystem scale
BFM Vichi et al. (2007) 54 V variable N2, Si, P, Fe
BFM17 Smith et al. (2020) 24 V variable N2, P
REcoM-2 Hauck et al. (2013), Schourup-Kristensen et al. (2018) 28 – variable N, Si, Fe MEDUSA Yool and Popova (2011), Henson et al. (2018) 21 V fixed∗ N, Si, Fe
LANL Moore et al. (2004) 15 V fixed N2, Si, P, Fe
NEMURO Kishi et al. (2007), Anju et al. (2020) 21 V fixed N2, Si
NPZD Gruber et al. (2006) 9 V fixed N2
SINMOD Wassmann et al. (2006), Alver et al. (2016) 12 – fixed N2, Si
Degrees of freedom after constraints by the measured data are∗114 and∗26.
uptake is mainly driven by phototrophic reactions (Martin- Jézéquel et al., 2000). Si is only needed for frustule forma- tion and cell division, mostly during a specific time in the cell cycle (G2 and M phase, Hildebrand, 2002), and the assimi- lation is mostly driven by heterotrophic reactions (Martin- Jézéquel et al., 2000). Once N is limiting, growth rapidly stops (Geider et al., 1998). In the case of Si limitation, how- ever, growth can continue with a slower rate if N is still available (Werner, 1978; Gilpin et al., 2004). Several stud- ies found a reduced growth rate with weaker silicified cell walls (Hildebrand, 2002; Gilpin, 2004) but unaffected nitro- gen assimilation under silicate limitation (Hildebrand, 2002;
Claquin et al., 2002) in accordance with our study. Claquin et al. (2002) found variable Si : C and Si : N ratios and highly silicified cells under nitrogen limitation, indicating uncou- pled Si and N : C metabolism.
Nitrogen is a crucial element as part of amino acids and nucleic acids, which are necessary for cell activity and growth. If N becomes limiting, major cellular processes are affected and growth or chlorophyll synthesis is not possi- ble. Photosynthesis can continue for a while, leading to car- bon overconsumption (Schartau et al., 2007), which is well modeled by G98 for both BAC+and BAC−. A part of the
excess carbon can be stored as intracellular reserves, and a part is excreted as DOC, which may aggregate as EPS, con- tributing to the total POC pool. The excess carbon can po- tentially be toxic for the algae and excretion, and extracellu- lar degradation by bacteria may be crucial for algal survival (Christie-Oleza et al., 2017). Quantitatively, N limitation is well modeled by G98 under BAC−conditions, if only one nitrogen source plays a role. However, under longer nitrogen starvation times or higher light intensities, alternative mod- els that include carbon excretion and aggregation (Schartau et al., 2007) or intracellular storage in reserve pools (Ross and Geider, 2009) might be needed. Our growth experiment clearly shows that C : N ratios are not fixed, and variable quotas are needed. Vichi et al. (2007) estimated that carbon- based models that do not consider variable C : N ratios may underestimate net primary production (NPP) by 50 %, argu- ing for the importance of quota-based models (Fransner et al., 2017). However, most ecosystem-scale models are sim- plified by using fixed C : N ratios (Table 1). The next step towards quota-based models is the consideration of more de- tailed cell-based characteristics, such as transporter density, cell size, and mobility, including sedimentation (Aksnes and Egge, 1991). Flynn et al. (2018) discuss a model with de-
1732 T. R. Vonnahme et al.: Modeling silicate–nitrate–ammonium co-limitation of algal growth tailed uptake kinetics showing that large cells are overall dis-
favored over small cells due to higher half-saturation con- stants but that they may still have competitive advantages due to lower investment in transporter production. Increased sedimentation in larger cells also increases the mobility and may offset the disadvantage of a larger size. While this ex- tension is too complex for our aim of a simplified model, the dynamics may become important when modeling different algae taxa.
The type of inorganic nitrogen available also affects nitro- gen uptake. Due to the metabolic costs related to intracel- lular nitrate reduction to ammonium, ammonium uptake is preferred over nitrate, potentially leaving more energy for other processes (Lachmann et al., 2019). Ammonium can even inhibit or reduce nitrate uptake over certain concen- trations (Morris, 1974). The dynamics are mostly controlled by intracellular processes, such as glutamate feedbacks on nitrogen assimilation, cost for nitrate conversion to ammo- nium, or lower half-saturation constants of ammonium trans- porters (Flynn et al., 1997). The most accurate representa- tion of these dynamics is given in the ANIM model by Flynn et al. (1997), but the model is too complex for implementa- tions in larger ecosystem models. The number of parameters is difficult to tune with the typically limited availability of measured data, and its complexity makes it also computa- tionally costly to scale up the models. Typically, modeling ammonium–nitrate interactions by different half-saturation constants and inhibition of nitrate uptake by ammonium ap- pears sufficient (e.g., BFM, LANL, NEMURO, Table 1) and has been adapted in our model.
Studies on the coupling of silicate limitation on C, N, and Chl show inconclusive patterns, including a complete decou- pling (Claquin et al., 2002), a relation of N to Si (Gilpin et al., 2004), and reduction of photosynthesis without new chlorophyll production (Werner, 1978; Gilpin et al., 2004).
Cell size is limited by the frustules, but cells may become more nutritious (higher N : C ratio), or simply excrete more DOM, which may aggregate and contribute to the PON and POC pools. A detailed cell-cycle-based model has been sug- gested by Flynn (2001), but the number of parameters (30) makes the model too complex for ecosystem-scale mod- els. In ecosystem-scale models Si limitation is modeled in various simplifications, such as thresholds triggering a stop (MEDUSA), reduction (e.g., BFM, MEDUSA, SINMOD) of the Si-dependent production (Table 1), or Si : N ratio scaled production (NEMURO, Table 1).
Our cultivation study shows (i) that a threshold value in the model, leading to a stop or solely Si-dependent photo- synthesis, has its limitations, since DIN controlled photo- synthesis continues at lower rates, and (ii) that coupling of Si : N : C : Chl is present. We do not expect a direct Si : N coupling, due to different controls of Si and N metabolism (Martin-Jézéquel et al., 2000) but suggest indirect coupling via reduced photosynthesis. In fact, detailed photophysiolog- ical and molecular approaches under Si limitation found in-
hibited PSII reaction centers (Lippemeier et al., 1999) similar to the decreased QY in our experiment and down-regulated photosynthetic proteins (Thangaraj et al., 2019) under Si lim- itation. Thus, we modeled the response of diatom growth to silicate limitation by reducing photosynthesis through a pa- rameterized fraction (SiPS) and a stop of chlorophyll synthe- sis below a certain threshold, based on experimental studies (Werner, 1978; Lippemeier et al., 1999; Gilpin et al., 2004;
Thangaraj et al., 2019) and in accordance to other ecosystem- scale approaches. We suggest that this extension is more ac- curate than the typical threshold-based dynamics, with one limiting nutrient controlling the growth equally for POC and Chl production (e.g., SINMOD by Wassmann et al., 2006;
BFM by Vichi et al., 2007) while still keeping the number of parameters low compared to very detailed cell-cycle-based models (e.g., Flynn, 2001; Flynn et al., 2018).
4.3 Importance of algae–bacteria interactions and DOC excretion
As described above, N or Si limitation can lead to excretion of DON and DOC, which can aggregate as EPS and be avail- able for bacterial regeneration of ammonium. For accurately including EPS dynamics in the model, additional data would be needed. However, the importance of EPS formation is ev- ident in the end of the BAC+experiment. Firstly, a biofilm was clearly visible, containing about 30 % of the algae cells.
While we would not expect biofilms in the open ocean, ag- gregation of algae cells, facilitated by EPS, is common to- wards the end of spring blooms, increasing vertical export fluxes (e.g., Thornton, 2002).Chaetoceros socialisis in fact a colony-forming diatom building EPS-rich aggregates in na- ture (Booth et al., 2002). Secondly, POC and PON concen- trations increased, while cell numbers and sizes stayed con- stant, showing that the additional POC and PON was most likely part of an extracellular pool. Silicate limitation could be one trigger for enhanced exudation. In fact, the biofilm dynamics evaluated (DOC aggregation, increased excretion) showed similar dynamics as the SiPSterm. Since the biofilm formation corresponds with silicate limitation, it is difficult to untangle the direct effects of the biofilm or the indirect effects of silicate limitation without additional data or ex- periments (e.g., EPS measurements, DOM characterization).
However, our model run, including EPS aggregation, allowed an improved overall fit while reducing the SiPSterm to val- ues more similar to earlier studies (Werner, 1978), pointing to the importance of DOC and DON aggregation. Hence, we suggest that Si limitation and EPS aggregation are both im- portant.
Interestingly, algae–bacteria interactions can be species- specific, with specific organic molecules excreted by the al- gae to attract specific beneficial bacteria (Mühlenbruch et al., 2018). Thereby bacteria are crucial for recycling ammonium but also to degrade potentially toxic exudates (Christie-Oleza et al., 2017).
In the BAC−experiment, carbon excretion after carbon overconsumption could be expected following Schartau et al. (2007), but no indications, such as biofilm formation or increased POC per cell, were found. In fact, a model con- sidering EPS aggregation led to a substantially worse fit to BAC−. This indicates that carbon overconsumption has been of minor importance, likely due to the low light levels. An al- ternative explanation is that bacteria and potentially chemo- taxis are important controls on algal carbon excretion (Müh- lenbruch et al., 2018). Overall, DOM excretion and EPS dy- namics appear to play a major role in quantitatively model- ing C : N : Chl quotas in our experiment, with higher errors (RMSEEXT-excr=5.73, RMSEEXT=2.31) for a model run without than with the excretion termxf.
4.4 Considerations in a changing climate
Due to a rapid changing climate, especially in Arctic coastal systems, the dynamics addressed in this study will change (Tremblay and Gagnon, 2009). With warmer temperatures, heterotrophic activities, and thereby bacterial recycling, will increase (Kirchman et al., 2009). Our study showed that re- generated production is crucial for an extended spring bloom.
Hence, higher heterotrophic activities may lead to extended blooms (increased bacterial regeneration). At the same time, higher temperatures and increased precipitation will lead to stronger and earlier stratified water columns, which will lead to less nutrients reaching the surface by winter mix- ing, reducing new production (decreased bacterial regener- ation) (Tremblay and Gagnon, 2009; Fu et al., 2016). Conse- quently, the phenology of Arctic coastal primary production in a warmer climate will likely be increasingly driven by bac- terial remineralization, showing the necessity to include this process into biogeochemical models. An earlier temperature- driven water column stratification may also lead to an earlier bloom. However, due to increasing river and lake brownifica- tion and sediment resuspension, the spring bloom may also be delayed (Opdal et al., 2019). With decreased light, carbon overconsumption as described by Schartau et al. (2007) may become less important due to decreased photosynthesis. An earlier or later phytoplankton bloom can lead to a mismatch with zooplankton grazers (Durant et al., 2007; Sommer et al., 2007). Reduced zooplankton production would decrease the fecal-pellet-driven vertical export and thereby increase the residence time of particulate organic matter (POM) in the euphotic zone and the potential for ammonium regeneration.
Thus, the incorporation of bacterial recycling into ecosystem models may be even more important under this scenario. In fact, global climate change models agree that vertical car- bon export is decreasing overall (Fu et al., 2016). Silicate re- generation is thought to be mostly controlled abiotically by temperature (Bidle and Azam, 1999). Thus, increasing tem- perature and a stronger stratification will allow recycling of silicate in the euphotic zone before sinking out and thus could cause a shift in the algal succession observed during spring
with prolonged contributions of diatoms (Kamatani, 1982).
Thus, a temperature-dependent silica dissolution may need to be included for models in a substantially warmer climate in further model developments. Increased precipitation will also lead to increased runoff and allochthonous DOM inputs, in- creasing the importance of terrestrial DOM degradation and decreasing the relative importance of algal exudate regener- ation (Jansson et al., 2008). The low light levels and the ab- sence of grazing and export fluxes are simplifications of our study, which are, however, expected to be realistic scenarios under climate change. Hence, we suggest that our experiment and model are well suited as a baseline for predictive ecosys- tem models investigating the impacts of climate change on coastal Arctic spring blooms. However, climate change may lead to shifts in algae communities with non-silicifying al- gae dominating over diatoms (e.g., Falkowski and Oliver, 2007), reducing the importance of silicate limitation. Thus, conducting similar experiments and modeling exercises with a wider range of algal taxa and different temperature and nu- trient regimes is suggested.
1734 T. R. Vonnahme et al.: Modeling silicate–nitrate–ammonium co-limitation of algal growth Appendix A
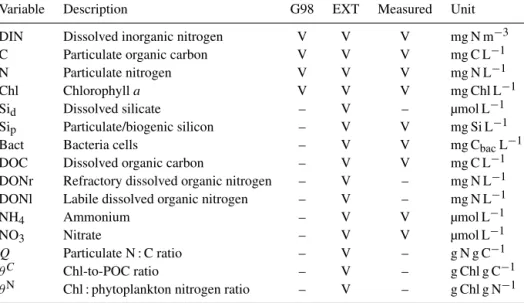
Table A1.State variables of the G98 model and the EXT model (marked with “V” if present and “–” if absent) with units and designation if these state variables had been measured in the experiment.
Variable Description G98 EXT Measured Unit
DIN Dissolved inorganic nitrogen V V V mg N m−3
C Particulate organic carbon V V V mg C L−1
N Particulate nitrogen V V V mg N L−1
Chl Chlorophylla V V V mg Chl L−1
Sid Dissolved silicate – V – µmol L−1
Sip Particulate/biogenic silicon – V V mg Si L−1
Bact Bacteria cells – V V mg CbacL−1
DOC Dissolved organic carbon – V V mg C L−1
DONr Refractory dissolved organic nitrogen – V – mg N L−1
DONl Labile dissolved organic nitrogen – V – mg N L−1
NH4 Ammonium – V V µmol L−1
NO3 Nitrate – V V µmol L−1
Q Particulate N : C ratio – V – g N g C−1
θC Chl-to-POC ratio – V – g Chl g C−1
θN Chl : phytoplankton nitrogen ratio – V – g Chl g N−1