New High-Tech Flexible Networks for the Monitoring of Deep-Sea Ecosystems
Jacopo Aguzzi,*,† Damianos Chatzievangelou,‡Simone Marini,§Emanuela Fanelli,∥ Roberto Danovaro,∥,⊥ Sascha Flögel,# Nadine Lebris,∇Francis Juanes,● Fabio C. De Leo,●,○ Joaquin Del Rio,¶ Laurenz Thomsen,‡ Corrado Costa,⊗
Giorgio Riccobene,▲ Cristian Tamburini,ΔDominique Lefevre,Δ Carl Gojak,⧫Pierre-Marie Poulain,◊Paolo Favali,£,∞
Annalisa Griffa,§Autun Purser,■ Danelle Cline,□Duane Edgington,□ Joan Navarro,† Sergio Stefanni,⊥ Steve D’Hondt,★ Imants G. Priede,☆,@ Rodney Rountree,●,∀ and Joan B. Company†
†Instituto de Ciencias del Mar (ICM-CSIC), Paseo Marítimo de la Barceloneta, 37-49, 08012 Barcelona, Spain
‡Jacobs University, 28759 Bremen, Germany
§Institute of Marine Sciences, National Research Council of Italy (CNR), 19036 La Spezia, Italy
∥Department of Life and Environmental Sciences, Polytechnic University of Marche, 60121 Ancona, Italy
⊥Stazione Zoologica Anton Dohrn (SZN), 80121 Naples, Italy
#GEOMAR, 24148 Kiel, Germany
∇Oceanological Observatory, CNRS LECOB, Sorbonne University, 66650 Banyuls-sur-mer, France
●Department of Biology, University of Victoria, Victoria, British Columbia V8W 2Y2, Canada
○Ocean Networks Canada (ONC), University of Victoria, Victoria, British Columbia V8N 1V8, Canada
¶OBSEA, SARTI, Universitat Politècnica de Catalunya (UPC), 08800 Barcelona, Spain
⊗Consiglio per la ricerca in agricoltura e l’analisi dell’economia agraria (CREA-IT), 00198 Monterotondo, Italy
▲Istituto Nazionale di Fisica Nucleare (INFN), Laboratori Nazionali del Sud, 95125 Catania, Italy
ΔInstitut Méditerranéen d’Océanoloie (MIO), 13288 Cedex 09 Marseille, France
⧫DT INSU, 83507 La Seyne-sur-Mer, France
◊Istituto Nazionale di Oceanografia e Geofisica Sperimentale (OGS), 34010 Trieste, Italy
£Istituto Nazionale di Geofisica e Vulcanologia (INGV), 00143 Rome, Italy
∞European Multidisciplinary Seafloor and Water-Column Observatory European Research Infrastructure Consortium (EMSO ERIC), 00143 Rome, Italy
■Alfred Wegener Institute (AWI). 27515 Bremerhaven, Germany
□Monterey Bay Aquarium Research Institute (MBARI), Moss Landing, California 95039, United States
★Graduate School of Oceanography, University of Rhode Island, Narragansett, Rhode Island 02882, United States
☆University of Aberdeen, Aberdeen AB24 3FX, United Kingdom
@Hellenic Centre for Marine Research, 71003 Heraklion Crete, Greece
∀The Fish Listener, 23 Joshua Lane, Waquoit, Massachusetts 02536, United States
ABSTRACT: Increasing interest in the acquisition of biotic and abiotic resources from within the deep sea (e.g.,fisheries, oil−gas extraction, and mining) urgently imposes the development of novel monitoring technologies, beyond the traditional vessel-assisted, time-consuming, high-cost sampling surveys. The implementation of permanent networks of seabed and water-column-cabled (fixed) and docked mobile platforms is presently enforced, to cooperatively measure biological features and environmental (physicochemical) parameters. Video and acoustic (i.e., optoacoustic) imaging are becoming central approaches for studying benthic fauna (e.g., quantifying species presence, behavior, and trophic
continued...
Received: January 19, 2019 Revised: April 23, 2019 Accepted: May 10, 2019 Published: May 10, 2019
pubs.acs.org/est Cite This:Environ. Sci. Technol.2019, 53, 6616−6631
Downloaded via STIFTUNG ALFRED WEGENER INST on October 23, 2019 at 10:27:43 (UTC). See https://pubs.acs.org/sharingguidelines for options on how to legitimately share published articles.
interactions) in a remote, continuous, and prolonged fashion. Imaging is also being complemented by in situ environmental- DNA sequencing technologies, allowing the traceability of a wide range of organisms (including prokaryotes) beyond the reach of optoacoustic tools. Here, we describe the different fixed and mobile platforms of those benthic and pelagic monitoring networks, proposing at the same time an innovative roadmap for the automated computing of hierarchical ecological information on deep-sea ecosystems (i.e., from single species’abundance and life traits to community composition, and overall biodiversity).
1. INTRODUCTION
Throughout the Anthropocene Era1the human footprint on the ecosystems of the global ocean has been increasing continu- ously.2 Since this footprint is rapidly expanding toward great depths, the need for a global observing effort in the deep ocean is crucial.3 Accurate monitoring of our incursive impacts on marine ecosystems, however, requires the development of novel and effective technological solutions.
The deep-sea seafloor and overlying waters (below 200 m depth) form the largest biome on Earth, although it remains poorly explored.4−6The monitoring of key ecosystem features and functions has proven difficult, owing to the extreme environmental conditions associated with these depths (e.g., high pressures, low temperatures, corrosiveness, and remote- ness), coupled with limited sampling capabilities offered by low numbers of adequately equipped research vessels.7
In order to sustain correct management and protection actions, a spatiotemporally extended monitoring regime must be implemented to gather data on species and their communities across the vast extent of the great global ocean basins.8 Clear examples of shortfalls in current data include the lack of knowledge on biomass, abundance, reproductive cycles, population dynamics (i.e., growth and mortality), migrations, and geographic ranges.9Furthermore, community biodiversity, food web structures and the influence of organic matter transfer within ecosystem compartments and across boundaries are also poorly studied in relation to the neighboring shallower and coastal ecosystems.10All these aspects have repercussions on penetration and propagation of the human footprint into marine ecosystems (e.g., pollutants and microplastics11).
To fill these knowledge gaps, the efficient integration of ongoing technological developments into a strategic framework for deep-sea monitoring is critical (e.g., see ref 12). Such development should be capable of producing tools for the spatiotemporal location and quantification of deep-sea organ- isms across a wide range of body sizes, as well as their activity and response to changing environmental conditions and anthro- pogenic stressors.
1.1. Objectives. In this study, we review the status and development of high-tech, interactive networks of fixed and mobile platforms, currently used for spatiotemporallyflexible and appropriate monitoring of deep-sea ecosystems. We propose an innovative roadmap for the hierarchical extraction of ecosystem indicators related to assemblage structure, biodiversity, and ecosystem functioning, as obtained from biological variables encompassing species abundances, demo- graphic descriptors, and behavior. We center our analysis on ecosystem indicators extracted from video and acoustic imaging of marine megafauna (i.e., organisms of size from centimeters and above), representing the apical ecological complexity component, that is fundamental in conditioning ecosystem functioning, services, and health.13
2. GROWING HIGH-TECH CABLED OBSERVATORY NETWORKS
The ongoing technological development in seafloor cabled observatories is motivated by the growing awareness about the strategic value of acquiring multidisciplinary biological and environmental data in a concomitant fashion, in order to derive putative cause−effect relationships as drivers of ecosystem changes.14−16 The successful integration of such platforms equipped with camera systems, multiparametric bio-geo- chemical, oceanographic, and biological sensors with seafloor power and communication cables now allows the remote, continuous, high-frequency (>1 Hz as real time), long-term (up to decades) monitoring of the deep-sea biome.17In this highly integrated monitoring approach, megafauna identification, tracking, and counting through optoacoustic and new molecular sensors should be a key focus, in relation to productivity and services (e.g.,fishery18).
Throughout the past two decades, cabled observatories have provided relevant data, helping tofill the gaps in knowledge on species’ presence, behavior, and associated changes in biodiversity and ecosystem function (Table 1). Unfortunately, cabled systems arefixed and have limited spatial coverage when the deep continental margins and ocean basins are considered as a whole.8,18 An attempt to overcome such a limitation has occurred in some cases through the installation of a local network of seabed platforms. Good examples are the Ocean Network Canada (ONC), Deep-Ocean Environmental Long- Term Observatory System (DELOS), and Lofoten Verlag Observatory (LoVe) respectively in Juan de Fuca plate (NW Pacific), offAngola (SE Atlantic), and in Norway.19−22
The deployment of observatory modules in clusters with separation distances on the order of hundreds of meters or a few kilometres is presently envisaged to maximize the ability to quantify species distributions and habitat associations over multiple scales (seeTable 1). Deploying multiple ecosystem observatory clusters along environmental or habitat gradients would be effective in elevating the system from examination of local habitats to ecosystem level observation. Each node can acquire imaging and acoustic as well as multiparametric environmental data in a temporally coordinated fashion.
Accordingly, temporal changes in species’ presence and abundance in an area of the deep sea can be tracked through neighboring environments.23,24
2.1. Increased Spatial Monitoring Capability with Permanent Mobile Platforms. Nevertheless, networks of cabled observatories are not enough to ensure efficient monitoring across highly variable benthic seascapes.18Presently, there is a drive to integrate mobile platforms through docking stations into existing cabled observatory infrastructures, to provide extended coverage at local, regional, and basin-wide spatial scales, both on the seafloor and within the water column (Figure 1). Benthic mobile platforms are represented by crawlers: a new class of internet operated vehicles (IOVs), tethered to cabled observatories.25 These tracked vehicles are
Table1.BiologicalStudiesfromPermanent,AutonomousPlatforms:WorldwideApplicationsofMonitoringofDeep-WaterandDeep-SeaEcosystemsbyCabled ObservatoriesandCrawlers,atDifferentEcologicallyRankedLevels(i.e.Individual,Population,Community,andEcosystem) hierarchicalstepmonitoredbiologicalvariableorecosystem indicatorcabledplatformpublication 1.(semi-)automateddetection,countingandclassificationbyoptoelectronicmethods(imaging)cold-seepfaunaabundanceJAMSTECCabledObservatory(1100m;NWPacific)111,112 macrofaunalabundanceLoVeOceanObservatory(250m;NorwegianSea)22 zooplanktonabundanceNEPTUNECabledObservatory (ONC;BarkleyCanyon;400−1000m;NEPacific)113 benthicfaunaabundance,bacterialmat coverageVENUSCabledObservatory (ONC;SaanichInlet;100m;NEPacific)44 biologicalscatteringlayersclassification114 2.(semi-)automateddetection,countingandclassificationbypassiveacousticmonitoring(PAM)cetaceanabundanceALOHACabledObservatory(4700m;CentralPacific)115 ANTARESNeutrinoTelescope (2500m;WesternMediterranean)116 MARSCabledObservatory(MBARI;900m;NEPacific)117 NEMO-SN1(OnDE;EMSO;KM3NeT-It; 2100m;CentralMediterranean)
118,119 NEPTUNECabledObservatory (ONC;Endeavor;2200m;NEPacific)120 NEPTUNECabledObservatory(ONC;CascadiaBasin; 2700m;NEPacific)121 NEPTUNECabledObservatory (ONC;BarkleyCanyonslope;400−1000m;NEPacific)122 zooplanktonabundanceNEPTUNECabledObservatory (ONC;BarkleyCanyonslope;400−1000m;NEPacific)113 3.Behavioralandlifetraits(e.g.,morphology,rhythms,motility,trophicinteractions,territoriality,etc.)cetaceandielactivityALOHACabledObservatory(4700m;CentralPacific)115 ANTARESNeutrinoTelescope (2500m;WesternMediterranean)116 cold-seepfaunamovement,behaviorand dielactivityJAMSTECCabledObservatory(1100m;NWPacific)111 cold-seepfaunadielandtidalrhythms112 environmentalvariabilityandcarcass decomposition43 cetaceandielactivityMARSCabledObservatory(MBARI;900m;NEPacific)117 NEMO-SN1(OnDE;EMSO;KM3NeT-It; 2100m;CentralMediterranean)119 deep-seainertialbioluminescencerhythmsNEMOPhase-2tower (KM3NeT-It;2500m;CentralMediterranean)40 benthicmegafaunamovementNEPTUNECabledObservatory (ONC;BarkleyCanyonshelf-break;400m;NEPacific)67 benthicfaunamovementNEPTUNECabledObservatory (ONC;BarkleyCanyonslope;600−1000m;NEPacific)123 benthicfaunabehavioranddielactivity124 benthicfaunadielactivity47 cetaceandielactivity122 hydrothermalventfaunabehavioranddiel activityNEPTUNECabledObservatory (ONC;Endeavor;2200m;NEPacific)125 hydrothermalventfaunadielactivity126 hydrothermalventmacrofaunarhythms16 cold-seepfaunadielactivityNEPTUNECabledObservatory (ONC;BarkleyCanyonhydrates;900m;NEPacific)127
Environmental Science & Technology
Table1.continued hierarchicalstepmonitoredbiologicalvariableorecosystem indicatorcabledplatformpublication cold-seepfaunabehavior23 environmentalvariabilityandcarcass decompositionVENUSCabledObservatory(ONC;StraitofGeorgia; 300m;NEPacific)128 VENUSCabledObservatory(ONC;SaanichInlet; 100m;NEPacific)129 benthicfaunabehaviorVENUSCabledObservatory(ONC;SaanichInlet; 100m;NEPacific)130 benthicfaunadielactivity131 benthicfaunabehavior,dielandtidal rhythms132 biologicalscatteringlayersclassification114 4.populationdemography,dynamicsanddistribution(e.g.,abundance/biomass,sizeclasses,sexratio,seasonality, growthandreproductioncycles,spatialdistribution,etc.)cetaceanseasonalityALOHACabledObservatory(4700m;CentralPacific)115 deep-seaepisodicbioluminescencebloomsANTARESNeutrinoTelescope (2500m;WesternMediterranean)41 cold-seepbivalvespawningandfecundityJAMSTECCabledObservatory(1200m;NWPacific)133 macrofaunalspatialdistributionLoVeOceanObservatory(250m;NorwegianSea)22 cetaceanseasonalityMARSCabledObservatory(MBARI;900m;NEPacific)117 NEMO-SN1(OnDE;EMSO;KM3NeT-It; 2100m;CentralMediterranean)119,38 cetaceansizeestimation118 benthicmegafaunaabundanceandsizeNEPTUNECabledObservatory (ONC;BarkleyCanyonshelf;400m;NEPacific)67 DELOSobservatories(1400m,SWAtlanticoffAngola)20 benthicfaunaseasonalandinterannual trendsNEPTUNECabledObservatory (ONC;BarkleyCanyonslope;400−1000m;NEPacific)123 zooplanktonseasonalandinterannual trends113 benthicfaunasizeclassesandmigrations124 benthicfaunaseasonality134 benthicfaunaseasonalityDELOSobservatories(1400m,SWAtlanticoffAngola)20 cold-seepfaunaspatialdistributionNEPTUNECabledObservatory (ONC;BarkleyCanyonhydrates;900m;NEPacific)135 cold-seepfaunaseasonalityand reproductivecycles23 cold-seepfaunaseasonality24 hydrothermalventfaunamicrohabitatuseNEPTUNECabledObservatory (ONC;Endeavor;2200m;NEPacific)125,126 cetaceanseasonality,interannualtrendsand spatialdistribution120 benthicfaunasizeclasses,seasonalityand microhabitatuseVENUSCabledObservatory (ONC;SaanichInlet;100m;NEPacific)130 benthicfaunasizeclassesandseasonality136 biologicalscatteringlayersclassification114 5.biodiversity(e.g.,composition,richness,α/β/γdiversity,etc.)cold-seepfaunadiversityNEPTUNECabledObservatory (ONC;BarkleyCanyonhydrates;900m;NEPacific)135 benthicfaunadiversityNEPTUNECabledObservatory (ONC;BarkleyCanyonslope;900−1000m;NEPacific)123,134
capable of real-time navigation control and data collection via simple web browser interfaces operable from anywhere. At the same time, a new class of rovers, nontethered benthic mobile crawlers, are entering into active research, capable of automati- cally returning to the docking station for charging, data transfer, or recovery.26 To complement the seafloor monitoring capacities of crawler systems, pelagic monitoring is presently achieved using tethered remotely operated vehicles (ROVs) and free swimming autonomous underwater vehicles (AUVs), some of which may also dock with cabled stations for energy recharge and data transmission.27 These also allow monitoring of the water column at a high frequency over extended periods and across depth strata.28,29
Each of these mobile platforms provides a unique contribution to the ecosystem observatory, as well as some task redundancy. The AUV equipped with imaging or acoustic devices is ideally suited for habitat and biota distribution mapping30,31and can be used to conduct transects around the observatory and between observatories. The AUV provides the highest mobility andflexibility in sampling design for mapping with impacts on the benthic habitat by maritime activities (e.g., noise, substrate disturbance at different scales, and artificial light pollution effects). Although the ROV design implies a tether, such a platform has also a high mobility and it can be used similarly to AUVs,32with the advantage of having two way real- time data transmission and manipulator arms to be used for management and maintenance tasks within the monitoring infrastructure (e.g., manipulative experiments or for placing autonomous recorders such as stand-alone autonomous cameras). In addition, ROVs are the best option for collecting video data on the development of the fouling community on the observatory infrastructure and fauna association with the structure. The major drawback of ROVs is that they must operate with thrusters, creating high levels of noise and their limited ability to conduct sampling and observations at specific locations for extended periods of time.33Crawlers, on the other hand, can be used to conduct census observations at specific locations (in constant transect or stepping-stone fashion) for extended time periods (minutes to hours). Crawlers can also share some infrastructure servicing tasks with the ROVs and carry larger payloads. Drawbacks to crawlers include noise production but, more importantly, physical disturbance of the benthic habitat and associated fauna along the movement tracks.
2.2. Benthic Networks Growing in the Pelagic Realm.
The need to monitor energyfluxes between pelagic and benthic ecosystem compartments (i.e., benthopelagic coupling) and their spatiotemporal changes (e.g.,34), requires the development of three-dimensional monitoring networks of platforms, with cabled nodes and mobile platforms operating in tandem (Figure 2). This ecologically integrated monitoring is presently being facilitated by incorporating to the benthic data collection, secondary data streams supplied byfixed (i.e., moored) water column and superficial buoys, as well as satellites.24Satellites are optimal tools for gathering large-scale physicochemical data from superficial (i.e., epipelagic) ecosystems, quantifying relevant biological variables from ocean color (e.g., chlorophyll content, particulate matter, and so on). Unfortunately, satellite sensors cannot penetrate much beyond the surface of a global water mass, and therefore pelagic buoys are more appropriate for the monitoring of subsurface oceanic strata.
In this scenario, benthopelagic monitoring capabilities are also being potentiated via data collection from the routine operations of large astrophysical experimental infrastructures, Table1.continued hierarchicalstepmonitoredbiologicalvariableorecosystem indicatorcabledplatformpublication benthiccommunitycompositionNEPTUNECabledObservatory (ONC;BarkleyCanyonslope;900−1000m;NEPacific)47 DELOSobservatories(1400m,SWAtlanticoffAngola)20 hydrothermalventfaunacommunity compositionNEPTUNECabledObservatory (ONC;Endeavor;2200m;NEPacific)126 benthiccommunitycompositionVENUSCabledObservatory (ONC;SaanichInlet;100m;NEPacific)136 benthiccommunitydynamics132 6.ecosystemfunctioning(food-webstructure,carbonflux,bioturbation/remineralization)seabedbioturbationbybenthicmegafaunaNEPTUNECabledObservatory (ONC;BarkleyCanyonshelf-break;400m;NEPacific)67 zooplanktoncarbonfluxesNEPTUNECabledObservatory (ONC;BarkleyCanyonslope;400−1000m;NEPacific)113 seasonalcarbonfluxesNEPTUNECabledObservatory (ONC;BarkleyCanyonhydrates;900m;NEPacific)24
Environmental Science & Technology
such as underwater neutrino telescopes (seeFigure 1C). These telescopes consist of arrays of vertically moored (up to 700 m), flexible strings or towers of photon detectors (photomultiplier tubes; PMTs) for neutrino particle quantification, placed at different altitudes above the seabed and connected to shore via power andfiber-optic data cables.35
Although the primary use of these platforms is within the high-energy astrophysics domain,36their infrastructure provides a network of subsea connection points and sensors usable for marine ecological monitoring. Hydrophones for passive acoustic listening are connected to the system to monitor the position of the towers in relation to currents and to simultaneously triangulate the PMT location with the aid of acoustic beacons, so that the trajectories of detected neutrinos can be properly computed. As a byproduct, this real-time acoustic monitoring produces useful oceanographic flow condition data and information on anthropogenic marine noise, as well as cetacean movement, population structure, and communication.37−39The PMT detectors themselves also provide unique high-frequency and continuous data on bioluminescence, as swimming animals luminesce when hitting the infrastructures.40 At the time of writing, real-time and continuous data acquisition from these telescope infrastructures as a whole is providing important information on seasonal changes in gravity carbonfluxes and controlling oceanographic processes (e.g., dense shelf water cascading and effects on deep-sea bacterial productivity.35,41,42
3. ROADMAP FOR THE MONITORING OF ECOSYSTEM INDICATORS
The development of efficient deep-sea ecosystem monitoring is currently based on the successful extraction and quantification of key ecosystem characteristics (e.g., biogeochemistry, animal presence, abundance and behavior, local and regional biodiversity, and ecosystem functioning; see Table 1). This monitoring development is being based on the combined use of optoacoustic and molecular biological sensors which are being implemented in the framework of cabled observatories. The capability to acquire a temporally related time series of multiparametric habitat and biological data allows researchers to envision aspects such as benthic primary production via chemosynthesis, deep-sea species ecological niches, and food web structure.43−45These data sets can be used to feed new numerical-based ecology approaches centered on multivariate statistics, time series analysis and ecosystem modeling (e.g., see refs24and46−48), in order to estimate the level of significance for putative cause−effect relationships (i.e., environmental control versus species and communities response) and provide an immediate vision of complex ecological processes at a local scale (e.g., species tolerance to the variation of key habitat drivers). This approach allows a transition from a still too descriptive deep-water and deep-sea ecology into a more quantitative one, as occurs in more directly accessible coastal areas and land.
To optimize the outcome quality from a highly integrated deep-sea monitoring strategy of this type, protocols for data collection and analysis should be implemented to efficiently Figure 1.Fixed (i.e., cabled) and mobile docked platforms constituting a spatial network for the integrated benthic and pelagic ecosystem monitoring.
(A) Video-cabled multiparametric observatory platform, acting as a docking station for a pelagic remotely operated vehicle (ROV) and a tethered mobile benthic crawler; (B) rover (MANSIO-VIATOR) similar to crawlers but not tethered, docked to a vessel-assisted repositioning station; (C) architecture of ANTARES (the Astronomy with a Neutrino Telescope and Abyss environmental RESearch detector) with a line of photomultiplier tubes (PMTs) and a tethered crawler.
characterize local biodiversity along with those processes that sustain it and determine the overall ecosystem functioning and health status.49,50From an operational point of view, a bottom- up scheme of monitoring should be conceived with cabled observatories and docked mobile platforms producing video and acoustic imaging information on fauna within a wide range of sizes (e.g., from macro-zooplankton to megafauna classification and counting, morphometric description, and quantification of intra- and interspecific interactions). Then, acquired baseline biological data can be directly related to multiparametric environmental information obtained via the concomitant collection of geochemical and oceanographic data.12,18,51
3.1. Central Role of Optoacoustic Technologies for Monitoring.High-definition still and video image data (e.g., 2D, 3D, and hyperspectral) and active acoustic imaging (i.e., multibeam cameras52) to date represent key approaches for the optoacoustic monitoring of remote deep-sea.8 Outputs of optoacoustic monitoring provide relevant data for management in key human activities, as for example fisheries or jellyfish blooms.53−56Moreover, species distribution and habitat use can be studied over extended spatial scales by mosaicking high- resolution imagery, captured by mobile platforms operating in the regions surrounding the cabled infrastructure stations25or by integrating laser-scanning systems into the mobile platforms, to create high-resolution 3D full-color surface models.57Further development of similar methods that expand the spatial coverage of (stereo)imaging data, can help with the quantification of other biological components and fauna sizes of high ecological relevance which are more difficult to quantify remotely over extensive areas of the deep sea. Fixed cameras11and mobile platforms58 can be used to assess epibenthic bacterial mat coverage in combination with customized molecular and
chemical microsensors, providing in situ analysis of microbial communities (see section 3.3), a proxy for chemosynthetic production at reducing sites (e.g., cold-seeps and hydrothermal vents25,59).
Video imaging at depth requires continuous illumination which carries a poorly understood potential for harmful effects on deep-sea fauna.60,61However, digital still time-lapse cameras may collect in situ images with triggered flash illumination, limiting the exposure to light of these perpetually dark deep-sea ecosystems. At the same time, red or infrared lighting, at wavelengths not detectable by deep-sea animals, has been used with some success62 but those wavelengths are rapidly attenuated in water and the resulting monochrome images contain much less information than equivalent color images.63
Classic high-definition video monitoring approaches are being integrated with novel acoustic imaging systems52,64 with an increasing level of complementarity in deep-water areas (Figure 3). Acoustic cameras, such as high-frequency multibeam imaging dual-frequency identification sonar (DIDSON) and adaptive resolution imaging sonar (ARIS) can visualizefish and invertebrate shapes and track the movement of individuals at distances greater than those which may be achieved by visual systems equipped with artificial lighting solutions.65
A limitation of acoustic camera use for monitoring fauna however is related to animal identification, which with acoustic systems must be solely based on morphology, since no colorimetric and limited texture information is captured by acoustic camera devices. Spatial resolution of acoustic cameras is also insufficient to resolve important details for species identification. However, acoustic cameras can effectively “see in the dark”, thus avoiding photic contamination, allowing investigation of how artificial lights may influence animal Figure 2.Illustration of a variety of cabled observatories providing the sea bed infrastructure to control and coordinate mobile benthic and pelagic platforms such as docked crawlers, rovers, and AUVs. Platform monitoring is assisted by vessels and satellite-based technologies. Neutrino telescope is an array of vertical moored lines of PMTs deployed in the deep sea. Seabed infrastructures providing power and data transfer may be aided by connection with industrial or telecommunication cables, as reliable low-cost means for network deployment into vast abyssal areas.8
Environmental Science & Technology
behavior in the deep sea. In order to verify identifications, acoustic cameras must be deployed simultaneously with new prototype low-light high-resolution optical imaging equipment (e.g.,66).
The space sampled around an observatory can be also increased by mounting an imaging sonar on a rotating head (see Figure 3B). At present such devices are installed on the ONC cabled observatory in Barkley canyon. These sonars allow Internet connected operators to qualitatively discern the presence and abundance of benthic fauna and any associated bioturbation over surfaces larger than in any singlefixed image.67 Similar rotating side or upward facing sonar packages are undergoing initial deployments on other cabled infrastructures,
capable of being used to identify animals, when they are not too densely grouped, at distances of up to∼1 km.68
Currently, automation in image processing for animal tracking, classification, counting, the extraction of morpho- logical features (e.g., size, shape, and color patterns), and characterization of behavioral aspects (e.g., crawling, walking, swimming, burying, and territoriality; sensu ref69) is becoming a relevant tool in biological data provision from cabled observatories and their associated mobile platforms. More automated routines are urgently required as the volume of image data collected by these systems increases in line with technological developments. Such routines will enable research- ers to overcome the human analysis-dependent bottleneck of Figure 3.Different video and acoustic imaging data outputs obtained byfixed-point and crawler platforms connected through the Ocean Networks Canada’s (ONC) observatory assets in the NE Pacific and Strait of Georgia, Canada. (A, B) Commercially exploited sablefish (Anoplopoma f imbria) imaged from HD video (A) and from an imaging rotary sonar (B), at 970 m depth in Barkley Canyon; (C) spiny dogfish (Squalus achantias) imaged with an ARIS dual frequency identification sonar at 120 m depth in the Strait of Georgia [color scale bar indicates raw backscatter reflectivity amplitude (in decibels, dB)]; (D, E) photomosaic by a crawler in Barkley Canyon (870 m), depicting gastropod’egg towers (D) and a range of benthic species occupying a methane seep habitat patch; (F, G) 3D photomosaics of a methane hydrate mound at the same location, depicting mound area/volume changes over time due to uplift/growth in hydrates (areas in yellow) and slumping (areas in red).
manual processing,12while also reducing observer bias.13 By developing artificial intelligence (AI; in the form of learning algorithms) in computer vision, cameras may be transformed into the equivalent of a calibrated sensor, automatically providing time series quantitative data on key fauna, to augment the qualitative data represented by the images themselves.55,56 Despite the difficulties inherent in converting the expert knowledge into useful algorithms, calibration and tuning via sufficiently extensive feedback can result in operational perform- ances comparable to those of expert researchers.70
3.2. Passive Acoustic Monitoring To Support Image- Based Monitoring.PAM monitoring offish and invertebrate sounds increase species monitoring capability well beyond the reach of optoacoustic technologies. Such a technological application has become an important tool in fisheries and conservation research.71,72The use of PAM assets provides a long-range monitoring capability in remote locations where traditional sampling methods are difficult or impossible to implement,73such as for example in the case of sponge reefs74or seamounts.75Furthermore, combining acoustic localization with video and other forms of observation can be used to identify sound producing species as well as document their soniferous behavior.76 This approach is finding an increasing use in the collection of long-term data for integrated biodiversity assess- ment.77
Unfortunately, the application of PAM is limited by the paucity of archived data onfish sounds.78,79For example, of the approximately 400fish species in British Columbia waters, only 22 have been reported to“vocalize”in large part because sound production has been investigated in so few species.80This is especially true in the deep sea, wherefish sounds have rarely been studied despite the fact that many species possess sonic muscles presumably used in vocalization.81,82
Although many fishes and invertebrates do not produce purposeful sounds, it is important to understand that incidental sound production may occur upon physiological and behavioral activity (e.g., specific swimming and feeding mode sounds).
Those acoustic marks can be used to assess the presence of individuals for a certain species and are therefore being incorporated into PAM monitoring procedures.71,83
The aforementioned PAM applications, combined with other observation technologies (e.g., video, acoustic imaging, and sonar) improving the documentation of organism sound production and associated behavior, will add further ecological value to the integrated monitoring framework of ocean observatories.64
3.3. Molecular Sensing as Benchmark for Species Traceability. Molecular tools have diverse applications in marine ecological studies and biological monitoring. Substantial contributions have been provided by several DNA barcode initiatives generating and implementing databases, along with the development of metabarcoding protocols to recover community diversities from unsorted samples.84 The latest revolution in biomonitoring is linked to the collection and analysis of genetic material obtained directly from environ- mental samples, namely, environmental DNA (eDNA). This protocol enables tracing of the presence of species from skin cells,fish scales, gametes, and food leftovers, without the need to isolate any target organisms.85Direct sequencing of eDNA has been shown to provide several advantages over traditional techniques, improving the capacity to unravel the “hidden” biodiversity (e.g., detect rare, cryptic, elusive, and non-
indigenous species in the early stages of invasion) and enabling global census of species in near real time.86
However, eDNA tracing presents some limitations such as, for example, the detection of false positives (when a target species is absent but its DNA is recovered) and false negatives (i.e., species undetected where they are present) which have to be carefully evaluated and avoided.85,87 Major difficulties encountered in deep-sea ecosystems for studies involving molecular analysis of diversity are the general lack of taxonomic knowledge as well as the absence of appropriate databases of species-specific marker sequences.88−90When these molecular markers are identified,91 in situ hybridization techniques may be used with great success when targeting expected taxa within monitoring pro- grammes.92,93
Recent technical improvements concern the development of
“eco-genomic” sensors capable of autonomously collect bio- logical samples and perform molecular analyses.94These sensors allow the characterization of marine community composition as a whole, regardless of the faunal size classes involved.95 One example is the environmental sample processor (ESP96), designed to autonomously collect discrete water samples, concentrate microorganisms, and automate the application of molecular probe technologies.
In parallel, recent advances in high-throughput sequencing technologies are allowing the processing of huge amounts of genomic data using small portable devices (i.e., miniaturized sequencers such as that produced by Oxford Nanopore Technologies having the size of a USB stick). These kinds of devices, together with advances in bioinformatics, could represent the most important revolutionary breakthrough technology in ecological networks monitoring. Challenges related to the taxonomic assignments of genomic sequences and their interpretation (incompleteness of databases) may be solved by applying machine learning algorithms.97 Such approaches can maximize ecologically meaningful insights and provide a list of highly informative sequences ecosystem indicators that could provide the basis for hybridization chips (i.e., microarrays) for denser, more mobile, and cheaper in situ devices that can be scaled up appropriate spatiotemporal resolutions.98
AI approaches are gaining relevance in the metabarcoding analysis and provide a fast and cost-effective way for assessing the quality status of ecosystems.98,99Recent examples in omics analysis were based on random forest100,101and self organizing maps.102These were used for identifying biotic indices for the foraminiferal metabarcoding. Similarly, ref103 used a random forest based approach for selecting the relevant biomarkers for classification of ocean, harbor, and ballast water samples.104used a deep recurrent neural network (approach for a base calling application on portable sequencing machines,105where mean- ingful results were sent to a cloud service through an Internet of Things framework for further analysis.106
Along with molecular-based monitoring tools, other chemical sensing applications may complement DNA probing107 and sequencing. An example is provided by in situ mass spectrometry, originally developed for targeting xenobiotic compounds in marine water microsamples, which has been successfully used for identifying species’presence based on their physiological byproducts.108
3.4. Ecosystem Indicators. In the near future, the integration of advanced genomic and chemical approaches for in situ detection of organisms97 and quantification of their biochemical activity109will greatly enhance the performance of Environmental Science & Technology
ecological monitoring networks, adding to the detection capacity of optoacoustic imaging and passive acoustic approaches alone.
Stitched imaging products (e.g., mosaicking) can provide valuable information on species distribution and habitat use at more extended scales. In situ molecular methods can detect the presence of taxa otherwise undetected by imaging outside a small temporal window or too small for morphological recognition, while acoustics expand the spatial scales of deep- sea biological monitoring, enabling the integration of horizontal (nektobenthic displacement69) and vertical (i.e., benthopelagic coupling34) biomass and energy fluxes. With the use of such combined data sets, a series of biological variables can be measured and ecosystem indicators extracted, as essential elements for the accurate assessment of the health of benthic ecosystems and cover the complete range from benthic (e.g., chemosynthetic) primary production, individual characteristics, population dynamics, and species and community dynamics to finally the ecosystem functioning level.
As a result of these ever-growing demands, the need for automation in data collection, analysis, and interpretation procedures is paramount. Integration of cabled observatories and associated mobile systems equipped with AI for real-time content extraction from imaging systems, hydrophones, and e- DNA samplers, would allow the monitoring of ecosystem indicators and representation of ecosystem functioning over extended spatiotemporal scales (from square meters to kilo- meters, over days, months, seasons, and decades). To date, no such integrated system exists in the deep sea to verify the concept.8At present there are major shortfalls in automation of image and sound processing and producing an efficient, long- term in situ e-DNA extraction and sequencing device. However, many of these systems are integrated into the ONC cabled observatory infrastructure in the NE Pacific, with data being collected in real time at a number of nodes and returned to a central repository (i.e., Ocean 2.0 data bank system). Similarly, real-time, interactive tools such as the Scripps Plankton Camera System (http://spc.ucsd.edu/) facilitate quick access to visual data and a statistical overview. The implementation of these types of data repositories can allow environmental comparisons to be made among neighboring and more distantly arrayed platforms in an attempt to scale local results over a larger networked area (Figure 4). This endeavor is providing the guidelines for future development of spatiotemporally inte- grated monitoring protocols.
Autonomous monitoring of biological variables and derived ecosystem indicators by cabled observatories and their integrated mobile platforms should be implemented following a general and standardized common operational protocol: (i) all multiparametric readings from optoacoustic imaging, PAM, molecular, biogeochemical, and oceanographic sensors should be acquired synchronously by all cabled and mobile platforms;
(ii) such data acquisition should occur in a high-frequency and time-lapse mode, where the image content should be automati- cally analyzed by AI algorithms and classified on board of the device (saving storage PAM and transmission bandwidth space), while preserving the observation time georeferenced stamp; and finally; (iii) all mobile platforms should constantly survey the same benthic and pelagic areas (subdivided into specific stations) among cabled observatories and their moored vertical projections. Such an automated and spatiotemporally coordi- nated and standardized protocol for data acquisition will make data treatment, transmission, and storage easier, while
simultaneously facilitating more straightforward repeatability/
reproducibility of observations at the same location and comparison of measurements made with other networks, allowing regional/global level analysis.
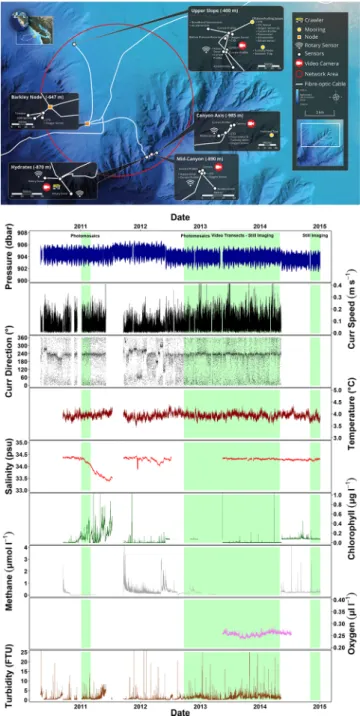
Figure 4. Schematic representation of current seafloor monitoring infrastructure ONC in Barkley Canyon, where a power node distributes energy and data transmission capability to servefixed multiparametric imaging platforms and a crawler. The mobile platforms communication and coordinated function makes this area thefirst cooperative network (shown in the red circle) for the deep-sea ecological monitoring. As an example of the power of ongoing multiparametric monitoring, time series from several environmental sensors for the crawler are presented over consecutive years (data plotted at 1 h frequency). When gaps in data acquisition occur, data can be supplied by nearby cabled platform (as interpolated to cover maintenance periods). Shaded green areas indicate moments at which the environmental monitoring by the crawler has been accompanied by image collection, the processing of which is still manual, while automated scripts for animal tracking and species classification are under development.
The measurement of biological variables needed for the hierarchical computation of ecosystem indicators, should be carried out through a series of sequential automated steps (Table 2): (i) all imaging outputs initially processed for the classification, counting, and tracking of fauna and quantification of bacterial mat coverage and activity; (ii) animals measured (e.g., by stereovision, acoustic scaling, or laser scanning) to obtain class-size frequency distribution and sex ratio (when morphology allows individual discrimination); (iii) total species counts from all seabed and water-column areas summed and standardized for the imaged volume, to obtain an overall abundance (i.e., density) and biomass estimation; (iv) species counts computed for each station analyzed by mapping procedures (e.g., percentage of presence/occupation per quadrant), to derive information on habitat use as well as displacement routes through different zones (i.e., corridors); (v) a species richness list and biodiversity obtained at each platform (αdiversity), between platforms (βdiversity), and the level of the whole network (γdiversity), to assess habitat heterogeneity influences on species distribution, community composition, and
overall ecosystem boundaries;finally, (vi) density and biomass for each species related to carbon inputs from benthopelagic fluxes in chlorophyll-aand turbidity (as proxy for transported organic and inorganic matter), as well as from geochemical fluxes, when relevant (i.e., carrying the reduced chemicals, for example methane, hydrogen, and sulfide, that fuel chemo- synthetic microbes), to calculate ecosystem functioning and productivity performances. All automated analysis stages need to be verified by human researchers to ensure accuracy of the algorithm functioning, while the nature of specified ecological interpretation must be cross-checked against published results from conventional methods such as analysis of stomach contents, stable isotopes, and fatty acids.110
4. PERSPECTIVES AND OUTLOOK
Autonomous flexible networks of cabled observatories and mobile platforms can allow extensive monitoring of marine life at different levels of biological organization and at unprecedented spatial and temporal resolution. Although integrated monitoring actions such as those outlined herein are yet to attain full Table 2. Indicators Extraction Roadmap: Consecutive Automatable Steps for the Hierarchical Computing of Ecosystem Indicators from Input Biological Variables, Obtained by Bio-imaging and Other Sensing Technologies, Installed on Spatially Distributed Autonomous Networks of Cabled Observatories and Their Connected Mobile Benthic and Pelagic Platforms Environmental Science & Technology
operational readiness, and therefore proofs of some of the concepts discussed are missing, the technological developments are ongoing. Progress to date already allows researchers to utilize services-oriented ecological monitoring of some isolated deep- sea ecosystems. It is important, however, that future observatories are designed from the ground up for ecosystem monitoring and data integration, rather than being developed on an ad hoc, and somewhat haphazard, basis, as funding for individual projects becomes available.
Bioimaging technologies already play a central role in ecosystem exploration and monitoring. Increasing levels of automation in image processing are transforming cameras into true sensors, delivering time series data for a number of biological variables and derived ecosystem indicators. Visual data are being increasingly complemented by in situ passive acoustic listening sensors and new e-DNA sequencing technologies for species traceability. All these initially disparate data sources can be combined to form a detailed and high- resolution monitoring approach applicable to the benthic and pelagic components of a deep-sea ecosystem. The output from such a monitoring regime will support decisions of policy makers, allowing them to assess the impacts of increased industrial activities and pressures on deep-sea ecosystems (e.g., oil or gas extraction and mining or trawlfishing), including a better assessment of already evident but poorly quantified climate change impacts at great depths. The obtained data will be of paramount importance for the accurate assessment of the health status of ecosystems and the physical damage to habitats and for efficient monitoring of their resilience and the efficacy of restoration actions. The compiling of multiannual time series monitoring data sets (continuously updated in real time) will allow the identification of shifting environmental baselines and rapidly highlight the onset of any negative environmental impacts which may develop, potentially unpredictably, from human activities in these remote deep-sea ecosystems.
■
AUTHOR INFORMATION Corresponding Author*Phone: +34 93 230 95 00; fax: +34 93 230 95 55; e-mail:
jaguzzi@icm.csic.es.
ORCID
Jacopo Aguzzi:0000-0002-1484-8219 Notes
The authors declare no competingfinancial interest.
■
ACKNOWLEDGMENTSThis work was developed within the framework of the Tecnoterra (ICM-CSIC/UPC) and the following project activities: ARIM (Autonomous Robotic sea-floor Infrastructure for benthopelagic Monitoring; MartTERA ERA-Net Cofound), ARCHES (Autonomous Robotic Networks to Help Modern Societies; German Helmholtz Association), RESBIO (Grant TEC2017-87861-R; Ministerio de Ciencia, Innovación y Universidades), RESNEP (Grant CTM2017-82991-C2-1-R;
Ministerio de Ciencia, Innovación y Universidades), MERCES (Marine Ecosystem Restoration in Changing European Seas GA No. 689518), and IDEM (Implementing the MSFD to the Deep Mediterranean Sea, GA No. 11.0661/2017/750680/
SUB/ENV.C2). L.T. acknowledges fruitful discussions with Dr.
T. Kwasnitschka with respect to Figure 3F,G.
■
(1) Crutzen, P. J.; Steffen, W. How long have we been in theREFERENCES Anthropocene Era?Clim. Change2003,61, 251−257.(2) Halpern, B. S.; Longo, C.; Lowndes, J. S. S.; Best, B. D.; Frazier, M.; Katona, S. K.; Kleisner, K. M.; Rosenberg, A. A.; Scarborough, C.;
Selig, E. R. Patterns and emerging trends in global ocean health.PLoS One2015,10(3), e0117863.
(3) Levin, L.; Le Bris, N. The deep ocean under climate change.Science 2015,350, 766−768.
(4) Ramírez-Llodra, E.; Brandt, A.; Danovaro, R.; De Mol, B.; Escobar, E.; German, C. R.; Levin, L. A.; Martinez Arbizu, P.; Menot, L.; Buhl- Mortensen, P.; Narayanaswamy, B. E.; Smith, C. R.; Tittensor, D. P.;
Tyler, P. A.; Vanreusel, A.; Vecchione, M. Deep, diverse and definitely different: Unique attributes of the world’s largest ecosystem.
Biogeosciences2010,7, 2851−2899.
(5) Mora, C.; Tittensor, D. P.; Adl, S.; Simpson, A. G. B.; Worm, B.
How many species are there on Earth and in the ocean?PLoS Biol.
2011,9, e1001127−8.
(6) Sutton, T.; Clark, M.; Dunn, D. C.; Halpin, P. N.; Rogers, A. D.;
Guinotte, J.; Bograd, S. J.; Angel, M. V.; Perez, J. A.; Wishner, K.;
Haedrich, R. L.; Lindsay, D. J.; Drazen, J. C.; Vereshchaka, A.;
Piatkowski, U.; Morato, T.; Błachowiak-Samołyk, K.; Robison, B. H.;
Gjerde, K. M.; Pierrot-Bults, A.; Bernal, P.; Reygondeau, G. l.; Heino, M. A global biogeographic classification of the mesopelagic zone.Deep Sea Res., Part I2017,126, 85−102.
(7) Woodall, L. C.; Andradi-Brown, D. A.; Brierley, A. S.; Clark, M. R.;
Connelly, D.; Hall, R. A.; Howell, K. L.; Huvenne, V. A. I.; Linse, K.;
Ross, R. E.; Snelgrove, P.; Stefanoudis, P. V.; Sutton, T. T.; Taylor, M.;
Thornton, T. F.; Rogers, A. D. A multidisciplinary approach for generating globally consistent data on mesophotic, deep-pelagic, and bathyal biological communities.Oceanography2018,31(3), 76−81.
(8) Danovaro, R.; Aguzzi, J.; Fanelli, E.; Billett, D.; Gjerde, K.;
Jamieson, A.; Ramirez-Llodra, E.; Smith, C. R.; Snelgrove, P. V. R.;
Thomsen, L.; Van Dover, C. L. An ecosystem-based deep-ocean strategy.Science2017,355, 452−454.
(9) Danovaro, R.; Snelgrove, P. V.; Tyler, P. Challenging the paradigms of deep-sea ecology.Trends in Ecology and Evolution2014, 29, 465−475.
(10) Snelgrove, P V. R.; Soetaert, K.; Solan, M.; Thrush, S.; Wei, C.- H.; Danovaro, R.; Fulweiler, R. W.; Kitazato, H.; Ingole, B.; Norkko, A.;
Parkes, J. R.; Volkenborn, N. Global carbon cycling on a heterogeneous seafloor.Trends in Ecology and Evolution2018,33, 96−105.
(11) Zhao, S.; Ward, J. E.; Danley, M.; Mincer, T. J. Field-based evidence for microplastic in marine aggregates and mussels:
Implications for trophic transfer. Environ. Sci. Technol. 2018, 52, 11038−11048.
(12) Aguzzi, J.; Company, J. B.; Costa, C.; Matabos, M.; Azzurro, E.;
Mànuel, A.; Menesatti, P.; Sardà, F.; Canals, M.; Delory, E.; Cline, D.;
Favali, P.; Juniper, S. K.; Furushima, Y.; Fujiwara, Y.; Chiesa, J. J.;
Marotta, L.; Priede, I. M. Challenges to assessment of benthic populations and biodiversity as a result of rhythmic behaviour: Video solutions from cabled observatories.Oceanography and Marine Biology:
An Annual Review; CRC Press: Boca Raton, FL, USA, 2012; Vol.50, pp 235−286, DOI: 10.1201/b12157.
(13) Schoening, T.; Bergmann, M.; Ontrup, J.; Taylor, J.; Dannheim, J.; Gutt, J.; Purser, A.; Nattkemper, T. W. Semi-automated image analysis for the assessment of megafaunal densities at the Arctic Deep- sea observatory Hausgarten.PLoS One2012,7, e38179.
(14) Favali, P.; Person, R.; Barnes, C. R.; Kaneda, Y.; Delaney, J. R.;
Hsu, S.-K. (2010) Seafloor Observatory Science. Proceedings of the OceanObs’09: Sustained Ocean Observations and Information for Society, Vol.2, ESA Publication WPP-306, Venice, Italy, Sep. 21−25, 2009;
Hall, J., Harrison, D. E., Stammer, D., Eds.; DOI: 10.5270/
OceanObs09.cwp.28.
(15) Favali, P.; Beranzoli, L.; De Santis, A.Seafloor Observatories: A new vision of the earth from the abyss; Springer Science & Business Media: Berlin, Heidelberg, Germany2015.
(16) Lelièvre, Y.; Legendre, P.; Matabos, M.; Mihaly, S.; Lee, R. W.;
Sarradin, P. M.; Arango, C. P.; Sarrazin, J. Astronomical and