Research Collection
Journal Article
The Mg isotope signature of marine Mg-evaporites
Author(s):
Shalev, Netta; Lazar, Boaz; Halicz, Ludwik; Gavrieli, Ittai Publication Date:
2021-05-15 Permanent Link:
https://doi.org/10.3929/ethz-b-000473596
Originally published in:
Geochimica et Cosmochimica Acta 301, http://doi.org/10.1016/j.gca.2021.02.032
Rights / License:
Creative Commons Attribution 4.0 International
This page was generated automatically upon download from the ETH Zurich Research Collection. For more information please consult the Terms of use.
ETH Library
The Mg isotope signature of marine Mg-evaporites
Netta Shalev
a,b,c,⇑, Boaz Lazar
a, Ludwik Halicz
b,d, Ittai Gavrieli
baInstitute of Earth Science, The Hebrew University of Jerusalem, Edmond J. Safra Campus, 91904 Jerusalem, Israel
bGeological Survey of Israel, 32 Y. Leibowitz St., 9692100 Jerusalem, Israel
cInstitute of Geochemistry and Petrology, Department of Earth Sciences, ETH Zu¨rich, Clausiusstrasse 25, 8092 Zu¨rich, Switzerland
dFaculty of Chemistry, Biological and Chemical Research Centre, University of Warsaw,Zwirki i Wigury 101, 02-089 Warsaw, Poland_ Received 18 March 2020; accepted in revised form 19 February 2021; Available online 27 February 2021
Abstract
Marine Mg-evaporites are a small oceanic sink of magnesium, precipitating only from extremely evaporated brines. The isotopic composition of Mg in seawater,d26Mgseawater, has recently been shown to be an effective tool for reconstructing the Mg budget of the modern and past oceans. However, estimations of the Mg isotope fractionation between the Mg-evaporites and their precipitating solution are required for full quantification of the isotope effect of the evaporitic sink ond26Mgseawater, as well as for utilizing ancient evaporitic sequences as an archive for pastd26Mgseawater. Here, we estimate the Mg isotope fractionation between Mg-evaporites and modern marine-derived brine along the course of seawater evaporation, up to degree evaporation of >200. The sequence of Mg-salts included epsomite (MgSO47H2O), kainite (KMgClSO43H2O), carnal- lite (KMgCl36H2O), kieserite (MgSO4H2O) and bischofite (MgCl26H2O).
The following isotope fractionation values, either negative or positive, were calculated from the isotope difference between the salt and its precipitating brine, and from the evolution of d26Mg in the brine throughout the evaporation:
Dcarnallite-brine = +1.1‰, Depsomite-brine = +0.59‰, Dbischofite-brine = +0.33‰, Dkieserite-brine=0.2‰ and Dkainite- brine=1.3‰. Magnesium isotopic compositions determined on minerals from different ages in the geological record corrob- orate well these results. Due to precipitation of multi-mineral assemblages having isotope fractionation values of opposing signs, thed26Mg value of the brine changes only slightly (<0.5‰) throughout the evaporation path, despite the considerable Mg removal (>50%). The isotope fractionations are shown to correlate with the number of water molecules coordinated to the Mg2+and with Mg-O bond length in the mineral lattice.
Given these isotope fractionations, it is calculated that a volume of 0.4106–0.8106Km3of a mono-mineral assemblage of kainite or carnallite needs to precipitate in order to change seawaterd26Mg by only 0.1‰. This huge volume is by far larger than the volume of these minerals known to date in the global geological record. Therefore, it is concluded that the impact of Mg-evaporites formation ond26Mgseawaterhas been insignificant since the Proterozoic. The results of this study suggest that the Mg isotopic composition of Mg-evaporites preserved in the geological record of evaporitic basins may be used to: 1) quan- tify geochemical processes that fractionate Mg-isotopes within these basins, such as dolomitization; and 2) complete the sec- ular variations curve of the marined26Mg record using basins with well-established evaporitic sequences.
Ó2021 The Authors. Published by Elsevier Ltd. This is an open access article under the CC BY license (http://creativecommons.org/
licenses/by/4.0/).
Keywords:Magnesium isotopes; Magnesium salts; Marine evaporites; Seawater evaporation; Isotope fractionation; d26Mg; Chemical evolution of seawater
https://doi.org/10.1016/j.gca.2021.02.032
0016-7037/Ó2021 The Authors. Published by Elsevier Ltd.
This is an open access article under the CC BY license (http://creativecommons.org/licenses/by/4.0/).
Abbreviation: DE, Degree of evaporation
⇑Corresponding author at: Institute of Geochemistry and Petrology, Department of Earth Sciences, ETH Zu¨rich, Clausiusstrasse 25, 8092 Zu¨rich, Switzerland.
E-mail address:netta.shalev@erdw.ethz.ch(N. Shalev).
www.elsevier.com/locate/gca Available online at www.sciencedirect.com
ScienceDirect
Geochimica et Cosmochimica Acta 301 (2021) 30–47
1. INTRODUCTION
Magnesium is the third most abundant cation in the ocean and, due to its long residence time (13 Myr;
Berner and Berner, 1996) relative to the mixing time of the oceans, it is well-mixed. The concentration and isotopic composition of Mg in seawater are determined by the ocea- nic Mg budget, which is controlled by Mg supply from riv- ers, and Mg removal, mainly by precipitation of carbonate minerals and hydrothermal reactions with the volcanic oceanic crust and, to a lesser extent, by reverse weathering and precipitation of Mg-evaporites (e.g., Elderfield and Schultz, 1996; Holland, 2005; Arvidson et al., 2006). Thus, understanding and quantifying the Mg budget of the mod- ern and ancient oceans are important to our understanding of how fundamental Earth processes, such as weathering, volcanism and sedimentation, have changed globally throughout the geological past, and how these processes are linked to Earth’s carbon cycle and long-term climate change (e.g.,Holland, 2005; Elderfield, 2010). The isotopic composition of dissolved Mg in seawater,d26Mgseawater, has recently been shown to be a reliable proxy for the recon- structions of the Mg budget of the modern and past oceans (e.g., Tipper et al., 2006; Pogge Von Strandmann et al., 2014; Higgins and Schrag, 2015; Li et al., 2015;
Gothmann et al., 2017; Shalev et al., 2019; Xia et al., 2020). However, a full understanding of the isotopic com- positions of the oceanic Mg inputs and outputs and reliable record ofd26Mgseawater in the past are needed in order to reconstruct the oceanic Mg-isotope budget. The scarcity of Mg isotope data from Mg-evaporites has thus far pre- vented estimations of their potential effect, as a Mg-sink, on thed26Mgseawatervalue, as well as their use as an archive for pastd26Mgseawater.
Magnesium-evaporites precipitate from extremely evap- orated seawater, conditions that are typically reached only in fully or nearly enclosed basins. Such evaporites are found in large volumes in giant evaporitic basins (e.g., the Per- mian Zechstein basins in northern Europe or the Messinian basins around the Mediterranean; e.g., Warren, 2010), inferring that the evaporitic output flux of Mg from the ocean was not constant through time, and was higher in periods during which these giant evaporitic basins existed (e.g.,Arvidson et al., 2006). Magnesium-potassium evapor- ite minerals in the geological record are important archives for ancient brines and can be used to estimate past seawater compositions and climate (e.g., Holland et al., 1986;
Hardie, 1991; Horita et al., 2002; Warren, 2010). As chem- ical deposits, these evaporites are direct recorders of the chemistry of ancient marine-derived brines (e.g., Babel and Schreiber, 2014), whereby variations in ocean chem- istry are reflected in changes in the depositional records and sequences of Mg-K salt deposits. These vary between the chloride type, composed mainly of sylvite and carnallite (Table 1), and the sulfate type, characterized by MgSO4- rich minerals (e.g.,Zharkov, 1981; Hardie, 1991;
Lowenstein et al., 2001; Babel and Schreiber, 2014). The sequence of marine Mg-evaporite minerals that precipitate along the course of evaporation depends not only on the chemical composition of the parent seawater, but also on
the degree of enclosure of the basin, the precipitating brine’s temperature, whether or not continuous reaction with the already precipitated salts is maintained, and if additional reactions within the evaporitic basin take place (e.g., Eugster et al., 1980; Harvie et al., 1980; McCaffrey et al., 1987; Shalev et al., 2018b). For example, when the precipitating salts are continuously separated from the brine (i.e., fractional precipitation) during the course of modern seawater evaporation at 25°C, the precipitating minerals include epsomite, kainite, carnallite, kieserite and bischofite (e.g., Eugster et al., 1980; Shalev et al., 2018b;
Table 1). But, when the evolving solution is allowed to react with previously precipitated salts over the course of the evaporation, the precipitating minerals include polyhalite, epsomite, hexahydrite, carnallite, kieserite and bischofite (e.g.,Eugster et al., 1980;Table 1).
To enable both the isotope characterization of the evap- oritic Mg sink and the use of ancient Mg-evaporites as archives of past d26Mgseawater, it is required to determine the Mg isotope fractionation between the Mg-evaporites and their precipitating solution.Li et al. (2011)experimen- tally determined that epsomite (Table 1) is ca. +0.6‰
‘heavier’ than its precipitating artificial Mg-SO4 solution.
However, as detailed above, epsomite is only one mineral out of the five Mg-minerals that precipitate along the course of evaporation of modern seawater (fractional path;
e.g.,Eugster et al., 1980; Shalev et al., 2018b). Using quan- tum chemical density functional theory, Feng et al. (2018) calculated the equilibrium isotope fractionation between langbeinite, K2Mg2(SO4)3, and its precipitating solution, to be +0.4‰at 25°C. Based on this value and thed26Mg of three Permian langbeinite samples (-3.9‰) they sug- gested that the d26Mg value of the Permian parent brine was extremely 26Mg-depleted, ca. 4‰. However, the mechanism of Mg isotope fractionation during mineral pre- cipitation is still enigmatic. For example, the theoretical cal- culations of Mg isotope fractionation during precipitation of carbonate minerals (Rustad et al., 2010; Schauble, 2011) do not fit each other nor experimental data (e.g., Pearce et al., 2012; Li et al., 2015) and many studies suggest that kinetic effects play an important role in determining the d26Mg value of the precipitating mineral (e.g., Immenhauser et al., 2010; Pearce et al., 2012; Mavromatis et al., 2013; Oelkers et al., 2018). Furthermore, some authors suggest that additional factors, such as aqueous Table 1
The chemical formulas of some Mg-salts minerals.
Mineral Symbol Chemical composition
Bischofite Bi MgCl2∙6H2O
Bloedite Bl Na2Mg(SO4)2∙4H2O
Carnallite Car KMgCl3∙6H2O
Epsomite Ep MgSO4∙7H2O
Hexahydrite Hx MgSO4∙6H2O
Kainite Kai KMgClSO4∙3H2O
Kieserite Ki MgSO4∙H2O
Leonite Le K2Mg(SO4)2∙4H20
Polyhalite Poly K2Ca2Mg(SO4)42H2O
Sylvite Syl KCl
N. Shalev et al. / Geochimica et Cosmochimica Acta 301 (2021) 30–47 31
speciation, amorphous precursor phases and organic ligands, may play a role in determining the Mg isotope frac- tionation during precipitation of different minerals from aqueous solutions (Schott et al., 2016; Mavromatis et al., 2017a, 2017b). Due to the lack of clear mechanistic under- standing, natural and/or experimental observations are needed as feedback to the theoretical calculations.
In this study, we determined the Mg isotope fractiona- tion (Dmineral-brine) during precipitation of five of the abun- dant marine Mg-evaporite minerals: epsomite, kainite, carnallite, kieserite and bischofite (Table 1). For that, we evaporated modern seawater to extremely high degrees of evaporation (>200; for details see Shalev et al., 2018b) and determined the Mg isotopic composition, d26Mg, of salt – brine pairs. The results were also compared with thed26Mg values of several Mg-evaporite mineral samples from the geological record. We then discuss the possible effect of crystal H2O and Mg-O bond length on the direc- tion and magnitude of isotope fractionation. Finally, using these findings we: (1) estimate the effect of the evaporitic Mg sink on thed26Mg value of the global ocean; and (2) draw conclusions about possible future use of Mg- evaporites as an archive ford26Mg value of ancient brines and of past seawater.
2. METHODS 2.1. Evaporation experiments
Three evaporation experiments, labeled ATL, G and W, in which seawater was evaporated to extremely high degree of evaporation (DE) of >200 were conducted in the labora- tories of the Geological Survey of Israel (GSI). Degree of evaporation, DE, is defined as the ratio of the mass of H2O in a given mass of ‘‘mean”modern seawater (salinity of 35 gr_skg1) divided by the mass of H2O in the brine remaining from the original mass of seawater after evapora- tion. To simulate natural conditions, we used evaporated Mediterranean seawater collected from the evaporation pans of the Israel Salt Company (ISC). This initial brine contained noticeable organic matter. Buckets of ca. 20 liters each, were placed in a fume hood under a heating lamp, to simulate natural conditions of dry and warm weather. The temperature of the brine, as measured during salt sampling, was not constant, but remained mostly in the range of 30–40°C in experiment ATL and 20–30°C in experiments G and W (see Table 2, for selected samples; Tables SI-1 and SI-2, for the full data; andShalev et al., 2018b). After 46 days, experiment W was stopped, the organic matter pre- sent in the brine was oxidized by H2O2and UV irradiation, and the evaporation was then allowed to continue (experi- ment Oxidized-W). This oxidation of the organic matter accelerated the evaporation rate and increased the maxi- mum attainable DE, but it does not have any further effect on the chemistry of the brine (Shalev et al., 2018b).
The evaporating brines and precipitating salts were sam- pled periodically (Table SI-1). First, a sample of ca. 30 ml brine was collected. Then, the remaining brine was separated from the salts and pumped into a different pre-cleaned container, and a sample of the salt was
collected. The bucket with the remaining salt was then thor- oughly washed with DI water, and the brine was returned to the bucket and allowed to continue to evaporate, thereby simulating a ‘fractional’ evaporation path. Following sam- pling, each brine sample was centrifuged and an aliquot of the centrifuged brine was weighed and diluted in a known weight of double-distilled water (DDW). Three types of salts were sampled (Table SI-2): (1) suspended salt, which was separated from the brine sample by the centrifugation (experiment ATL); (2) salts that were accumulated on the bottom of the bucket (indicated hereafter by ‘‘bc”(experi- ments G and W); and (3) a single salt crystal, in cases that the salt crystals were large enough. Each salt sample was immediately weighed and dissolved in a known weight of DDW. All salt samples (suspended, accumulated or crys- tals) contained also varying quantities of adsorbed brine and are therefore termed hereafter as ‘‘wet-salts”. All sam- ples were analyzed for Na, K, Ca, Mg, SO4, Sr, Cl, Br and Li concentrations (see methods in theSupplemental Infor- mation), and selected pairs of contemporaneous brine and salt were analyzed for their Mg isotopic composition (Tables 2 and 3). The present paper presents and discusses the results of these latter analyses. SeeShalev et al. (2018b) for a detailed discussion of the methods and their verifica- tion, and of the chemical evolution of the brine and the mineralogy of the precipitating salts.
Previous empirical studies suggested that, while all other elements (such as Mg, Br, K, Na, and Rb) co-precipitate or precipitate as separate minerals during Mg-evaporite pre- cipitation and are partly removed from the brine, Li is the most conservative element at such extreme evaporation (e.g., McCaffrey et al., 1987; Warren, 2010; Babel and Schreiber, 2014; Zilberman et al., 2017). Thus, it is the most suitable element for determining the degree of evaporation, DE. Here, DE was calculated using the molal concentration (mol∙kgH2O1
) ratios of Li,mLi:
DELi¼ ðmLiÞsample
ðmLiÞseawater ð1Þ
where the subscript seawater denotes ‘‘mean”modern sea- water (salinity of 35 gr_skg1seawater) and Li concentration of 0.0268 mmol∙kgH2O1 ;McCaffrey et al., 1987). Errors on DE were propagated for each sample and are given in Tables 2 and 3 and in the supplemental Tables SI-1 and SI-2. The potential error associated with the assumption that no Li is incorporated in the solid phase was not included in the errors given in Tables 2 and 3. However, as shown and discussed inShalev et al. (2018b), the good agreement of the DELi-based chemical evolution of brine and the DELiof the onset and end of precipitation of each Mg-mineral in our evaporation experiment with: 1) the sea- water evaporation experiment reported byMcCaffrey et al.
(1987); 2) the DE calculated using Mg concentrations for the lower DE, before the onset of Mg-salts precipitation;
and 3) thermodynamic simulation of the experiment, in which the DE is based directly on mass ratio of H2O in the original seawater and in the remaining brine, indicate that this error is insignificant (Shalev et al., 2018b).
The adsorbed brine present in the ‘‘wet-salt” samples could not be physically separated from the salts without 32 N. Shalev et al. / Geochimica et Cosmochimica Acta 301 (2021) 30–47
Table 2
Chemical composition of the studied brine and salt samples from the evaporation experiments (afterShalev et al., 2018b). Exp.: experiment, n.d.: not determined, S: suspended salt, bc: salt from bottom and crust, Crys: a single large salt crystal sampled with tweezers, Hal: halite, MgSO4: Mg-sulfate, Kai: kainite, Car: carnallite, Bis: Bischofite.
Brine composition Salt Li-corrected compositionc Estimated salt mineralogy
Exp. Brine
sample Exp.
days Brine temp.
Densitya Na K Ca Mg SO4 Cl Li DE(Li) DE(Li) err.
Salt sample
Type Li(wet) fsaltMg b err. Mg Na K SO4 Cl Hal MgSO4 Kai Car Bis
°C g_sml1 mmol∙(kgH
2O)1 lmol∙g(wet-salt)1 Mol% Mol% mmol∙g(wet-salt)1 Mol% per total salts
ATL ATL-B-5 38 34 1.2823 2090 489 6 2440 783 5930 1.54 58 4
ATL-B-6 49 37 1.3135 689 761 n.d. 3770 786 7290 2.57 96 7 ATL-S-6 S 0.66 61 2 1.5 5.3 0.2 1.5 5.6 78 19 3 0 0
ATL-B-7 50 n.d. 1.3176 612 634 n.d. 3790 788 7460 2.58 96 7 ATL-S-7 S 0.78 60 2 1.7 3.7 0.6 1.8 4.1 71 19 10 0 0
ATL-B-8 63 38 1.3274 425 327 n.d. 4560 704 8270 3.28 123 9 ATL-S-8 S 1.24 44 3 1.4 0.8 1.2 1.6 2.4 36 9 55 0 0
ATL-B-9 84 38 1.3650 106 41 n.d. 5920 352 11,300 4.99 190 13 ATL-S-9 S 3.20 13 5 0.6 0.0 0.1 0.3 0.3 0 75 0 25 0
ATL-B-10 112 n.d. n.d. 105 38 n.d. 5980 362 11,200 7.12 270 19 ATL-S-10 S 3.08 39 3 1.7 0.0 0.0 0.1 3.1 0 6 0 0 94
ATL-S-10-etd S 2.44 46 3 1.7 0.03 0.0 0.2 3.2 0 6 0 0 94
G G-B-20 67 28 1.3268 742 850 1 4320 997 7950 2.30 86 6 G-S-20-bc bc 0.75 48 3 1.3 3.1 0.3 1.3 3.7 71 23 6 0 0
G-B-26 87 27 1.3460 177 94 1 5290 529 9810 4.08 150 11 G-S-26-crys Crys 0.80 75 1 3.2 0.3 0.2 2.9 0.8 0 94 0 6 0
G-B-38 153 n.d. 1.3646 81 20 1 5890 306 11,300 6.04 230 16 G-S-38-bc bc 2.33 49 3 2.1 0.0 0.0 0.6 3.2 0 25 0 0 75
W W-B-1 0 29 1.2803 2260 430 3 2440 852 6130 1.26 47 3
W-B-9 26 26 1.2887 2000 510 4 2900 965 6170 1.42 53 4
Oxidized-W W-B-25 90 22 1.3913 92 30 2 6430 552 11,300 13.8 520 36
a Density was measured using a Mettler Toledo Densito 30PX density meter after sample centrifugation, except for samples ATL-B-5.
bMolar fraction of Mg contributed by the solids in the ‘‘wet-salt”(see Eq.(3)).
cMillimoles of each ion in the solid salt per g of ‘‘wet-salt”.
dSample washed with ethanol before dissolution.
N.Shalevetal./GeochimicaetCosmochimicaActa301(2021)30–4733
Table 3
Evaporation experiments-Mg isotopic compositions. Exp.: experiment, n-number of standard-sample-standard brackets, MgSO4: Mg-sulfate, Kai: kainite, Car: carnallite, Bis: Bischofite.
Exp. DE(Li)a DE(Li)errora Brine sample Brine Salt sample Wet-salt Li-corrected salt Mg-salts mineralogya Dsalts-brinec
Dsalts-brineerrorb d26Mg 1SD 95% conf.d25Mg 1SD 95% conf. n d26Mg 1SD 95% conf. d25Mg 1SD 95% conf. n d26Mg Errorb MgSO4 Kai Car Bisch
‰ ‰ ‰ mol(Mg-mineral)/mol(Mg-total) ‰
ATL 58 4 ATL-B-5 0.83 0.04 0.07 0.42 0.02 0.04 4 - - - - - - - - - - - - - - - -
96 7 ATL-B-6 0.90 0.01 0.02 0.46 0.01 0.01 4 ATL-S-6 0.77 0.04 0.07 0.38 0.03 0.04 4 0.69 0.11 0.87 0.13 0.00 0.00 0.22 0.12
96 7 ATL-B-7 0.85 0.04 0.06 0.42 0.02 0.03 4 ATL-S-7 0.86 0.06 0.07 0.46 0.05 0.05 6 0.87 0.13 0.65 0.35 0.00 0.00 0.03 0.14
123 9 ATL-B-8 0.60 0.10 0.15 0.32 0.05 0.07 4 ATL-S-8 1.06 0.03 0.08 0.54 0.01 0.04 3 1.65 0.24 0.14 0.86 0.00 0.00 1.05 0.29
190 13 ATL-B-9 0.82 0.03 0.03 0.41 0.01 0.01 8 ATL-S-9 0.68 0.03 0.06 0.34 0.03 0.09 3 0.28 0.54 0.75 0.00 0.25 0.00 1.10 0.54
270 19 ATL-B-10 1.04 0.03 0.03 0.52 0.01 0.01 7 ATL-S-10 0.96 0.01 0.02 0.48 0.01 0.01 4 0.84 0.10 0.06 0.00 0.00 0.94 0.20 0.10 270 19 ATL-B-10 1.04 0.03 0.03 0.52 0.01 0.01 7 ATL-S-10et 0.10 0.01 0.02 0.50 0.01 0.01 4 0.95 0.08 0.06 0.00 0.00 0.94 0.09 0.09
G 86 6 G-B-20 0.72 0.04 0.04 0.38 0.05 0.04 8 G-S-20bc 0.58 0.07 0.05 0.30 0.07 0.05 10 0.42 0.11 0.80 0.20 0.00 0.00 0.30 0.12
150 11 G-B-26 0.82 0.06 0.05 0.45 0.06 0.06 7 G-S-26-crys 0.84 0.08 0.06 0.46 0.06 0.05 9 0.84 0.10 0.94 0.00 0.06 0.00 0.02 0.11 230 16 G-B-38 0.81 0.09 0.05 0.41 0.05 0.03 13 G-S-38bc 0.91 0.05 0.04 0.49 0.05 0.05 7 1.03 0.13 0.25 0.00 0.00 0.75 0.22 0.14
W 47 3 W-B-1 0.86 0.06 0.05 0.42 0.03 0.03 8 – – – – – – – – – – – – – – – –
53 4 W-B-9 0.71 0.05 0.04 0.36 0.02 0.02 7 – – – – – – – – – – – – – – – –
Oxidized-W 520 36 W-B-25 1.08 0.09 0.09 0.58 0.16 0.17 6 – – – – – – – – – – – – – – – –
a FromShalev et al. (2018b).
b Calculated by error propagation.
c The isotope difference between the Li-corrected salt and its precipitating brine.
34N.Shalevetal./GeochimicaetCosmochimicaActa301(2021)30–47
damaging and losing part of the salt crystals. Thus, the analyses of the salts were conducted on the dissolved
‘‘wet-salts”. In order to correct for the contribution of the brine to the bulk chemical composition of the ‘‘wet salt” and to its Mg isotopic composition, a Li correction was applied, assuming that the Li in the ‘‘wet-salt”is derived solely from the adsorbed brine (i.e., no Li is present in the salt lattice). The mineral assemblage in each salt sample was then determined from iterating the chemical composi- tion of the solid salt, containing no adsorbed brine, to yield the best-fit assemblage with minimum excess of ions. A thermodynamic simulation of the evaporation experiment was later run, which enabled to distinguish between mineral assemblages that have the same chemical composition. See supplemental informationfor further details and equations, Table SI2 for the resulted mineralogy, and Shalev et al.
(2018b)for discussion on the limitation and validation of these methods.
2.2. Natural salts sampled from evaporitic sections
To supplement the experimental results, several samples of natural Mg minerals from evaporitic sections were ana- lyzed for their Mg isotopic composition. Samples were obtained from the Permian geological deposit in Klodawa, Poland (courtesy of I. Ploch), from the Messinian geologi- cal record in Realmonte Mine, Sicily, Italy, and in the Ionian Sea (courtesy of P. Censi). In addition, modern car- nallite and its precipitating brine from the industrial evap- oration pans of the Dead Sea Works were analyzed (courtesy of A. Katz). The mineralogy of the ancient Mg- salt samples was established by XRD in the GSI laborato- ries (Table 4). The mineralogy of the modern Dead Sea car- nallite was obtained following the procedure described above for ‘‘wet-salts”.
2.3. Determination of Mg isotopic compositions
The chemical pre-treatments and Mg isotope measure- ments conducted in the geochemical laboratories of the GSI are detailed inShalev et al. (2018a). Chemical separa- tion of Mg was done by liquid chromatography (Galy et al.,
2002) using BioRAD Econo-Pac Chromatography Col- umns, filled with Bio-Rad AGÒ 50W-X12 100–200 mesh resin. Samples, containing ca. 200mg Mg, were loaded onto the columns. Then, the matrix was first rinsed with 25 ml of 1.3 M HCl, and then with 20 ml of 2.3 M HCl. The Mg fraction was then eluted with 24 ml of 2.3 M HCl. The total procedural blanks contained <0.5% of the Mg amount pro- cessed through column chemistry. Magnesium recovery was
>99% and the matrix separation (the molar ratio [K + Ca + Na]/[Mg]) was <0.05 (after Galy et al., 2001). These parameters were verified for each sample using ICP-AES (Optima 3300, Perkin–Elmer).
Magnesium isotopes analyses were conducted using a Nu Instruments Plasma II MC-ICP-MS (Shalev et al., 2018a). Samples were introduced into the mass spectrome- ter via a DSN-100 desolvation system. Measurements were conducted using three Faraday cup collectors to measure the ion beam intensities at m/z 24, 25 and 26 simultane- ously. Each measurement run (a block) comprises 20 inte- grations of 10 s data acquisition, which is a total 200 s of data acquisition per measurement. The zero reference points were reset simultaneously for all measured masses by deflecting the potential of the electrostatic analyzer before measuring each block. Correction for instrumental mass discrimination was done using the standards-sample bracketing technique and the resulted isotope ratios are reported as per mil deviation from the international refer- ence material DSM-3 in the delta notation:
d26Mgð‰Þ ¼ ð 26Mg= 24MgÞsample 1
2 ð26Mg= 24MgÞDSM3ð1Þþ ð 26Mg= 24MgÞDSM3ð2Þ
h i1
2 4
3 5 1000
ð2Þ where DSM3(1) and DSM3(2) are the standards measured before and after the sample, respectively. Each sample was measured by several brackets of standard-sample-standard, which were used for statistical analysis, where n is the num- ber of brackets run for the specific sample (Table 3). In order to estimate the long-term reproducibility, a pre- treated sample of modern Dead Sea brine (DSW-1) was repeatedly measured (d26Mg =0.67 ± 0.11‰, 2SD, Table 4
The Mg-isotopic composition of Mg-salts from different locations and ages.
Sample Location Age Mineralogy d26Mg [‰] SD [‰] 95% conf. [‰] n
Realmonte-1 Realmonte mine, Sicilia Messinian Kainite 1.96 0.20 0.30 3
Realmonte-2 Realmonte mine, Sicilia Messinian Kainite 2.14 0.07 0.07 6
Realmonte-4 Realmonte mine, Sicilia Messinian Kainite 2.09 0.05 0.07 5
Klodawa-2 Klodawa mine, Poland Permian Kieserite, Halite 1.12 0.22 0.30 4
Klodawa-3 Klodawa mine, Poland Permian Polyhalite 0.43 0.07 0.07 6
Klodawa-6 Klodawa mine, Poland Permian Carnallite +1.39 0.03 0.04 4
KRYOS 0–1 Ionian Sea Bischofite,
Anhydrite, Quartz
0.36 0.07 0.10 3 G-5074-brine Industrial evaporation Pond 3,
Dead Sea Works
Present brine 0.71 0.09 0.14 4
G-5074-salta Industrial evaporation Pond 3, Dead Sea Works
Present Carnallite +0.21 0.07 0.07 7
a Results for G-5074-salt are Li-corrected based on the analyses of the brine. 72% of the total Mg in the wet-salt was calculated to be in the solid phase.
N. Shalev et al. / Geochimica et Cosmochimica Acta 301 (2021) 30–47 35
n = 35,Shalev et al., 2018a). The result of DSW-1, as well as the results of the international standards: Cambridge-1 (2.62 ± 0.14‰, 2SD, n = 36) and IAPSO seawater (0.84 ± 0.09‰, 2SD, n = 12) are identical, within errors, to the values reported by other laboratories and in previous literature (Shalev et al., 2018aand references therein).
The isotopic compositions of the salts, d26Mgsalt, pre- sented hereafter, are the compositions after correction for the contribution of the Mg in the adsorbed brine. Using the Li-correction method (described in the supplemental information, equations SI1 – SI5), fsaltMg; the fraction of Mg contributed by the solid salt (i.e., Mg that is incorpo- rated into the mineral lattice) to the ‘‘wet-salt”, was calcu- lated (Section 2.1 above and Shalev et al., 2018b). This fraction,fsaltMg, is defined as:
fsaltMg ¼MsaltMg
MwetMg ð3Þ
whereMsaltMgis the calculated mass of Mg in the solid salt (in- corporated into the mineral lattice), obtained fromsupple- mental equation SI5, andMwetMgis the measured total mass of Mg in the ‘‘wet-salt”. Propagated errors onfsaltMg are shown inTable 2.
Then,d26Mgsaltwas calculated from a mixing equation, using fsaltMg and the measured d26Mg of the ‘‘wet-salt”, d26Mgwet, and of the corresponding brine,d26Mgbrine: d26Mgsalt¼d26Mgwetj1fsaltMgk
d26Mgbrine
fsaltMg
h i ð4Þ
Thed26Mgbrinevalue that was used in Eq.(4)above is of the brine sampled together with the salt sample. Salt sam- ples are either suspended salt or salt that accumulated on the bottom of the bucket between two successive sampling (over 3–4 days). It was shown byShalev et al. (2018b)that the total amount of Mg removed from the brine during these 3–4 days was always <7% and it is therefore assumed that thed26Mg value of the brine did not change signifi- cantly between successive samples. The d26Mgsalt values and their propagated errors are shown inTable 3.
3. RESULTS
3.1. Magnesium isotopic composition of brines and Mg-salts during the evaporation experiments
Despite the significant removal of Mg from the brine through the precipitation of Mg-K-minerals (up to60%, 50% and80% of the Mg in experiments ATL, G and W, respectively), thed26Mg values of the evaporating brines varied within a narrow range of <0.5‰, between1.08‰ and0.60‰(Table 3andFig. 1). Falling within this range, as the brine evaporated, a complex evolution was observed, with values higher, similar or lower than the initial seawater (0.83‰;Young and Galy, 2004; Foster et al., 2010; Ling et al., 2011). The range of the d26Mg values of the salts, d26Mgsalt, however, is larger, >1.9‰, with salts composition being between1.65‰ and +0.28‰;Table 3andFig. 1).
Some of the d26Mgsalt values have relatively large errors.
In these cases, the Mg in the ‘‘wet-salt”originating from the solid Mg-salt is small compared to the Mg from the adsorbed brine (i.e., smallfsaltMg), and the propagated error therefore increases (Tables 2 and 3andFig. 1). Yet, the iso- topic data clearly show that some salt samples are ’heavier’
than their precipitating brine while others are ’lighter’ than the brine (Table 3andFig. 1), suggesting that Mg-salts pre- cipitation from extremely evaporated seawater involves iso- tope fractionations of opposing signs.
3.2. Magnesium isotopic composition of natural Mg-salts The natural Mg-salt samples were found to have a range ofd26Mg values of ca. 3.5‰(2.14‰to +1.39‰;Table 4 andFig. 2), much larger than the range of values of the Mg- salts from the evaporation experiments. Thed26Mg values of the analyzed natural carnallite, bischofite and polyhalite are higher than that of modern seawater (0.83‰, accord- ing to Young and Galy, 2004; Foster et al., 2010; Ling et al., 2011), while d26Mg values of kieserite and kainite are lower (Fig. 2). These results support the experimental results, which suggested a bi-directional isotope fractiona- tion during precipitation of evaporitic Mg-salts.
4. DISCUSSION
4.1. Magnesium isotope fractionation during precipitation of Mg-evaporites
The Mg isotope fractionation during precipitation of different Mg-minerals, Dmineral-brine, was estimated from the isotope difference betweend26Mgsaltandd26Mgbrineof concurrently sampled salt and brine, respectively (Dsalt-brine=d26Mgsaltd26Mgbrine;Table 3). In experiment ATL, suspended salts that were collected with the brine samples and separated by centrifugation were analyzed.
In experiments G and W, salts were allowed to accumulate on the bottom of the evaporation buckets between each two successive sampling (over 3–4 days). The total amount of Mg removed from the brine through Mg-salt precipitation during these 3–4 days was always <7% (Shalev et al., 2018b) and it is therefore assumed that the precipitation of the Mg-salts did not significantly change thed26Mg value of the brine between two successive sampling. Thus, the iso- tope difference,Dsalt-brine, of salt-brine pairs is taken here to represent the instantaneous isotope fractionation.
However, since all the salt samples that were selected for this study contained mixtures of two Mg-minerals (Table 3), determination of the isotope fractionation during the pre- cipitation of the individual minerals (Dmineral-brine) was cal- culated by simultaneously solving two linear mixing equations of the form:
Dsaltbrine¼xDmineralð1Þbrineþ ð1xÞ Dmineralð2Þbrine ð5Þ whereDsalt-brineis the measured isotope difference between the salt sample and brine sample (Table 3), mineral(1) and mineral(2) are the two Mg minerals in the mixture and x is the fraction of mineral(1) in the salt sample (Mg mole fraction, presented in Table 3; after Shalev et al., 36 N. Shalev et al. / Geochimica et Cosmochimica Acta 301 (2021) 30–47
2018b). The two unknowns, Dmineral(1)-brine and Dmineral(2)-brine, are the isotope differences between mineral (1) and mineral(2) and the precipitating brine, respectively.
A minimum of two salt samples containing a mixture of the same two minerals in different proportions (different x in Eq. (5)), are needed to solve for Dmineral(1)-brine and
Dmineral(2)-brine, simultaneously. For any combination of salts containing the same two minerals, Eq.(5)is a linear function of the form: Dsalt-brine= f(x). A linear fit of this function yields both, Dmineral(1)-brine andDmineral(2)-brine by extrapolating f(x) to two extreme cases: 1) x = 0, yielding Dsalt-brine=Dmineral(2)-brine; and 2) x = 1, yielding Dsalt-brine=Dmineral(1)-brine. An example for such extrapola- tion is presented by a plot for 4 different proportions (x) of epsomite and kainite (Fig. 3a). The errors on Dmineral (1)-brine and Dmineral(2)-brine were estimated by calculating the 95% confidence interval of the linear regression line (Fig. 3andTable 5). Such error estimates require more than two different salt samples containing the same minerals. In case of just two salt samples, the errors were estimated from Eq.(5)when applying the maximum propagated errors on Dsalt-brineand x (Fig. 3b,c andTable 5). It should be noted that this approach assumes thatDmineral-brinefor each min- eral is constant throughout the experiment. Otherwise, the mixing of two or more salt mixtures (Eq. (5)) will not be linear.
The determination ofDmineral-brine for the natural salts measured in this study (Tables 4 and 5) is not possible since the precipitating brines are long gone. Yet, in order to obtain first order estimates ofDmineral-brine, thed26Mg values of the natural salts were subtracted from the Mg isotopic composi- tion of modern seawater (d26Mg =0.83‰). It should be noted however, that d26Mg of seawater varied somewhat during the Cenozoic Era (Higgins and Schrag, 2015;
Gothmann et al., 2017) and, possibly, throughout the Phanerozoic Eon (Li et al., 2015; Xia et al., 2020). Further- more, reactions (e.g., dolomitization) and/or mixing with dif- ferent Mg sources within the evaporitic basin may have changed the composition of the evaporating seawater Fig. 1. Thed26Mg values of brines and salts from the evaporation experiments. Brines are shown in blue and salts in red (diamonds- ATL, squares- G, triangles- W and oxidized-W). The degree of evaporation (DE) of the salts is equal to the DE of the conjugate brines. Error bars on the isotopic compositions of the brines are 95% confidence limit and errors on the isotopic compositions of the solid salts and on DE are calculated by error propagation. Seawaterd26Mg value (0.83‰) is shown by grey solid line and the 2SD uncertainty on this value (0.09‰; Ling et al., 2011) is shown by grey dashed lines. (For interpretation of the references to colour in this figure legend, the reader is referred to the web version of this article.)
Fig. 2. Magnesium isotopic composition of various natural Mg- salts from different geological ages. Error bars are the 95%
confidence limits. The d26Mg of modern seawater (SW; Young and Galy, 2004; Foster et al., 2010; Ling et al., 2011) and of the evaporated Dead-Sea (DS) brine, from which the sample DS- carnallite was precipitated, are presented for comparison.
N. Shalev et al. / Geochimica et Cosmochimica Acta 301 (2021) 30–47 37
(e.g.,Geske et al., 2015a, 2015b; Shalev et al., 2021) and the salts themselves may have been subjected to late recrystal- lization. Exception to this is the modern carnallite from the Dead Sea evaporation pans, for which we measured also thed26Mg of the precipitating brine which allowed direct determination ofDcarnallite-brine.
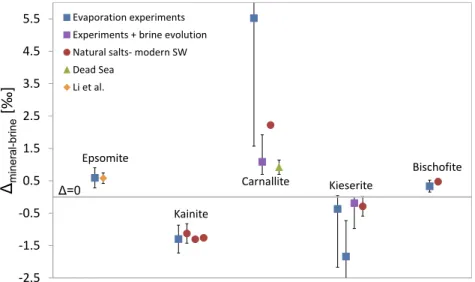
Results ofDmineral-brinefor each mineral are presented in Table 5andFig. 4. Despite large errors in some samples, the Dmineral-brine values for each mineral cluster within a rather narrow range, corroborating the isotope fractiona- tions of opposing signs. It should be noted that these dis- tinctive clusters are observed despite the non-constant (semi)natural conditions of the experimental and natural salt precipitation (such as temperature, precipitation rate, presence of organic matter, brine composition, etc.). Note that the values of Depsomite-brine, Dcarnallite-brine and Dbischofite-brine are positive and the values of Dkainite-brine
andDkieserite-brineare negative.
The isotope fractionation of epsomite, calculated from the evaporation experiments, Depsomite-brine= +0.59‰ (see errors inTable 5), is identical, within errors, to the equilib- rium value of 0.58‰determined experimentally byLi et al.
(2011) on epsomite precipitated from Mg-SO4 artificial solution (Fig. 4). TheDkainite-brinevalue obtained from the evaporation experiments, 1.30‰, is similar to the Dkainite-SWof the three Messinian natural samples, assuming they precipitated from a brine having Mg isotopic compo- sition of modern seawater. The Dcarnallite-SW=+2.22‰, calculated from Permian carnallite versus modern seawater, is within the large error obtained forDcarnallite-brinefrom the evaporation experiments (Table 5andFig. 4). However, the isotope fractionation determined on the Dead Sea carnal- lite, Dcarnallite-brine= +0.92‰, is significantly lower than both the calculated Permian and evaporation experiments values. It should be noted that the brine composition of the Dead Sea, which is a Ca-chloride brine, is very different from evaporated modern seawater and is characterized by very low sulfate concentration. The isotope fractionation during kieserite precipitation,Dkieserite-brine, was determined
from two sets of mineral mixtures in the evaporation exper- iments: kieserite-carnallite for which Dkieserite-brine= 0.37‰ (samples ATL-9 and G-S-26-crys) and kieserite- bischofite for whichDkieserite-brine=1.8‰ (samples ATL- 10 and G-S-38bc). These Dkieserite-brine values, however, are similar within errors (seeTable 5andFig. 4). Similarly, theDkieserite-SW of the natural Permian kieserite (0.29‰) falls within the errors of the Dkieserite-brine obtained from the kieserite-carnallite mixtures (0.37‰; Table 5 and Fig. 4). The isotope fractionation for bischofite, Dbischofite-brine, is 0.33‰, based on the kieserite-bischofite mixtures in the evaporation experiments. It is equal, within errors, to theDbischofite-SW= 0.47‰calculated from the nat- ural Permian bischofite (Table 5andFig. 4).
In summary, we suggest the following isotope fractiona- tions for the investigated evaporite Mg-salts: Depsomite- brine= +0.59 ± 0.31‰, Dkainite-brine=1.3 ± 0.43‰, and Dbischofite-brine = +0.33 ± 0.19‰. Due to large errors, Dcarnallite-brine and Dkieserite-brine are further discussed in Section 4.2.
4.2. Evolution ofd26Mgbrineduring brine evaporation and Mg-salts precipitation
The Mg isotopic composition of the dissolved Mg,d26- Mgbrine, during the course of experimental evaporation of seawater remained close-to-constant, within ca. ±0.25‰ of the value of the original seawater (Table 3andFig. 1).
This is despite the significant fraction of Mg that was removed from the brine during the experiments, in the form of Mg-salts (up to60%,50% and80% of the Mg was removed in experiments ATL, G and oxidized-W, respec- tively) and the significant isotope fractionation that accom- panies the Mg-salts precipitation. We conclude that this small variation in d26Mgbrine stems from the precipitation of multi-mineral assemblages having opposite Mg-isotope fractionations. This observation stands in contrast to the previously suggested evolution of the d26Mgbrine value in closed system (>0.4‰decrease ind26Mgbrineat >50% Mg Fig. 3. The Dsalt-brine values versus the fraction of mineral(1), x in Eq.(5), in two-mineral mixtures collected during the evaporation experiments. (A) Mixtures of epsomite and kainite; (B) mixtures of kieserite and carnallite; and (C) mixtures of kieserite and bischofite. Errors onDsalt-brinewere calculated by error propagation (presented inTable 3). Errors on x were propagated from the error on the Li-corrected chemical compositions of the salt (Shalev et al., 2018b). Grey-solid lines are the linear regression (equation and R2 are presented where possible). The isotope fractionations of the pure minerals,Dmineral(1)-brineandDmineral(2)-brine, were calculated by extrapolating the lines for x = 0 and x = 1 as explained in the text (results are presented inTable 5). The dotted lines show either the 95% confidence interval on the linear regression (in panel A) or the mixing lines (Eq.(5)) when applying the maximum errors onDsalt-brineand x (in panels B and C).
38 N. Shalev et al. / Geochimica et Cosmochimica Acta 301 (2021) 30–47
Table 5
Mineral-specific isotope difference.
Mineral Source Calculation method Salt samples
used for calculation
Mineral
abundance in samplea
Error on abundancea
Dmineral-brineor
Dmineral-SWb[‰]
Uncertainty(+)c Uncertainty(-)c
Epsomite Evaporation experiments Mixing line ATL-6 0.87 0.001 0.59 0.31 0.31
ATL-7 0.65 0.005
ATL-8 0.14 0.09
G-B-20 0.80 0.03
Epsomite Li et al. (2011) Experimental 0.58 0.16 0.16
Kainite Evaporation experiments Mixing line ATL-6 0.13 0.001 1.30 0.43 0.43
ATL-7 0.35 0.005
ATL-8 0.86 0.09
G-B-20 0.20 0.03
Kainite Natural sample, Messinian Relative to modern SW Realmonte-1 1.13 0.30 0.30
Kainite Natural sample, Messinian Relative to modern SW Realmonte-2 1.31 0.07 0.07
Kainite Natural sample, Messinian Relative to modern SW Realmonte-4 1.26 0.06 0.06
Carnallite Evaporation experiments Mixing line ATL-9 0.25 0.09 5.5 17 4.0
G-B-26-crystal 0.06 0.03
Carnallite Natural sample, Permian Relative to modern SW Klodawa-6 2.22 0.04 0.04
Carnallite Natural sample,
Modern Dead Sea salt pond
Relative to its precipitating brine G-5074-salt 0.92 0.22 0.22
Kieserite Evaporation experiments Mixing line ATL-9 0.75 0.09 0.37 0.41 1.8
G-B-26-crystal 0.94 0.03
Kieserite Evaporation experiments Mixing line ATL-S-10 0.06 0.003 1.8 1.1 1.3
G-S-38bc 0.25 0.01
Kieserite Natural sample, Permian Relative to modern SW Klodawa-2 0.29 0.30 0.30
Bischofite Evaporation experiments Mixing line ATL-S-10 0.94 0.003 0.33 0.19 0.18
G-S-38bc 0.75 0.01
Bischofite Natural sample Relative to modern SW KRYOS 0–1 0.47 0.10 0.10
a FromShalev et al. (2018b), based on the chemistry of the solid sample. Errors are propagated from the error on the Li-corrected chemical compositions of the salt (Shalev et al., 2018b).
bThe isotope difference between the ancient mineral sample and modern seawater.
cFor natural samples, the uncertainty is the analytical 95% confidence interval. For samples from the evaporation experiment, uncertainty is calculated as shown inFig. 3and is, therefore, asymmetric in some cases.
N.Shalevetal./GeochimicaetCosmochimicaActa301(2021)30–4739
removal), which was based only on data from epsomite (Li et al., 2011). Thus, our results stress the importance of accounting for all the different Mg-evaporite salts present in evaporitic sequences in future Mg-isotope studies.
Furthermore, given the known mineral assemblages in our evaporation experiment, this small change in thed26- Mgbrinevalue along the course of the evaporation can be used to better constrain theDmineral-brine values. Here, we use this approach to obtain better estimates of the Mg iso- tope fractionation of the minerals carnallite and kieserite that showed rather large errors in the evaporation experi- ments (Fig. 4). For that purpose, we modeled the evolution ofd26Mgbrine throughout evaporation experiments G and Oxidized-W, given the isotope fractionations,Dmineral-brine, for epsomite (0.59‰), kainite (1.3‰) and bischofite (0.33‰), as calculated above (Section 4.1), and the detailed brine chemical composition and precipitating mineral assemblages, taken fromShalev et al. (2018b)and summa- rized inTable 6. Initial d26Mg value is0.83‰ (modern seawater). The expected change ind26Mgbrinebetween two successive samplings of mineral assemblages was calculated using a mass balance equation:
d26Mgbrine nþ1ð Þ¼d26Mgbrine nð Þ1fstep nþ1ð Þ
Dtotal nþ1ð Þ
ð6Þ whered26Mgbrine(n+1)andd26Mgbrine(n)are thed26Mg val- ues of the brine in step n + 1 and step n, respectively, and fstep(n+1) is the mole fraction of the remaining Mg in the brine in step n + 1 relative to the previous step, n (Table 6).
The values offstep(n+1)were calculated based on the mea- sured Mg concentrations in the brine in both steps n and n + 1 and the DE(Li) at each step (from Shalev et al.,
2018b; see also thesupplemental information). The differ- ence in the isotopic compositions between the precipitating Mg mineral assemblage and the brine at step(n + 1),Dtotal (n+1)(=d26Mgsalts(n+1)-d26Mgbrine(n+1)), was calculated from the measured Mg mole fraction of each mineral phase in the salt sampled in each step, xmineral (Table 6; from Shalev et al., 2018b), and from the corresponding isotope fraction- ation of this mineral,Dmineral-brine:
Dtotal¼xepsomiteDepsomitebrineþxkainiteDkainitebrine
þxcarnalliteDcarnallitebrineþxkieseriteDkieseritebrine
þxbischofiteDbischofitebrine ð7Þ
The values of Dcarnallite-brine and Dkieserite-brine were allowed to change between 0.7‰ and 5.5‰, and between 1.8‰ and 0.0‰, respectively (Table 5 andFig. 4). The resultingd26Mgbrinevalues were compared to the three mea- sured d26Mgbrine values in the carnallite and kieserite pre- cipitation phases available from experiments G and Oxidized-W: G-B-26, G-B-38 and W-B-25 (Table 3 and Fig. 5). The sum of the deviations between the modeled and the measured values was minimized to achieve a unique best-fit output using Microsoft Excel Solver. Then, the ranges of Dcarnallite-brine and Dkieserite-brine, for which the modeled d26Mgbrine is within the errors of the measured value for all three samples were calculated to obtain uncer- tainty estimations on the best-fit values. TheDcarnallite-brine
value is constrained by this approach to range between 0.7‰and 1.9‰and the best fit yields aDcarnallite-brinevalue of 1.1‰. The Dkieserite-brine value is constrained to range between 0.0‰ and 1.0‰ and the best fit yields a Dkieserite-brinevalue of0.2‰(Figs. 4 and 5).
mineral-brine
=0
Fig. 4. Magnesium isotope fractionations (Dmineral-brine) during precipitation of evaporitic Mg-minerals. Blue squares- isotope fractionation determined based on salt-mixtures from the evaporation experiments; Purple squares- isotope fractionation determined based on salt-mixtures and brine evolution in the evaporation experiments (seeSection 4.2below); Red circles- isotope difference between ancient natural salts and modern seawater; Green triangle- isotope fractionation between Dead Sea carnallite and its precipitating brine; Orange diamond- result from Li et al. (2011): isotope fractionation between epsomite and artificial Mg-sulfate solution. The grey horizontal line represents no isotope fractionation. See text andTable 5forDmineral-brineand error calculation procedures. (For interpretation of the references to colour in this figure legend, the reader is referred to the web version of this article.)
40 N. Shalev et al. / Geochimica et Cosmochimica Acta 301 (2021) 30–47