Sub-Permil Interlaboratory Consistency for Solution-Based Boron Isotope Analyses on Marine Carbonates
Marcus Gutjahr
(1)*, Louise Bordier
(2), Eric Douville
(2), Jesse Farmer
(3), Gavin L. Foster
(4), Ed C. Hathorne
(1), B arbel ¨ H onisch ¨
(3), Damien Lemarchand
(5), Pascale Louvat
(6),
Malcolm McCulloch
(7), Johanna Noireaux
(6), Nicola Pallavicini
(8), James W. B. Rae
(9, 10), Ilia Rodushkin
(8, 11), Philippe Roux
(5, 12), Joseph A. Stewart
(4, 13), François Thil
(2)and Chen-Feng You
(14)(1) GEOMAR Helmholtz Centre for Ocean Research Kiel, Wischhofstrasse 1-3, 24148, Kiel, Germany
(2) Laboratoire des Sciences du Climat et de l’Environnement, LSCE/IPSL, CEA-CNRS-UVSQ, Universit´e Paris-Saclay, F-91191, Gif-sur-Yvette, France
(3) Department of Earth and Environmental Sciences and Lamont-Doherty Earth Observatory, Columbia University, 61 Route 9W Palisades,NY, 10964, USA
(4) School of Ocean and Earth Science, University of Southampton, National Oceanography Centre, Southampton, European Way, Southampton SO14 3ZH, UK
(5) Laboratoire d’Hydrologie et de G´eochimie de Strasbourg, EOST, Universit´e de Strasbourg et CNRS, 1 rue Blessig, 67084, Strasbourg, France (6) Institut de Physique du Globe de Paris, Sorbonne Paris Cite, Universit´ e Paris-Diderot, UMR CNRS 7154, 1 rue Jussieu, 75238, Paris Cedex´ 05, France
(7) ARC Centre of Excellence for Coral Reef Studies and School of Earth and Environment, The University of Western Australia, Crawley 6009, Australia
(8) ALS Scandinavia AB, Aurorum 10, SE-97775, Lulea, Sweden˚
(9) Geological and Planetary Sciences, Caltech, 1200 E California Blvd, Pasadena, CA, 91125, USA (10) School of Earth and Environmental Sciences, University of St Andrews, North Street, St Andrews, UK (11) Division of Geosciences, Lulea University of Technology, S-971 87, Lule˚ a, Sweden˚
(12) Biogeochimie des Ecosyst`´ emes Forestiers, INRA, 54280, Champenoux, France (13) School of Earth Sciences, University of Bristol, Queens Road, Bristol BS8 1RJ, UK
(14) Isotope Geochemistry Laboratory, Department of Earth Sciences, National Cheng Kung University, No 1 University Road, 701, Tainan, Taiwan Department of Geosciences, Princeton University, Guyot Hall, Princeton, NJ, 08544, USA
* Corresponding author. e-mail: mgutjahr@geomar.de
Boron isotopes in marine carbonates are increasingly used to reconstruct seawater pH and atmospheric pCO2through Earth’s history. While isotope ratio measurements from individual laboratories are often of high quality, it is important that records generated in different laboratories can equally be compared. Within this Boron Isotope Intercomparison Project (BIIP), we characterised the boron isotopic composition (commonly expressed inδ11B) of two marine carbonates:
Geological Survey of Japan carbonate reference materials JCp-1 (coralPorites) and JCt-1 (giant clamTridacna gigas).
Our study has three foci: (a) to assess the extent to which oxidative pre-treatment, aimed at removing organic material from carbonate, can influence the resultingδ11B; (b) to determine to what degree the chosen analytical approach may affect the resultantδ11B; and (c) to provide well-constrained consensusδ11B values for JCp-1 and JCt-1. The resultant robust mean and associated robust standard deviation (s*) for un-oxidised JCp-1 is 24.360.45‰(2s*), compared with 24.250.22‰(2s*) for the same oxidised material. For un-oxidised JCt-1, respective compositions are
16.390.60‰(2s*; un-oxidised) and 16.240.38‰(2s*; oxidised). The consistency between laboratories is generally better if carbonate powders were oxidatively cleaned prior to purification and measurement.
Keywords: mass spectrometry, Geological Survey of Japan, boron isotopes, carbonate reference materials, interlaboratory experiment.
Received 09 Jun 20–Accepted 22 Sep 20
Vol. 45 — N° 1 0 32 1 P . 5 9–7 5
doi: 10.1111/ggr.12364
The boron isotope system is a non-traditional light stable isotope system with only two isotopes, 10B and 11B. The boron isotope ratio of any substrate is usually presented relative to an isotope reference material distributed by the National Institute of Standards and Technology in delta notation:
δ11BNIST SRM 951¼
11B=10Bsample
11B=10BNIST SRM 9511 (1) where NIST SRM 951 (or NIST SRM 951a) represents a boric acid isotopic reference material powder. NIST SRM 951 and NIST SRM 951a are essentially isotopically identical with a certified 10B/11B of 0.24730.0002. In recent decades, boron isotope ratios measured in biogenic carbonates have emerged as a valuable tool to determine past seawater pH, a key variable to reconstruct atmo- spheric CO2 concentrations and other marine carbonate system parameters (Vengosh et al. 1991, Hemming and Hanson 1992). Boron isotope ratios in marine carbonates can be used as a pH indicator because of several key characteristics. First, boron behaves conservatively in sea- water with a residence time of~14 Ma (Lemarchandet al.
2000) and a resultant homogenous bulk seawaterδ11B of 39.610.04‰ (Foster and Pogge von Strandmann 2010). Boron in seawater occurs as two aqueous species, boric acid (B(OH)3) and borate ion (BðOHÞ4) (Dickson 1990). The relative abundance of each species is pH- dependent (Vengosh et al.1991, Hemming and Hanson 1992), resulting in the increasing proportion of borate ion under increasing pH conditions. Importantly, the δ11B of borate ion is isotopically depleted compared with boric acid as a function of equilibrium isotope fractionation between the two species (Zeebe 2005, Klochko et al.
2006). The ratio of borate ion to boric acid increases significantly in the pH range of modern and palaeo- seawater (ca. 7.7–8.3 on the total pH scale). Since most marine calcifiers only incorporate borate ion into biogenic carbonates, it follows that their boron isotopic ratio provides direct information on ambient seawater (Vengosh et al.
1991, Hemming and Hanson 1992) or internal calcifying fluid pH (Rollion-Bard and Chaussidon 2003, Allison and Finch 2010, McCulloch et al. 2012). While commonly applied to foraminifera (H¨onisch and Hemming 2005, Foster 2008, Rae et al. 2011), in recent years the pH sensitivity of the boron isotope system has been explored in a variety of marine biogenic carbonates, including bra- chiopods (Lecuyer et al. 2002, Penman et al. 2013, Jurikovaet al.2019), corals (H¨onischet al.2004, Reynaud et al. 2004, Wall et al. 2016, Cornwall and Comeau 2017, Wu et al.2018), molluscs (Heinemannet al.2012)
and coralline algae (Cornwall et al. 2017, Donald et al.
2017, Anagnostou et al.2019).
The first investigations into the pH-dependent fractiona- tion of 11B/10B during incorporation into CaCO3 were published in the late 1980s (e.g., Balzet al.1986, Oiet al.
1991). However, for many years significant offsets between individual laboratories (on the order of 2–11‰) permitted only limited comparability ofδ11B data between institutions (e.g., Aggarwal et al. 2009). This disagreement is not surprising since boron is a contamination-prone light stable isotope system that requires clean reagents and careful sample handling during purification and analysis, as well as a boron-free air handling system (e.g., Rosner and Romer 2005). The latest study comparing the reproducibility condition of measurement of boron isotopic data reported good agreement for solutions of dilute boric acids and seawater samples, yet also revealed elevated interlabora- tory isotopic offsets for identical carbonate sample materials on the order of up to~1.5‰(2s) (Fosteret al.2013). Only four laboratories participated in that study, and since then, considerably more research groups have begun publishing carbonate-derived boron isotope data. For this reason, we present a timely update on the interlaboratory comparability of boron isotope data in commonly used marine carbonate reference materials.
Besides comparing different sample handling and mass spectrometric approaches, a further sample preparation step in the measurement procedure was tested within the frame of BIIP. We assessed the impact of oxidative cleaning techniques on biogenic carbonates, such as those frequently performed for other geochemical analyses (Boyle 1981, Barker and Greaves 2003). We present boron isotope results generated in ten individual laboratories, which reveal an unprecedented level of consistency of carbonate δ11B results between laboratories. Given the comparison of cleaned and uncleaned material, we also identify potential pitfalls during the processing of carbonate samples for boron isotopic approaches that potentially compromise the high level of analytical agreement that is emerging between laboratories.
Materials
Two powdered and homogenised biogenic carbonates originally produced by the Geological Survey of Japan were analysed in ten different laboratories for our boron isotope interlaboratory comparison study (Table 1). The first carbon- ate used is JCp-1, a modern Porites sp. coral colony sampled 2 m below mean sea level on the north-east coast of Ishigaki Island, Ryukyu Islands, Japan (24°33ʹN,
124°20ʹE). JCp-1 is entirely aragonitic, and all surfaces of the corals in contact with the biological tissue were removed prior to processing (Okai et al. 2002). As outlined in the original publication, crushed coral material was washed with deionised water and dried prior to further grinding and homogenisation. The grain size fraction<250 mm of JCp-1 material was sieved and distributed by the Geological Survey of Japan.
The second reference material used was also prepared by the Geological Survey of Japan (Inoue et al. 2004).
Reference material JCt-1 is derived from a fossil mid- Holocene giant clam Tridacna gigas sampled near Kume Island, Japan (26°N, 126°E), in the central Ryukyu Islands, Japan. It is also entirely aragonitic. Further details on powder preparation of JCt-1 were not provided in Inoue et al.
(2004).
None of the powders were bleached prior to packing (Hathorneet al.2013). Previously published trace elemental ratios presented by Hathorneet al.(2013) are reported for comparison in Table 1. Notably, Sr, Mg, Ba, B and Li have higher ratios relative to Ca in JCp-1, while JCp-1 has approximately fifty times higher U/Ca than JCt-1. At 460μmol mol-1, the molar B/Ca ratio in JCp-1 is ~2.4 higher than in JCt-1, which has 191μmol mol-1(Hathorne et al.2013).
Due to changes in CITES regulations (i.e.,Convention on International Trade in Endangered Species of Wild Fauna and Flora; www.cites.org), neither of these biogenic carbon- ate materials are currently available for international distri- bution by the Geological Survey of Japan, but they remain common reference materials in many laboratories (e.g., Farmer and Honisch 2016, Lazareth¨ et al.2016, Raddatz et al.2016, Stewart and Anagnostou 2016, Jurikovaet al.
2019). Efforts are ongoing to find suitable replacements, and
two isotope standard solutions artificially produced with carbonate matrices (NIST RM 8301 (coral) and NIST RM 8301 (foram)) will soon become available as consistency reference materials for boron isotopic and trace metal isotope studies (Stewartet al.2020).
Analytical and mass spectrometric approaches
Nine out of the ten laboratories participating in this study used an MC-ICP-MS-based approach to determine the δ11B of the JCp-1 and JCt-1 reference materials; one used N-TIMS. With the exception of the N-TIMS approach, for which boron was not separated from the aragonitic matrix, elemental purification was carried out in all laboratories (Table 2). In eight laboratories, boron was purified using Amberlite™IRA743 exchange resin on microcolumns (Gon- fiantiniet al.2003, Foster 2008, Aggarwalet al.2009, Paris et al. 2010, Louvat and Bouchez 2011, Rae et al. 2011, Voinotet al.2013, McCullochet al.2014, Rouxet al.2015) or using a batch method (Douville et al.2010, Wu et al.
2018), and one laboratory employed the sublimation technique for boron purification (Wang et al. 2010). The boron total procedural blank ranged from below 8 pg to about 3000 pg between laboratories (Table 2). Sample ionisation during N-TIMS spectrometric measurement is achieved via heating of Re-metal filaments in a high-vacuum source chamber. For the MC-ICP-MS approaches, sample introduction was achieved using either: (a) a quartz spray chamber (Gonfiantini et al. 2003, Aggarwal et al. 2009, Douvilleet al.2010, Wanget al.2010, Voinotet al.2013, McCulloch et al. 2014), (b) a PFA spray chamber (Foster 2008, Rae et al. 2011), or (c) direct injection (d-DIHEN) (Paris et al.2010, Louvatet al. 2011, Louvatet al.2014).
Some of the laboratories used ammonia introduced via a second gas inlet into the spray chamber as an additional gas to aid washout between individual measurements (e.g.,
Table 1.
Selected previously published geochemical data from JCp-1 and JCt-1
JCp-1 2s JCt-1 2s Reference
CaO (%m/m) 53.50 0.28 54.66 0.16 Okaiet al. (2004)
LOI (%m/m) 44.36 n.d. 44.27 n.d. Okaiet al. (2004)
Robust means and robust std deviations reported below for previously un-oxidised sample powders
Sr/Ca (mmol mol-1) 8.838 0.042 1.680 0.026 Hathorneet al. (2013)
Mg/Ca (mmol mol-1) 4.199 0.065 1.289 0.045 Hathorneet al. (2013)
U/Ca (nmol mol-1) 1192 0.045 22.71 2.40 Hathorneet al. (2013)
Ba/Ca (μmol mol-1) 7.465 0.655 4.348 0.280 Hathorneet al. (2013)
B/Ca (μmol mol-1) 459.6 22.7 191.0 9.3 Hathorneet al. (2013)
Li/Ca (μmol mol-1) 6.185 0.107 4.076 0.503 Hathorneet al. (2013)
Table2. Massspectrometricapproachesusedandanalyticaldetails Mass spectrometryPurification methodOxidativereagent usedExposuretimeto oxidative reagent Temperatureused duringoxidative treatment SampleintroductionReferenceTotalprocedural blank MC-N-TIMSNoneH2O2bufferedin0.1moll-1NaOH-1% (JCt-1)or50% (JCp-1)
10min(JCt-1); 2×30min(JCp-1)80°CIonisationfromfilamentFosteretal.(2013)~10pg MC-ICP-MSSublimation6–14%NaClO24h25°CQuartzspraychamberWangetal.(2010)<8pg MC-ICP-MSSeparationbyion exchange10%H2O28min25°CMicro-cyclonicquartzspray chamberDouvilleetal.(2010)~500pg MC-ICP-MSSeparationbyion exchange10%H2O2bufferedto pH9withNH4OH1h25°CDirectinjection(d-DIHEN)Louvatetal.(2011),Louvat etal.(2014),Parisetal. (2010)
~150pg MC-ICP-MSSeparationbyion exchangeBuffered1%H2O215min(i.e., 3×5minwith ultrasonictreatment inbetween)
80°CPFAScottspraychamberFoster(2008),Raeetal. (2011,2018)~92pg MC-ICP-MSSeparationbyion exchangen.a.n.a.n.a.Mini-cyclonicquartzspray chamberGonfiatinietal.(2003), Aggarwaletal.(2009)~500pg MC-ICP-MSSeparationbyion exchangeNaClO;5%Cl15h21°CMini-cyclonicquartzspray chamberFoster(2008),Voinotetal. (2013)~3000pg MC-ICP-MSSeparationbyion exchangeBuffered1%H2O215min(i.e., 3×5minwith ultrasonictreatment inbetween)
80°CPFAScottspraychamberFoster(2008),Raeetal. (2011)~28pg MC-ICP-MSSeparationbyion exchangeBuffered1%H2O215min(i.e., 3×5minwith ultrasonictreatment inbetween) 80°CPFAScottspraychamberFoster(2008),Raeetal. (2011)~240pg MC-ICP-MSSeparationbyion exchangeNaClO15min25°CQuartzspraychamberMcCullochetal.(2014)~500pg
Foster 2008). None of the laboratories in this study used hydrofluoric acid to aid boron washout, although recent studies have shown this to be an effective alternative to an ammonia add gas (Misraet al.2014, Raeet al.2018). All laboratories used an (isotope-) calibrator-sample bracketing technique to deriveδ11B. Except for the MC-ICP-MS method with direct injection as introduction system, on-peak zeros were subtracted from respective ion beams in all MC-ICP- MS-based approaches. This approach is necessary because of the typically poor washout of boron compared with other isotope systems and the relatively small signal sizes, requiring tight control over memory effects during sample introduction.
BIIP interlaboratory comparison routine protocol In contrast to an earlier interlaboratory comparison study (Gonfiantini et al. 2003), participating laboratories were required to have a demonstrable record of producingδ11B high-quality data. Every participating laboratory was sent 2 g of powder of each of the two reference materials. A minimum of six test portions of each reference material, weighing at least 5 mg each, were analysed in each laboratory. Three of these test portions were processed without any oxidative cleaning, and the other three underwent oxidative cleaning using either NaClO or H2O2 in dilute NH4OH (Table 2).
Each laboratory reported 2–10 results for each test portion digest, either as individual filament analyses (e.g., N-TIMS) or simply as repeat measurements of the same powder preparation (e.g., MC-ICP-MS). The key aim of our study was to assess consistencies and potential discrepancies between techniques with particular focus on analytical problems that could be improved in future studies. Therefore, the reported δ11B data were compiled and statistically analysed by the first author, while the origin of each data set was kept anonymous as much as feasible.
Statistical data treatment
First, the averageδ11B value of each laboratory for the four individual sample sets (presenting either previously oxidised or un-oxidised JCp-1 or JCt-1 boron isotope results) was deter- mined. This provides a total of ten independent laboratory meanδ11B values for un-oxidised JCp-1 and nine meanδ11B values for oxidised JCp-1 (Table 3). For JCt-1 reference material powders, nineδ11B means from both un-oxidised and oxidised powders were reported (Table 4). Subsequently, the robust mean and associated robust standard deviation were calculated for each of the four data sets. To do so, we followed the ISO 13528:2015 data treatment procedure for normally distributed data sets as outlined inapproach 2of Srnkova and Zb´´ ıral (2009). The procedure of deriving the robust mean and robust standard deviation is iterative, and the
statistical analysis is repeated until no change in the calculated robust mean X* and its robust standard deviation s* is observed. The approach is outlined below.
An initial robust average X* is calculated from the median of each laboratory’s mean δ11B (hence n being either 9 or 10). The associated initial robust standard deviation (representing the median absolute deviation, MAD) s* is derived by multiplying the median of all laboratories’offsets fromX*from the interlaboratory median by 1.483. Calculation of s*=1.483×MAD is a robust scaling factor applied in statistic applications for normally distributed data sets following the argument that the median absolute deviation covers 50% (between ¼and¾) of the standard normal cumulative distribution function (see 13528:2015(E) 2015). Next, a δ value is calculated via multiplication of the initial robust standard deviation with a factor 1.5. Then, (X*-δ) and (X*+δ) are calculated. If any laboratory’s mean δ11B falls below (X*-δ), the actual laboratory mean δ11B is replaced with (X*-δ). If any laboratory’s δ11B mean falls above (X*+δ), the actual laboratory meanδ11B is replaced with (X*+δ). Laboratory mean δ11B values larger than (X*-δ) and smaller than (X*+δ) are kept, representing the vast majority of δ11B values presented here. This exercise led to exclusion of the following mean δ11B values: un-oxidised JCp-1 powders from laboratories 1 and 4 (laboratory numbers refer to corresponding numbers shown in Figures 1 and 2), un- oxidised JCt-1 powders from laboratories 1, 4 and 10, oxidised JCp-1 powders from laboratories 1 and 6, and oxidised JCt-1 powders from laboratories 6 and 10. For all four data sets (i.e., un-oxidised and oxidised JCp-1 and JCt- 1), an updated X* and s* was then calculated and the above screening procedure repeated, resulting in no further exclusion of data. The resultant robust means and robust standard deviations discussed in the text and shown in Table 5, and in Figures 1–4 have been derived in this manner. We reiterate that the robust standard deviation is calculated using only the meanδ11B per laboratory for each of the four data sets. As a measure of the integrity of reported meanδ11B from each laboratory, we used az-score:
z¼ ðxiX∗Þ=s∗ (2)
in whichxirepresents the individual laboratory averageδ11B,X*
the robust mean, and s*the robust standard deviation. An absolute z-score below or equal to 2 is considered to be acceptable, absolutez-score values between 2 and 3 are of likely questionable quality, or in the case of laboratory 10 reflect on a carbonate-specific constant offset between N-TIMS and MC-ICP-MS (see also Fosteret al.2013). Az-score value beyond 3 suggests that results are outside the satisfactory range. Given
thats*is used for determining thez-score for each laboratory mean, this approach may systematically exclude certain labo- ratoryresultsasoutliers(i.e.,thosewithmostdistinctδ11Brelativeto X*). However, given the distribution of our data sets, those mean laboratoryδ11B that fell beyond az-score of 3 are relatively clear cases of questionable quality (Figures 1 and 2).
Results
Throughout Figures 1–3, the order of laboratories is kept the same in the respective panels, chosen so that Figure 1a
displays δ11B in increasing order, hence does not simply follow the order of laboratories shown in Tables 3 and 4.
Range bars plotted in Figures 1a, b and 2a, b represent the reproducibility precision expressed as 2sof the three replicate analyses carried out in each laboratory. While a 2sderived from a population of three data points cannot provide an accurate 95% confidence limit, it becomes apparent from the individual reported δ11B that range bars shown in this manner provide a reasonable insight into the intermediate precision of each laboratory (see Figures 1 and 2, and Tables 3 and 4). Range bars in Figure 3 display the provided 2s intermediate precision for each individually measured 25
22
(a)
JCp-1 un-oxidised JCp-1 oxidised
(b)
(c)
3(d)
0
-3
-6
-9
z -score z -score δ
11B
δ
11B
23 2425
22 23 24
3
0
-3
-6
-9
24.25 ± 0.22 24.36 ± 0.45
lab 1
lab 5
lab 9
lab 2
lab 6
lab 10 lab 3
lab 7
lab 4
lab 8
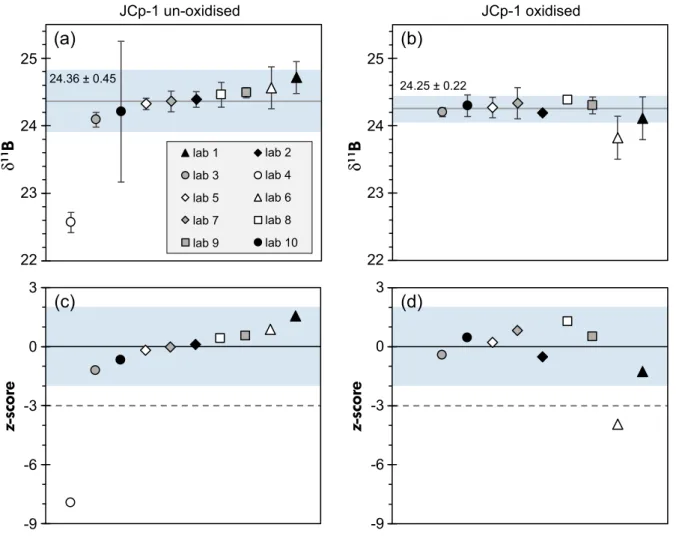
Figure 1. Boron isotope results for modernPoritessp. coral JCp-1, presented in delta notation relative to NIST SRM 951, presenting the meanδ1 1B for each laboratory with resultant 2s(see also Table 3) for (a) un-oxidised samples and (b) aliquots that underwent preceding oxidative treatment. Shaded area corresponds to theδ1 1B range enclosed by the double robust standard deviation 2s*(see text for Discussion). Values for the robust mean and double robust standard deviation are equally displayed and indicated by the grey lines in (a) and (b). (c)z-score associated with the mean laboratoryδ1 1B compositions shown in (a). (d)z-score associated with the mean laboratoryδ1 1B compositions shown in (b). An absolutez-score below or equal to 2 is considered acceptable, absolutez-score values between 2 and 3 are of likely questionable quality, and absolute values beyond 3 suggest that results are outside the satisfactory range, as indicated by the stippled horizontal lines in (c) and (d). [Colour figure can be viewed at wileyonlinelibrary.com
aliquot, which take into account the variable number of replications performed in each laboratory (n=2–10; see Tables 3 and 4). The calculated robust means are shown as grey lines and the robust standard deviations 2s*plotted as a shaded area in Figures 1a, b and 2a, b. The calculatedz- score for each data point is shown in panels c and d.
Laboratory means plotting within a z-score of-2 to 2 plot within the shaded area in panels of Figures 1c, d and 2c, d.
Thez-score threshold with an absolute value of 3 is marked with a dotted line on Figures 1 and 2.
We note that the few obvious outliers (identified via|z|
>3) in our interlaboratory comparison were all shifted towards lower reportedδ11B (Figures 1 and 2). Laboratory 4 only reported δ11B for un-oxidised JCp-1 and JCt-1 reference material powders, and submitted ratios fall outside
thez-score reliability threshold. Laboratory 6 provided results for oxidised standard δ11B for both JCp-1 and JCt-1 that also fail this data screening criterion. Although δ11B from laboratory 6 for oxidised reference materials can be flagged as outliers, the un-oxidised mean δ11B for both reference materials of laboratory 6 agrees well within the range of δ11B reported from the majority of other laboratories.
The various mass spectrometry approaches (i.e., N-TIMS vs.
ICP-MS) did not lead to any clear isotopic shift between reportedδ11B for JCp-1 yet potentially slightly higherδ11B for JCt-1 for N-TIMS (Figures 1–3, Tables 3 and 4) (cf. Farmeret al.
2016). The choice of sample introduction system (i.e., quartz vs.
PFA spray chamber, or alternatively direct injection) and purification method for the nine MC-ICP-MS-based data sets also did not lead to resolvable differences in results (Figure 3).
18.0
14.5 17.5 17.0 16.5 16.0 15.5 15.0
(a)
JCt-1 un-oxidised JCt-1 oxidised
18.0
14.5 17.5 17.0 16.5 16.0 15.5 15.0
(b)
lab 1 lab 5 lab 9
lab 2 lab 6 lab 10
lab 3 lab 7
lab 4 lab 8
(c) (d)
16.24 ± 0.38 16.39 ± 0.60
3
1
-1
-3
-5
-7
3
1
-1
-3
-5
-7
δ
11B z -score z -score δ
11B
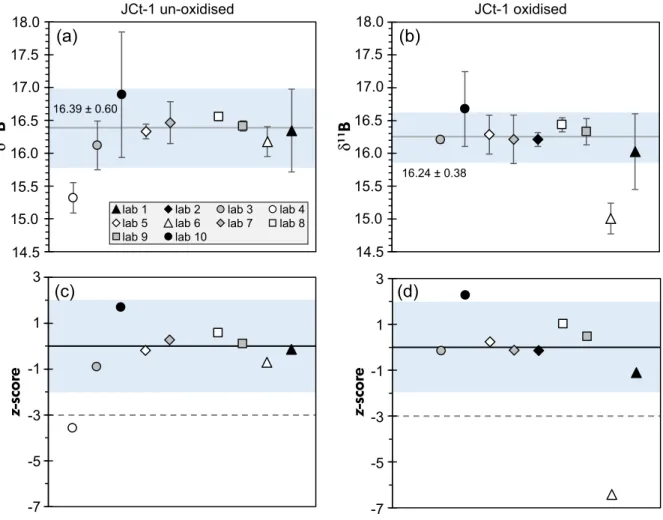
Figure 2. Boron isotope results forTridacna gigasJCt-1 reference material, presented in delta notation relative to NIST SRM 951, showing the meanδ11B for each laboratory with resultant 2s(see also Table 4) for (a) un-oxidised samples and (b) aliquots that underwent prior oxidative treatment. Shaded area corresponds to theδ11B range enclosed by the double robust standard deviation 2s*(see text for Discussion). Values for the robust mean and double robust standard deviation are equally displayed and indicated by the grey lines in (a) and (b). (c) and (d) showz-scores associated with the mean laboratoryδ1 1B values in (a) and (b), respectively. [Colour figure can be viewed at wileyonlinelibrary.com
The results after ion exchange purification or using the sublimation technique both led toδ11B withz-scores close to zero (not shown). Some laboratories reported elevated boron blank levels; however, these did not result in clearly distinct final δ11B values (not shown).
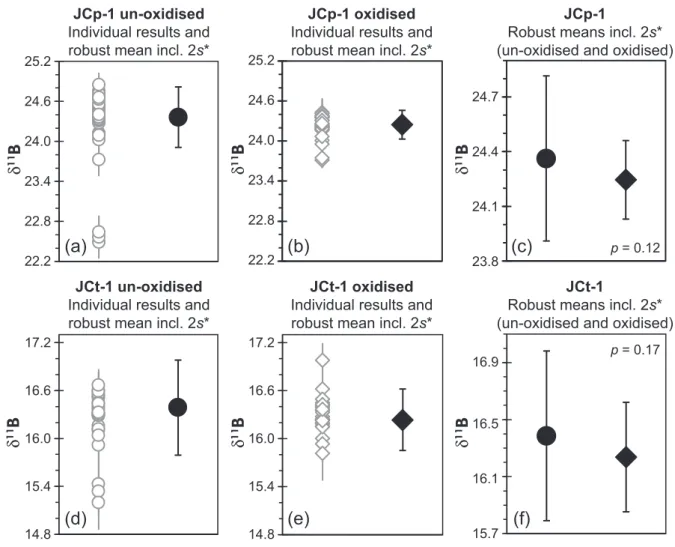
Overall, the resultant robust mean and associated robust standard deviation for un-oxidised JCp-1 is 24.360.45‰ (2s*), compared with 24.250.22‰
(2s*) for the same material subjected to oxidative cleaning (Figure 4). For un-oxidised JCt-1, respective compositions are 16.390.60‰ (2s*) and 16.240.38‰ (2s*) for oxidised material. Hence, the robust means of cleaned
and uncleaned powders are within error (for both reference material powders), but with the oxidised results only marginally lower than the un-oxidised material. A two-sided Student’s t-test comparing laboratory means screened for outliers during the robust mean and robust standard deviation assessment; see methods above) provides a p- value of 0.12 for comparison of oxidised and un-oxidised JCp-1, and 0.17 for comparison of oxidised and un-oxidised JCt-1, confirming the populations are not different at 95%
level of confidence. The difference in the mean values for the two reference materials in the respective laboratories (i.e., Δδ11B=meanδ11B(JCp-1)-meanδ11B(JCt-1)) is 7.98‰for un-oxidised and 8.01‰ for oxidised reference materials.
(a)
JCp-1 un-oxidised
(b)
(c) (d)
Offset from robust mean (‰ )
JCp-1 oxidised
Offset from robust mean (‰ ) Offset from robust mean (‰) Offset from robust mean (‰)
JCt-1 un-oxidised
JCt-1 oxidised 0.6
0.0
-0.6
-1.2
-1.8
-2.4
0.6
0.0
-0.6
-1.2
-1.8
-2.4
0.6
0.0
-0.6
-1.2
-1.8 1.2
0.6
0.0
-0.6
-1.2
-1.8 1.2
Quartz spray chamber PFA spray chamber Direct injection N-TIMS
Figure 3. Effect of sample ionisation/introduction system used, displaying results from three repeat samples per laboratory and cleaning protocol followed (cf. Tables 3 and 4 for data). Shown is the offset in measured individual δ1 1B (three results per laboratory) from the respective interlaboratory robust mean. Symbols group data produced using (i) a quartz or (ii) PFA spray chamber, (iii) direct sample injection into the plasma or (iv) thermal sample ionisation. Shaded area corresponds to theδ11B measurement precision range enclosed by the double robust standard deviation 2s*(see text for Discussion). Note that they-axis scales of panel (a) and (c) (JCp-1 un-oxidised/
oxidised), as well as those for panels (b) and (d) (JCt-1 un-oxidised/oxidised), have been matched to allow better comparison between data sets. [Colour figure can be viewed at wileyonlinelibrary.com]
This difference in reference material δ11B caused by cleaning is hence identical (within measurement precision) and suggests lack of preferential11B or10B removal for both reference materials.
In order to set the above reported robust means and robust standard deviations for JCp-1 and JCt-1 in context with alternative data handling approaches, we also report the results of two simpler statistical approaches: In the first alternative, we calculated the median of each data set (n=4) using the respective individual mean of the δ11B results of individual laboratories for each approach (un- oxidised or oxidised) and material (JCp-1 or JCt-1) (n=9 or 10). While the resultant median for each data set is either
very close or even identical to the robust mean, the resultant mean average deviation (not to be mistaken with the median average deviation, MAD) is significantly smaller than our calculated robust standard deviation 2s*. The effect is most drastic for un-oxidised JCt-1 (Table 5). Repeating this exercise in a second alternative data treatment approach, now considering every replicate result for each of the four data sets again (n=27 or 30) provides comparable median δ11B values and slightly more expanded mean average deviations. Given that these mean average devi- ations are very close to or below the reported intermediate precision (2s) of individual laboratory results (see Tables 2 and 3), these mean average deviations are deemed unrealistically small, not reflecting realisticδ11B discrepancies
(a) (b) (c)
25.2 24.6 24.0 23.4 22.8 22.2
δ
11B
JCp-1 un-oxidised Individual results and robust mean incl. 2s*
25.2 24.6 24.0 23.4 22.8 22.2
δ
11B
JCp-1 oxidised Individual results and robust mean incl. 2s*
24.7
24.4
24.1
23.8
δ
11B
JCp-1
Robust means incl. 2s*
(un-oxidised and oxidised)
p = 0.12
p = 0.17 JCt-1 un-oxidised
Individual results and robust mean incl. 2s*
JCt-1 oxidised Individual results and robust mean incl. 2s*
JCt-1
Robust means incl. 2s*
(un-oxidised and oxidised) 16.9
16.5
16.1
15.7
δ
11B
(d) (e) (f)
17.2 16.6 16.0 15.4 14.8
δ
11B
17.2 16.6 16.0 15.4 14.8
δ
11B
Figure 4. Summary of robust meanδ1 1B and robust standard deviation (2s*) of (a) un-oxidised and (b) oxidised JCp-1 next to individual data provided by all laboratories, presented in delta notation relative to NIST SRM 951. (c) Comparison of un-oxidised and oxidised robust meanδ1 1B data. (d, e, f) show the same comparisons for JCt-1. Note that panels (a) and (b) and panels (d) and (e) have the samey-axis scale for better comparability, while those for panels (c) and (f) are plotted at finer scale for the presentation of robust means including respective double robust standard deviation. Thep-value of a two-sided Student’st-test is also shown for the respective data sets in panels (c) and (f).
Table3. JCp-1referencematerialresults(un-oxidisedandoxidised) Lab IDReplicate type/ number Replicate mean δ11B 2sn(1)Amount used (mg)
Lab mean δ11B
Laboratory 2s(n=3)z- scoreOffset from robust mean Lab IDReplicate type/ number Replicate mean δ11B 2sn(1)Amount used (mg)
Lab mean δ11B
Laboratory 2s(n=3)z- scoreOffset from robust mean
Δδ11B (oxi- dised– un-oxi- dised) AUn-oxidisedA24.630.08323.7AOxidisedA23.950.22317.8 AUn-oxidisedB24.660.11318.324.710.241.550.35AOxidisedB24.070.20321.624.110.32-1.25-0.13-0.60 AUn-oxidisedC24.850.18320.3AOxidisedC24.270.12317.6 BUn-oxidisedA24.450.0439.6BOxidisedA24.180.0635.00 BUn-oxidisedB24.340.0637.224.390.120.120.03BOxidisedB24.210.1536.4024.190.03-0.51-0.05-0.20 BUn-oxidisedC24.370.0935.0BOxidisedC24.180.1437.80 CUn-oxidisedA24.120.2636.2COxidisedA24.160.2936.41 CUn-oxidisedB24.030.2636.524.090.11-1.21-0.27COxidisedB24.210.2937.2824.200.07-0.42-0.040.11 CUn-oxidisedC24.120.1536.2COxidisedC24.220.2336.40 DUn-oxidisedA22.490.133200DOxidisedAn.d. DUn-oxidisedB22.570.56320022.570.15-7.92-1.80DOxidisedBn.d. DUn-oxidisedC22.640.403200DOxidisedCn.d. EUn-oxidisedA24.280.11599EOxidisedA24.250.22597.0 EUn-oxidisedB24.320.16510224.320.08-0.18-0.04EOxidisedB24.200.18598.624.270.150.230.02-0.05 EUn-oxidisedC24.360.195103EOxidisedC24.350.07599.7 FUn-oxidisedA24.720.26450FOxidisedA23.720.24450 FUn-oxidisedB24.570.1745024.560.310.880.20FOxidisedB23.750.1445023.820.32-3.93-0.42-0.74 FUn-oxidisedC24.410.16450FOxidisedC24.010.15450 GUn-oxidisedA24.310.20210GOxidisedA24.200.20210 GUn-oxidisedB24.320.2021024.360.15-0.010.00GOxidisedB24.370.2021024.330.230.820.09-0.03 GUn-oxidisedC24.450.20210GOxidisedC24.430.20210 HUn-oxidisedA24.460.12410.2HOxidisedA24.360.02310.1 HUn-oxidisedB24.370.16411.924.460.180.420.10HOxidisedB24.410.2149.7024.380.061.290.14-0.07 HUn-oxidisedC24.550.12412.4HOxidisedC24.380.1849.55 IUn-oxidisedA24.480.11310IOxidisedA24.360.23310 IUn-oxidisedB24.460.0741024.490.070.550.13IOxidisedB24.240.1631024.300.120.520.06-0.19 IUn-oxidisedC24.530.06410IOxidisedC24.310.23310 JUn-oxidisedA24.100.27105.1JOxidisedA24.210.42102.49 JUn-oxidisedB23.730.2585.524.211.04-0.68-0.15JOxidisedB24.370.2793.3324.300.160.470.050.09 JUn-oxidisedC24.760.1996.0JOxidisedC24.310.1773.49
Table4. JCt-1referencematerialresults(un-oxidisedandoxidised) Lab IDReplicate type/ numberReplicate mean δ11B 2sn(1)Amount used (mg)
Lab mean δ11B
labora- tory2s (n=3) z- scoreoffset from robust mean Lab IDReplicate type/ number Replicate mean δ11B 2sn(1)Amount used (mg)
Lab mean δ11B
labora- tory2s (n=3) z- scoreoffset from robust mean
Δδ11B (oxidised- un-oxidised) AUn-oxidisedA16.330.12315.1AOxidisedA16.370.21317.8 AUn-oxidisedB16.040.09313.716.350.63-0.14-0.04AOxidisedB15.940.50319.016.030.58-1.10-0.21-0.32 AUn-oxidisedC16.670.09313.5AOxidisedC15.820.14318.4 BUn-oxidisedAn.d.BOxidisedA16.150.1337.60 BUn-oxidisedBn.d.BOxidisedB16.240.0537.0016.210.11-0.14-0.03 BUn-oxidisedCn.d.BOxidisedC16.250.1436.20 CUn-oxidisedA16.280.1736.50COxidisedA16.240.2936.24 CUn-oxidisedB16.160.4536.3416.120.37-0.90-0.27COxidisedB16.180.4136.2916.210.05-0.15-0.030.09 CUn-oxidisedC15.920.0636.76COxidisedC16.200.1835.80 DUn-oxidisedA15.430.253200DOxidisedAn.d. DUn-oxidisedB15.340.48320015.320.23-3.58-1.07DOxidisedBn.d. DUn-oxidisedC15.200.133200DOxidisedCn.d. EUn-oxidisedA16.290.175201EOxidisedA16.160.165198 EUn-oxidisedB16.390.04520416.330.11-0.18-0.05EOxidisedB16.250.19519916.290.300.250.05-0.05 EUn-oxidisedC16.310.055200EOxidisedC16.450.175201 FUn-oxidisedA16.110.26450FOxidisedA14.970.17450 FUn-oxidisedB16.120.2345016.180.23-0.70-0.21FOxidisedB14.910.1945015.010.23-6.41-1.23-1.17 FUn-oxidisedC16.310.18450FOxidisedC15.140.18450 GUn-oxidisedA16.600.20220GOxidisedA16.280.20220 GUn-oxidisedB16.510.2022016.470.320.270.08GOxidisedB16.360.2022016.210.37-0.12-0.02-0.25 GUn-oxidisedC16.290.20220GOxidisedC16.010.20220 HUn-oxidisedA16.530.21410.17HOxidisedA16.400.27311.2 HUn-oxidisedB16.550.29412.7816.560.060.570.17HOxidisedB16.500.23310.716.430.111.030.20-0.12 HUn-oxidisedC16.590.28412.52HOxidisedC16.410.16311.7 IUn-oxidisedA16.440.06410IOxidisedA16.330.18310 IUn-oxidisedB16.370.1241016.410.080.100.03IOxidisedB16.230.2131016.330.200.480.09-0.09 IUn-oxidisedC16.440.15310IOxidisedC16.430.28310 JUn-oxidisedA17.260.31107.17JOxidisedA16.980.21106.75 JUn-oxidisedB17.060.19106.2116.890.961.700.50JOxidisedB16.630.23108.5916.680.572.280.44-0.22 JUn-oxidisedC16.350.20105.29JOxidisedC16.420.28103.69
between individual laboratories, while the robust standard deviation better illustrates the scatter in the data sets (Figure 4). Table 5 summarises the various statistic results, and Table 6 provides a list of the laboratories that submitted data.
Discussion
Overall, the agreement inδ11B values reported here is very encouraging. Our BIIP data set demonstrates that differences between the individual laboratories taking part in this study are orders of magnitude smaller than in earlier interlaboratory comparison efforts (Gonfiantini et al. 2003, Aggarwal et al. 2009, Foster et al. 2013). The slightly expanded robust standard deviation for JCt-1 (2s* of 0.60‰ for un-oxidised vs. 0.38‰ for oxidised powders) compared with the respective robust standard deviation for JCp-1 (0.45‰, un-oxidised vs. 0.22‰for oxidised materi- als) is likely attributable to lower B/Ca in JCt-1 (~191µmol mol-1) compared with JCp-1 (~460µmol mol-1) (Hathorne et al. 2013), resulting in less favourable boron to matrix ratios. Besides the lower B content of JCt-1, several participating laboratories also reported that processing of this biogenic carbonate was not straightforward, particularly if samples were not oxidatively cleaned before elemental purification. Loading of un-oxidised JCt-1 solution onto the ion exchange columns in one laboratory even led to column blockages and resin needing to be discarded. The ionisation of un-oxidised JCt-1 equally posed significant challenges during N-TIMS measurement: since N-TIMS measures the
11BO2-/10BO2- (m/z=43 relative to m/z=42) ratio,
organic matter (CNO) is known to interfere on m/z 42 (Hemming and Hanson 1994) and therefore may explain the larger data variance in the measurement results in un- oxidised samples measured via N-TIMS.
Although detailed information on the behaviour of the two reference material powders during micro-sublimation purification is not available, results presented from the laboratory using this approach indicate slightly elevated measurement precisions for JCt-1 if no prior oxidative cleaning was performed (2sof 0.37‰ for un-oxidised vs.
0.05‰ for oxidised reference materials). The purpose of exposing carbonates to an oxidative reagent is to remove carbonate-hosted organics (Boyle and Keigwin 1985). The observation that results are more reproducible for powder aliquots that underwent oxidative cleaning suggests that inconsistent results may at least in part be caused by organics present in the coral and giant clam carbonate matrix (Cuif and Dauphin 2005, Yoshimuraet al.2014). The observed improvement could either be controlled by removal of organically bound boron with a distinct isotopic signature during oxidative treatment, leading to more reproducibleδ11B. Alternatively, since the oxidative treatment of biogenic carbonates often decreases the viscosity of the dissolved sample solution, this lowered viscosity should aid sample handling during elemental purification. Stewartet al.
(2016) reported substantially lowered B/Ca for oxidised powders of JCp-1 (cleaned B/Ca of 3252μmol mol-1 vs. uncleaned B/Ca of 4382μmol mol-1; % RSD), suggesting removal of ~26% boron during oxidative cleaning. At least some of the boron lost during oxidative Table 5.
Summary for JCp-1 and JCt-1 reference materials of intercalibration routine
δ1 1B n δ1 1B n
JCp-1 non-oxidised JCp-1 oxidised
Robust mean and corresponding 2s*
24.36 0.45 10 24.25 0.22 9
Median of laboratory averages with mean average deviation
24.37 0.31 10 24.27 0.11 9
Median of individual results with mean average deviation
24.37 0.34 30 24.22 0.12 27
JCt-1 non-oxidised JCt-1 oxidised
Robust mean and corresponding 2s*
16.39 0.60 9 16.24 0.38 9
Median of laboratory averages with mean average deviation
16.35 0.26 9 16.21 0.25 9
Median of individual results with mean average deviation
16.33 0.30 27 16.25 0.28 27