New Olivine Reference Material for In Situ Microanalysis
Valentina G. Batanova
(1, 2)*, Jay M. Thompson
(3), Leonid V. Danyushevsky
(3), Maxim V.
Portnyagin
(2, 4), Dieter Garbe-Sch€ onberg
(5), Erik Hauri
†(6), Jun-Ichi Kimura
(7), Qing Chang
(7), Ryoko Senda
(7, 8), Karsten Goemann
(9), Catherine Chauvel
(1, 10), Sylvain Campillo
(1), Dmitri A.
Ionov
(11)and Alexander V. Sobolev
(1, 2)(1) ISTerre, CNRS, IRD, IFSTTAR, University Grenoble Alpes, Grenoble, F-38000, France
(2) Vernadsky Institute of Geochemistry and Analytical Chemistry, Kosigin str 19, Moscow, 117991, Russia (3) CODES, University of Tasmania, Hobart, TAS 7001, Australia
(4) GEOMAR Helmholtz Centre for Ocean Research, Kiel, Germany (5) Institute of Geosciences, Kiel University, Kiel, Germany
(6) Department of Terrestrial Magnetism, Carnegie Institution of Washington, 5241 Broad Branch Rd NW, Washington, DC, 20015, USA (7) Japan Agency for Marine-Earth Science and Technology (JAMSTEC), Yokosuka, Japan
(8) Faculty of Social and Cultural Studies, Kyushu University, Fukuoka, Japan (9) Central Science Laboratory, University of Tasmania, Hobart, TAS 7001, Australia (10) Institut de Physique du Globe de Paris, University of Paris, CNRS, Paris, F-75005, France (11) Geosciences Montpellier, University of Montpellier, Montpellier, 34095, France
* Corresponding author. e-mail: valentina.batanova@univ-grenoble-alpes.fr
†Deceased.
A new olivine reference material–MongOL Sh11-2–forin situanalysis has been prepared from the central portion of a large (20320310 cm) mantle peridotite xenolith from a~0.5 My old basaltic breccia at Shavaryn-Tsaram, Tariat region, central Mongolia. The xenolith is a fertile mantle lherzolite with minimal signs of alteration. Approximately 10 g of 0.5–2 mm gem quality olivine fragments were separated under binocular microscope and analysed by EPMA, LA-ICP-MS, SIMS and bulk analytical methods (ID-ICP-MS for Mg and Fe, XRF, ICP-MS) for major, minor and trace elements at six institutions world-wide.
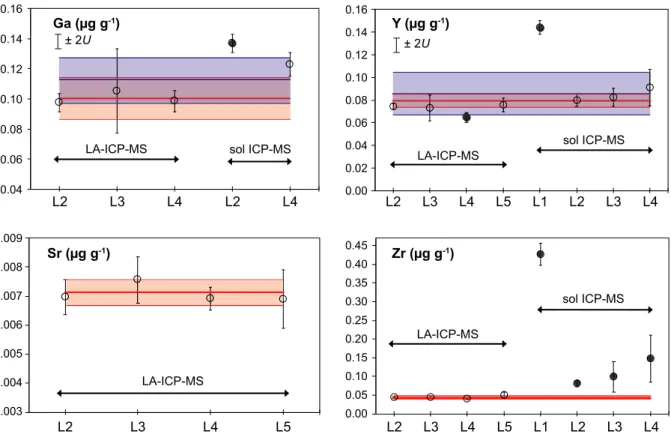
The results show that the olivine fragments are sufficiently homogeneous with respect to major (Mg, Fe, Si), minor and trace elements. Significant inhomogeneity was revealed only for phosphorus (homogeneity index of 12.4), whereas Li, Na, Al, Sc, Ti and Cr show minor inhomogeneity (homogeneity index of 1–2). The presence of some mineral and fluid-melt micro-inclusions may be responsible for the inconsistency in mass fractions obtained byin situand bulk analytical methods for Al, Cu, Sr, Zr, Ga, Dy and Ho. Here we report reference and information values for twenty-seven major, minor and trace elements.
Keywords: olivine, reference material, electron probe microanalysis, LA-ICP-MS, secondary ion mass spectrometry.
Received 19 Sep 18–Accepted 16 Mar 19
Olivine is the most abundant mineral in the upper mantle and many ultramafic rocks, and is a common mineral in basalts and as inclusions in diamond. Recent studies show that olivine is one of the main sources of petrological and geochemical information on mantle geodynamic and melting processes (e.g., Sobolev et al.
2005, 2007, De Hooget al. 2010). Especially informative are the mass fractions of Ni, Mn, Ca, Al, Cr, Co, Ti, Zn, P and Na as well as less abundant elements such as Li, Sc, V, Cu and Y (Wan et al. 2008, De Hoog et al. 2010, Mallmann and O’Neill 2013, Coogan et al. 2014). The mass fraction of these elements varies by several orders of
magnitude, from a few ng g-1to several thousandlg g-1. Electron probe microanalysis (EPMA), laser ablation-induc- tively coupled plasma-mass spectrometry (LA-ICP-MS) and secondary ion mass spectrometry (SIMS), techniques used commonly to determine olivine compositions suffer –some (EPMA) to a lesser and others (LA-ICP-MS, Sylvester 2008) to a greater degree – from so-called ‘matrix effects’. The objectives of using matrix-matched reference materials are (a) to serve as a primary calibrator for major elements to minimise matrix effects (for EPMA) and (b) to monitor the accuracy and precision of analysis. In this study, we characterise a new olivine reference material using several Vol. 43 — N° 3 0 91 9 p . 4 5 3–4 7 3
4 5 3
doi: 10.1111/ggr.12266
© ©
analytical techniques to determine major, minor and trace elements.
Sample description and preparation
Compositionally, homogeneous olivine is common in xenoliths of mantle peridotites, which are unaffected by reaction with the transporting melt (e.g., Ionov 2007). After initial screening, mantle peridotite xenolith Sh11-2 from a basaltic breccia at Shavaryn-Tsaram (48.046°N, 99.994°W), Tariat region in central Mongolia (Presset al.
1986, Ionov 2007) was selected as a suitable source for the new olivine reference material. This sample, collected by D.A.
Ionov and R.W. Carlson, is characterised by minimal alteration of pristine mantle minerals during and after its transport to the surface, sample homogeneity in terms of modal and chemical composition and microstructure, and relatively high contents of key minor and trace elements in olivine (e.g., Ca, Ni, Mn, Al, Ti, Cr). The size of the selected xenolith (20920910 cm) ensured that its inner part, which showed no evidence of contamination by the host magma, was large enough to provide a sufficient amount of large olivine grains (Figure 1a).
The xenoliths at Shavaryn-Tsaram are hosted by
~0.5 My old volcanic breccia and cinder deposits pro- duced by an explosive sub-aerial eruption. The volcanic rocks and the xenoliths at Shavaryn-Tsaram show little evidence of post-eruption alteration, due to the young age, dry climate and absence of hydrothermal activity (Ionov and Hofmann 2007, Carlson and Ionov 2019).
The inner part of the xenolith (700 g) was crushed and sieved. Around 10 g of clean olivine fragments with grain sizes of 0.5–1 and 1–2 mm were hand-picked under a binocular microscope (Figure 1b). The fragments with a grain size of 1–2 mm were leached in 2 mol l-1HCl for 2 h to remove surface contamination. Some olivine fragments were mounted in epoxy and polished for in situ
microanalysis. A preliminary electron microprobe investiga- tion of 240 polished fragments of olivine showed a fairly homogeneous composition for major (Fe, Mg, Si) and ten minor and trace elements (Na, Al, P, Ca, Ti, Cr, Mn, Co, Ni, Zn). Some micrometre-size mineral inclusions (one FeNi sulfide 60 lm in diameter, one Al spinel and several orthopyroxenes) were identified within analysed olivine fragments. Mounts with 120 fragments of polished olivine grains and four batches (0.5–1 g each) of clean olivine separates were distributed to six analytical laboratories for in situand bulk analysis (Table 1).
(a) (b)
1 cm
Figure 1. Photographs of (a) host xenolith of MongOL Sh11-2 olivine and (b) clean olivine fragments of grain size 1–2 mm. [Colour figure can be viewed at wileyonlinelibrary.com]
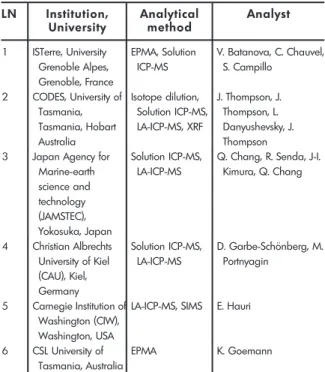
Table 1.
List of participating laboratories, methods and analysts
LN Institution, University
Analytical method
Analyst
1 ISTerre, University Grenoble Alpes, Grenoble, France
EPMA, Solution ICP-MS
V. Batanova, C. Chauvel, S. Campillo
2 CODES, University of Tasmania, Tasmania, Hobart Australia
Isotope dilution, Solution ICP-MS, LA-ICP-MS, XRF
J. Thompson, J.
Thompson, L.
Danyushevsky, J.
Thompson 3 Japan Agency for
Marine-earth science and technology (JAMSTEC), Yokosuka, Japan
Solution ICP-MS, LA-ICP-MS
Q. Chang, R. Senda, J-I.
Kimura, Q. Chang
4 Christian Albrechts University of Kiel (CAU), Kiel, Germany
Solution ICP-MS, LA-ICP-MS
D. Garbe-Sch€onberg, M.
Portnyagin
5 Carnegie Institution of Washington (CIW), Washington, USA
LA-ICP-MS, SIMS E. Hauri
6 CSL University of Tasmania, Australia
EPMA K. Goemann
LN, number of the Laboratory refers to the Institution, analytical methods and analyst(s).
Analytical techniques
Bulk techniques
Clean olivine fractions (size 0.5–2 mm) were analysed using isotope dilution (ID) ICP-MS for Fe and Mg, solution ICP-MS and X-ray fluorescence (XRF) spectrometry.
Isotope dilution by ICP-MS: Analyses were performed at CODES Analytical Laboratories, University of Tasmania.
Eight aliquots (combination of single grain and multiple grain aliquots) of whole olivine were picked and weighed on a high precision Satorius balance (d=0.001 mg). Aliquots ranged in mass from~4 to~14 mg. Several international reference materials were also weighed for isotope dilution including BIR- 1, BHVO-2 and DTS-2 (Jochumet al. 2005).
A25Mg and a57Fe isotope spike was added to each sample in a 7 ml beaker and precisely weighed on another balance (d=0.01 mg). The25Mg spike was fromInorganic Ventures and is certified against NIST SRM 3131a for the concentration: 9.952±0.058 lg ml-1 25Mg. The certified abundances of Mg isotopes (certified by Oak Ridge National Laboratories) are as follows: 24Mg: 0.00963,
25Mg: 0.98814, 26Mg: 0.00223. The total certified Mg concentration is 10.068±0.059 lg ml-1.
The57Fe spike was also fromInorganic Venturesand is certified against NIST SRM 3126a for the concentration:
9.925 ±0.062lg ml-1 57Fe. The certified abundances of Fe isotopes (certified by Oak Ridge National Laboratories) are as follows: 54Fe: 0.0022, 56Fe: 0.0734, 57Fe: 0.9244,
58Fe: <0.0005). The total certified Fe concentration is 10.721± 0.067lg ml-1.
Between 4–6 g of 25Mg spike and 0.5–2 g of 57Fe spike were added to each sample depending on mass of sample and estimated mass fractions of Mg and Fe. This was done to ensure similar sample to spike ratios in the analyses.
Olivine was digested using a HF-HNO3mixture and was heated at 110 °C, and treated ultrasonically multiple times until the solution was visibly free of any olivine grain(s). The HF-HNO3 mixture was then evaporated to dryness and refluxed several times in concentrated HNO3 to ensure sample–spike equilibration and total digestion of the sample. Each sample was diluted into 2% HNO3to a final dilution of ~35000, giving roughly 8.5lg g-1 Mg and 2.2lg g-1Fe in solution for the olivine samples.
To better constrain the concentrations of Mg and Fe in the spike solutions, reverse isotope dilution was performed using high purity Fe2O3and MgO powders from Alfa Aesar.
These were dried in an oven at 80°C for several hours, then weighed into a Teflon digestion vessel and digested in Seastar HNO3 (for the MgO) and Seastar HCl (for the Fe2O3), and gravimetrically diluted to a final volume of 250 ml. Next, an aliquot from each bottle was diluted into a 100 ml vial to give similar Fe and Mg concentrations to those expected from the olivine solutions and this was spiked with the25Mg and57Fe spike.
Samples were analysed using an Agilent 7700 ICP-MS with a collision cell and helium gas to remove polyatomic species. To avoid any potential complications with different detector modes (pulse vs. analogue counting), the isotopes of Fe and Mg were collected only in the analogue mode of ion detection, since count rates were >1 Mcps, and to avoid any issues in changing ion detection modes on the isotope ratios. Data were collected in fifteen replicates with 200 sweeps of the quadrupole per replicate and took about 4.5 min per analysis. Solutions of pure Fe and Mg were measured throughout the analysis to correct for instrument mass bias (exponential law used) and monitor drift in the isotope ratios. No instrument drift was observed for either the Mg or Fe isotope ratios.
Isotope dilution results were calculated based on the
24Mg/25Mg and 56Fe/57Fe ratios, and concentrations calculated using the reverse isotope dilution results from the Mg and Fe spike solutions. Errors were propagated from the counting statistic errors on the analyses, error on the concentrations of Mg and Fe in the spikes (from the reverse isotope dilution) and error on the fractionation factor.
Minor and trace element measurement by ICP-MS:
Measurements were performed at four laboratories: ISTerre, CODES Analytical Laboratories, JAMSTEC and CAU (Table 1). The details of the instruments, analytical conditions and reference materials’ reproducibility are summarised in Table 2 and Table S1.
- ISTerre, University Grenoble Alpes. Olivine fragments with grain size 0.5–1 mm were leached in 2 mol l-1 HCl for ~ 2 h and powdered in an agate mill. Three separate 20–30 mg aliquots were dissolved in Parr bombs. Five measurements of each dissolution were made. The details of the analytical method are given in Chauvelet al. (2011). The ICP-MS signal was calibrated relative to the BHVO-2 contents compiled in Chauvel et al. (2011); individual element mass fractions were calculated using a BHVO-2 doped in Ni and a dilution of 5000 except for Al, which was calculated using a BHVO-2 not doped in Ni and with a dilution of 20000.
Rock reference materials (BR24, BEN, UB-N and BIR-1a)
were run as unknowns during the same measurement session. Results are provided in online supporting information Table S1. Values for BEN are from Chauvel et al. (2011) and Jochumet al. (2016); values for UB-N are from Chauvelet al. (2011).
- CODES Analytical Laboratories, University of Tasma- nia. Three aliquots (two of 0.5–1 mm size and one of 1–2 mm size) weighing~40 mg each of olivine were
digested and analysed five times each. To minimise contamination, all grains were inspected under an optical microscope and only the cleanest grains without identifiable inclusions were selected for digestion. The grains were then leached in 1 mol l-1HCl for~5 min to remove any surface contamination and then rinsed in DI H2O several times. The samples were digested in HF- HNO3(2 and 1 ml, respectively) mixture on a hot plate (pre-cleaned Savillex Teflon) for 24 h at 110°C.
Table 2.
Summary of instruments, analytical conditions and reference materials used for solution ICP-MS analysis
Laboratory L1 (ISTerre) L2 (CODES) L3 (JAMSTEC) L4 (CAU)
ICP-MS instrument Thermo X Series II Agilent 7700x Q-ICP-MS, Agilent, 7500ce Agilent 7500cs
Plasma power 1400 W 1550 W 1.50 kW (27.12 MHz) 1500 W
Plasma Ar gas flow rate 13 l min-1 15 l min-1 15 l min-1 14.8 l min-1
Auxiliary Ar gas flow rate 0.79 l min-1 0.8 l min-1 0.89 l min-1 0.89 l min-1
Sample Ar gas flow rate 0.85 l min-1 N/A 1.07 l min-1 N/A
Carrier gas flow rate 0.85 l min-1 0.83 l min-1 0.76 l min-1 0.87 l min-1
Makeup gas flow rate N/A 0.35 l min-1 0.31 l min-1 0.35 l min-1
Sample cone Normal (Ni) 1 mm orifice Standard Pt cone Normal (Pt) 1 mm orifice Normal (Pt) 1.0 mm orifice Skimmer cone Normal (Ni) 0.8 mm orifice Standard Pt cone Normal (Pt) 0.8 mm orifice Normal (Pt) 0.4 mm orifice Nebuliser Peltier cooled cyclonic spray
chamber with a 400ll PFA- ST nebuliser
Scott double pass Peltier cooled Scott chamber with a 100ll PFA nebuliser
Peltier cooled (2°C) Scott chamber with a 100ll PFA nebuliser
Typical sensitivity 75 Mcps/lg g-1at115In in solution
4.1 Mcps/ng g-1 0.1 Gcps/lg g-1at115In in solution mode
0.2 Gcps/lg g-1on115In Oxide molecular 156CeO/140Ce 1.4% 156CeO/140Ce 1.9% CeO/Ce<1.5% CeO/Ce<1%
Detector mode Pulse and analogue Pulse and analogue Dual mode Pulse/analogue
Scan speed 1 s per scan 3.6 s ~1.5 s per scan Variable
Acquisition time 90 s93 250 s 100 s95 408 s (136.1 s) per scan
Dilution factor Calibration with BHVO-2 doped in Ni and a dilution of 5000 except for Al calibrated with BHVO-2, no dopping and a dilution of 20000
10009for TE, 350009for ID 20009for trace elements and 200009for major elements
800 (4009for digestion and 29for analysis)
Reference materials BHVO-2, BEN, BIR-1a, UB-N, BR24
Calibrated against custom multi-element reference solutions prepared from single element stock solutions, different manufacturers
Calibrated against multi- element reference solution from SPEX
Calibrated against custom multi-element reference solutions prepared from single element stock solutions, different manufacturers
Internal standard element Be, Ge, In, Tm, Bi Rh, In, Re In, Bi Be, In, Re
Control reference materials % Relative bias DTS-2, JP-1, BHVO-1, BIR-1 BIR-1, JP-1, JB-2 BIR-1, BHVO-2, JGb-1, % rel.
bias Monitored isotopes 7Li,23Na,27Al,31P,43Ca,
45Sc,47Ti,51V,52Cr,55Mn,
59Co,60Ni,63Cu,66Zn,
71Ga,88Sr,89Y,90Zr,163Dy,
165Ho,166Er,169Tm,172Yb,
175Lu
7Li,23Na,27Al,31P,43Ca,
44Ca,45Sc,47Ti,49Ti,51V,
52Cr,53Cr,55Mn,59Co59,
60Ni,61Ni,62Ni,63Cu,66Zn,
68Zn,71Ga,88Sr,89Y,90Zr,
157Gd,159Tb,163Dy,165Ho,
166Er,169Tm,172Yb,175Lu
23Na,27Al,43Ca,45Sc,47Ti,
51V,53Cr,55Mn,59Co,60Ni,
63Cu,66Zn,88Sr,89Y,90Zr,
91Zr,159Tb,163Dy,165Ho,
166Er,169Tm,172Yb,175Lu
7Li,23Na,27Al,31P,45Sc,49Ti,
51V,52Cr,55Mn,59Co,60Ni,
63Cu,66Zn,71Ga,88Sr,89Y,
90Zr,163Dy,165Ho,166Er,
169Tm,172Yb,175Lu
Reference values BR24 from Chauvelet al.
(2011); BEN from Chauvel et al. (2011); BEN from Jochumet al. (2016); BIR-1 from Chauvelet al. (2011) for trace elements and Jochumet al. (2016) for major elements
Jochumet al. (2005) and multiple sources for some elements
JB-2 reference values from Makishimaet al. (1999, 2002), Makishima and Nakamura (2006), others from Jochumet al. (2005)
Jochumet al. (2005) and multiple sources for some elements
Samples were then dried, and concentrated HNO3was added and evaporated to dryness several times. Sam- ples were then reconstituted in 4 mol l-1 HNO3 and diluted to give a 2% HNO3 solution and a 10009 dilution. The solutions were analysed using an Agilent 7900x instrument, with He as the collision gas, in time- resolved data acquisition mode. The primary calibration was done using a mixture of pure-element solutions and was forced through the origin with25Mg and115In used for internal calibration. The following secondary refer- ence materials were analysed in the measurement session: BIR-1, W-2, JP-1 and DTS-1 (Table S1). DTS-1 and JP-1 were digested using Parr bombs at 210°C for 24 h to fully dissolve chromite, while other reference materials were digested using same procedure as for the olivine. Olivine data were corrected to rock reference materials BIR-1, W-2 and DTS-1 (the latter only for high abundance elements), while other reference materials were treated as unknowns. Since the analysis was done using a collision cell, no correction was made for30SiH interference on 31P or for SiO interference on 45Sc (Robinson et al. 1999, Yu et al. 2000, Norman et al.
2003) since it is expected that most of the Si was lost during the initial evaporation to dryness of the HF-HNO3
for digestion. All reagents used were Seastar purity and Milli-Q DI water.
- Japan Agency for Marine-Earth Science and Tech- nology (JAMSTEC). Olivine grains were inspected under optical microscopy and only the cleanest grains lacking identifiable inclusions were picked for digestion.
The grains were then leached in 1 mol l-1HCl for~1 h to remove any surface contamination. One aliquot (0.5–
1 mm size) of the olivine was digested and measured twice. Olivine grains were weighed in a 23 ml PFA Teflon vial. After adding concentrated HClO4/HF (v/v:
25/75), the vial was capped tightly and placed on a hot plate at 130–140°C for 3 days. HClO4instead of HNO3 was used in this step, as it produces a more effective digestion of refractory minerals by improving the efficiency of the HF. The sample was then evaporated to incipient dryness to remove volatile SiF4. Concentrated HClO4was added again, and the vial was closed and placed on a hot plate at 160°C for 1 day, then opened to dry the sample at a gradually increasingly temperature of up to 190°C, to drive out excess HF and to convert fluorides into chlorides. The residue was refluxed with 2 ml 6 mol l-1HNO3,moderately heated for 2 h and then dried down at a temperature of 120°C to incipient dryness. The final sample residue was dissolved in 5 ml 2% HNO3and diluted to 2000 times for trace elements and 20000 times for major
elements prior to analyses. An Agilent 7500ce in normal nebulisation mode was used for analysis. Element standard solutions (SPEX) were used to generate calibration curves. Isobaric overlap correction factors were determined using synthetic solutions. Reference materials JP-1, JB-2 and BIR-1 (Table S1) were analysed together, and the results exhibit reasonable fits with the reference values (Chang et al. 2003, Nakamura and Chang 2007). Since45Sc was within 9.6% RD for JP-1, no isobaric overlap correction was made.
- CAU Institute of Geosciences, Kiel. Two aliquots (0.5–1 and 1–2 mm grain size) of olivine grains were weighed in triplicate within 50 mg into 15 ml PFA (perfluoralkoxy) vials. After addition of mixed concen- trated acids (HF-HNO3-HCl) samples were digested on a hot plate overnight, and the resulting digest solutions were repeatedly evaporated to dryness and finally taken up in 20 ml of 3% v/v sub-boiled nitric acid. Prior to analysis, digest solutions were diluted twofold and spiked with 2.5 ng g-1Be, In, Re for internal standard- ization. Subsequent analysis was done by ICP-MS using an Agilent 7500cs instrument in standard mode after calibration with freshly prepared multi-element stan- dards (Garbe-Sch€onberg 1993). Results were blank- subtracted means of three runs. Analytical quality was monitored with procedural blanks during both digestion and sample preparation for analysis, and three replicate measurements of one olivine digest solution were used for assessing measurement precision. Basalt reference materials BIR-1 and BHVO-2 were used as secondary reference materials (Table S1) for checking the accuracy of the calibration and applying correction factors where necessary.
X-ray fluorescence spectrometry: XRF analyses were performed at CODES Analytical Laboratories, University of Tasmania on a PANalytical Axios Advanced WDS spec- trometer using standard operating conditions. This technique was used to determine major and some minor elements.
Two lithium borate fusion discs were made from the MongOL Sh11-2 olivine, consisting of 0.2 g of olivine, 0.3 g of high purity SiO2, 4.5 g of 12/22 lithium borate flux (mixture of lithium metaborate and tetraborate) and 0.0606 g of LiNO3. Each disc was analysed fifteen times, and greater variability between discs was seen than between repeated measurements with the RSD<1% for all elements that were >0.1% oxide in mass fraction. The olivine sample was diluted with the high purity SiO2due to the limited amount of the olivine sample. This had the advantage of bringing Mg and Ni values within the range of the instrument calibrations; however, minor elements such
as Ca, Al and Co were diluted to the point where they were close to the detection level. To assess the accuracy of the method, multiple (at least two) discs of several ultramafic reference materials (JP-1, PCC-1, DTS-1, DTS-2) were prepared with the same dilution of 0.2 g sample and 0.3 g SiO2. A secondary correction was applied to the average of these ultramafic materials (from the primary calibration of the instrument) to account for: (a) the slight drift in the calibration for some elements with time and (b) any matrix effects of diluting the samples with the SiO2. In situanalytical techniques
Electron probe microanalysis: This technique was used at two laboratories to determine the mass fractions of major, minor and some trace elements, and to perform a major element homogeneity test of olivine fragments. Analyses were made on two different instruments (JEOL JXA-8230 and Cameca SX100) using different procedures for matrix correction, both laboratories used San Carlos olivine (USNM111312-44 (SCOL), Jarosewich et al. 1980) as a control reference sample (Table 3).
- ISTerre. Over 240 fragments of olivine with sizes from 0.5 to 2 mm were analysed in polished epoxy mounts using JEOL JXA-8230 electron probe using the trace element analytical method of Batanova et al. (2015)
(Table 3). Accelerating voltage and probe current were 25 kV and 900 nA. The beam diameter was 2lm. The ZAF correction procedure was applied to correct for matrix compositional effects. San Carlos olivine (USNM111312-44 (SCOL), Jarosewich et al. 1980) and ISTerre internal XEN olivine (Batanovaet al. 2015, 2018) were run as unknowns three times after every batch of 30–40 measurements, in order to monitor potential instrumental drift and to estimate accuracy and precision. Additionally, ten grains were analysed using a 595 grid with a step from 100 to 300lm.
- Central Science Laboratory, University of Tasma- nia. Analyses were performed on Cameca SX100.
Operating conditions were as follows: accelerating voltage 20 kV; beam current 30 nA; beam diameter 5lm. Calibration was performed using simple oxide reference materials (periclase for MgO, spectrosil for SiO2, Smithsonian magnetite for Fe) and the‘Probe for EPMA’software (Probe Software, Inc.) with the Armstrong- Love-cott matrix correction method.
Laser ablation-ICP-MS: Minor and trace element analyses were performed at four LA-ICP-MS laboratories (Table 1) CODES Analytical Laboratories, JAMSTEC, CAU and CIW. An overview of the instruments, measurement conditions, reference materials and approaches to
Table 3.
Summary of instruments, analytical conditions and reference materials used for electron probe microanal- ysis
Laboratory L1 (ISTerre) L6 (CSL)
EPMA instrument JEOL jxa-8230 Cameca SX100
Accelerating voltage 25 kV 20 kV
Beam current 900 nA 30 nA
Beam diameter 2lm 5lm
Matrix correction procedure/software ZAF/JEOL Armstrong/Love Scott, LINEMU MACs (Probe
Software) Measured X-ray line, spectrometer type and crystal/ Si Ka/EDS/SDD; Mg Ka/EDS/SDD; Fe Ka/EDS/
SDD; Na Ka/WDS/TAP; Al Ka/WDS/TAP; P Ka/
WDS/PETH;Ca Ka/WDS/PETH; TiKa/WDS/PETH;
Cr Ka/WDS/LIFH; Mn Ka/WDS/LIFH; Co Ka/
WDS/LIFL; Ni Ka/WDS/LIFH; Zn Ka/WDS/LIFL
Si Ka/WDS/TAP; Mg Ka/WDS/TAP; Fe Ka/WDS/
LLiF; Al Ka/WDS/TAP; Ca Ka/WDS/LPET; Mn Ka/
WDS/LPET; Ni Ka/WDS/LLiF
Peak/background total counting time (s) Si, Mg, Fe 500 (live time); Na 160/160; Al 180/
180; Ca 160/160; P180/180; Co160/160; Zn 180/180; Ti; 180/180; Ni 80/80; Mn 160/160;
Cr 90/90
Si, Mg, Fe 30/10; Al, Ca, Mn 120/120; Ni 100/80
Primary reference material Si, Mg, Fe olivine USNM111312-44a; Na/Albite;
Al/Al2O3; Ca/Wollastonite; P/Apatite Durango;
Co/CoO; Zn/ZnS; Ti/TO2; Ni/NiO; Mn/MnSiO3; Cr/Cr2O3
Si/Spectrosil; Mg/Periclase; Fe/Magnetite USNM114887a; Al/Corundum; Ca/Diopsidec; Mn/Bustamitec; Ni/Nickel silicidec
Control reference sample San Carlos olivine USNM111312-44a; XEN- internal Lab olivine ref sampleb
San Carlos olivine USNM111312-44a
aJarosewichet al. (1980),bBatanovaet al. (2015),cAstimex Standards Ltd.
Table 4.
Summary of instruments, analytical conditions and reference materials used for LA-ICP-MS analysis
Laboratory L2 (CODES) L3 (JAMSTEC) L4 (CAU) L5 (CIW)
Laser ablation system RESOlution S-155 equipped with a Coherent excimer laser
200/266 nm femtosecond laser ablation system (in- house) (OK Laboratory, OK- Fs2000K)
193 nm excimer laser ablation system GeoLas Pro (Coherentâ)
Photon Machines ArF excimer
Laser source CompexPro 193 nm laser 800 nm near infrared T- sappire one box regenerative amplifire, (Spectra Physics, Solstice)
Lambda Physics/Coherent CompexPro 102 (193 nm ArF)
ATLEX-SI 193 nm laser
Wave length (nm) 193 266 (frequency tripled by
Spectra Physics, TP-1A THG)
193 193
Pulse width ~20 ns <170 fs for 266 nm ~20 ns 4 ns
Pulse energy 100 mJ >300lJ at laser output,
>150lJ at sample surface
145 mJ at 25 kV laser output 100 mJ
Fluence on sample (J cm-2) 10 ~12 10 10
Beam diameter (lm) 70 90 90 50
Repetition rate (Hz) 10 10 10 10
Ablation mode Fixed sample position Rotation raster with initial circle diameter 15lm, raster velocity~10lm s-1
Single spot Fixed sample position
Depth of crater 150µm ~50lm n/a (300 pulses per spot) ~40µm
Acquisition mode Time resolved analysis with 30 s gas blank followed by 90 s acquisition
Time resolved analysis with 20 s gas blank, 60 s acquisition, and 80 s washout. Gas blanks: 15 s before ablation and after washout
Time resolved analysis with 20 s gas blank followed by 30 s acquisition
5 laser shots pre-ablation, 40 s washout, 25 s gas background, 25 s laser-on, 40 s washout
Carrier gas flow He, 0.35 l min-1 Ar, 1.0 l min-1 He 1.00 l min-1 Ar, 1.0 l min-1 Additional gas flow Ar, 1.05 l min-1 He, 1.2 l min-1 H214 ml min-1 He, 0.6 l min-1 Ablation cell S-155 two volume cell from
Laurin Technic
In-house laminar flow cell Z€urich LDHCLAC Two-volume cell
Smoothing device Squid from Laurin Technic In-house 17 cm3mixing chamber
None ICP-MS instrument Agilent 7900 Thermo Fisher Scientific,
ELEMENT XR. Reverse geometry high resolution sector field
Agilent 7500s quadrupole Thermo iCapQ quadrupole
Plasma power 1.35 kW 1.35 kW (27.12 MHz) 1.5 kW 3.0 W
Guard electrode N/A Off (electrically disconnected) Yes N/A
Plasma gas flow Ar, 14 l min-1 Ar, 13 l min-1 15 l min-1 Ar, 14 l min-1
Auxiliary gas flow Ar, 0.8 l min-1 Ar, 0.7 l min-1 0.85 l min-1 Ar, 0.6 l min-1
Carrier gas flow Ar, 1.05 l min-1 Ar, 1.0 l min-1 0.85 l min-1Ar Ar, 1.0 l min-1
Sample cone Pt cone Normal (Ni) Ni (1 mm) Ni cone
Skimmer cone Pt cone Normal (Ni) Ni (0.4 mm) Ni cone
Mass resolution 0.7 amu M/DM = 400 (low resolution) 0.75 M/DM = 200
Typical sensitivity 6300 cps/µg g-1for139La when scanning at 3µm s-1 with 40µm beam at 10 Hz
20000 cps/µg g-1 230Th at 50µm, 10 Hz, 8 J cm-2 (NIST SRM 612)
40000 cps/µg g-1 139La at 90µm, 10 Hz, 13 J cm-2 (NIST SRM 612)
1.5 Mcps for29Si on San Carlos olivine Oxide formation rate ThO/Th<0.2 ThO+/Th+<0.2% ThO+/Th+<0.3% ThO+/Th+<0.3%
Detector mode Pulse/analogue Triple or analogue (see text) Pulse/analogue Pulse/analogue
Scan speed 0.8 s ~2.6 s per scan 0.42 s 1.2 s
Dwell time (ms) Specified in the text 5 or 10 ms/peak, 5 peaks/
element
20 Variable by isotope
U/Th ratio (cps) on 1–1.05 on NIST SRM 612 1.05 on NIST SRM 612 1.07 on NIST SRM 612 1.05 on NIST SRM 612 Reference materials NIST SRM 612, BCR-2G, GSD-
1G
BHVO-2G GOR-128G, GOR-132G,
BM90/21G
MPI-DING, USGS, in-house CIW
Reference values GeoReM preferred values GeoReM preferred values Jochumet al. (2016) GeoReM preferred values Internal standard element Normalisation to 100% Normalisation to 100% Mg, Si 29Si
Control reference materials BCR-2G, GSD-1G BCR-2G GOR-128G, GOR-132G,
BM90/21G
San Carlos 111312-42
quantification is presented in Table 4. Three laboratories used 193-nm Excimer lasers and one used 266-nm femtosecond laser operated at 10 Hz. The same 120 olivine fragments were analysed in each laboratory.
- CODES Analytical Laboratories. The laser micro- probe was a RESOlution S-155 instrument equipped with a coherent 193 nm excimer laser of 20 ns pulse width. Ablation was performed at a fluence of 10 J cm-2, with a 70lm beam at 10 Hz. A 90 s ablation was preceded by a 30 s gas blank. A pre-ablation of five laser pulses was done prior to each analysis, and a 20 s wash- out between analyses was used. An Agilent 7900 ICP-MS was coupled to the laser and tuned for ThO/Th<0.2 and U/Th of 1–1.05 using a line ablation of the NIST SRM 612 glass. The dwell times ranged from 5 to 20 ms depending on expected abundance of isotopes in olivine giving a total sweep time of 0.67 s. Gas flows were 0.35 l min-1 He through the ablation cell, which was mixed with Ar flowing at 1.05 l min-1immediately after the ablation. The signal from the ablation cell was smoothed using the
‘squid’ signal-smoothing device (M€uller et al. 2009).
Calibration was performed on NIST SRM 612 for all elements except Fe and P, for which BCR-2G was used.
25Mg was used as the internal standard element.
Calibration reference materials were analysed twice after every ten analyses of the unknowns, using the same conditions as the unknowns. Data reduction was done using an in-house macro-based Excel workbook. Matrix effects were assessed and corrected by analysing BCR- 2G and GSD-1G as secondary reference materials under
the same conditions as the unknowns, after every ten analyses of the unknowns. All mass fractions for NIST SRM 612, BCR-2G and GSD-1G were taken from the GeoReM preferred values. Quantification was performed using conventional approaches (Longerichet al. 1996), with normalisation to 100% total of oxide components. A correction was applied for the 30Si1H and 29Si16O interference on31P and45Sc, respectively, by analysis of high purity Spectrosil silica glass analysed throughout measurement sessions. The correction was~0.7% and~ 2.2% for31P and45Sc, respectively. Total uncertainty of the reported mass fractions includes uncertainties of correc- tion for instrumental drift during the session, matrix correction and the published values for secondary reference materials.
- JAMSTEC. A 266-nm wavelength, <170 fs pulse width, 12 J cm-2 fluence laser pulse at 10 Hz was applied using an OK-Fs2000K laser ablation system (OK Lab, Tokyo, Japan) equipped with a Solstice one- box Ti: Sapphire 800-nm fs regenerative amplifier with TP-1A THG frequency tripling harmonic generator (Spectra-Physics, Santa Clara, CA, USA). The beam diameter was set at 90lm and a circular raster protocol (15lm radius, 10lm s-1raster velocity) was performed using a high precision sample translation stage to obtain a flat-bottomed crater of ~100lm diameter and 50lm depth after 60 s of ablation. An Element XR sector field ICP-MS (Thermo Fisher Scientific, Bremen, Germany) was modified by an additional high-efficiency interface vacuum pump and operated with N-sampler Table 4 (continued).
Summary of instruments, analytical conditions and reference materials used for LA-ICP-MS analysis
Laboratory L2 (CODES) L3 (JAMSTEC) L4 (CAU) L5 (CIW)
Monitored isotopes 7Li,23Na,27Al,31P,43Ca,
45Sc,49Ti,51V,53Cr,55Mn,
59Co,62Ni,63Cu,66Zn,
71Ga,88Sr,89Y,90Zr,163Dy,
166Er,172Yb
49Ti,27Al,55Mn,42Ca,23Na,
31P,45Sc,51V,53Cr,59Co,
60Ni,63Cu,66Zn,71Ga,88Sr,
89Y,90Zr,163Dy,165Ho,
166Er,169Tm,172Yb,175Lu
7Li,23Na,27Al,31P,43Ca,
45Sc,49Ti,51V,52Cr,55Mn,
59Co,60Ni,63Cu,67Zn,
71Ga,88Sr,89Y,90Zr,163Dy,
166Er,172Yb
7Li,23Na,27Al,31P,43Ca,45Sc,
49Ti,51V,53Cr,55Mn,59Co,
60Ni,63Cu,67Zn,71Ga,88Sr,
89Y,90Zr Interference correction
45Sc (29Si16O) Mass 45 measured on Spec- pure silica glass and extracted from the samples
No correction 29Si16O/29Si = 0.035– 0.065% (n= 14) was measured on synthetic nominally Sc free quartz and interpolated for other samples
Synthetic forsterite with of 0.07µg g-1Sc obtained by SIMS, used to determine SiO/
Si ratio used for interference correction
67Zn No correction (66Zn) No correction (66Zn) Calculated as a function of Al2O3based on RM measured
31P Mass 31 measured on Spec-
pure silica glass and interference subtracted from the samples
H-skimmer cones and guard electrode (GE) discon- nected to obtain low oxide ThO+/Th+ <0.2% and U/Th= ~1.05 values. The laser aerosol carrier gas was He (at 1.2 l min-1), which was mixed with Ar sample gas (at 1.0 l min-1) in a mixing chamber (70 cm3 inner volume) prior to the ICP torch. Analyses were performed in time-resolved mode with 20 s for gas blank, 60 s of LA signal acquisition and 80 s washout using gas blanks 15 s before ablation and after washout. Mass scan speed was~2.6 s per cycle and acquisition was made in low-resolution mode (M/DM=400) using a dual- mode ion counter for both major and trace elements.
The reference material used was the USGS basaltic glass BHVO-2G for all the elements and was analysed before and after each five unknowns for calibration and drift correction. Laser ablation efficiency was corrected using total-100% normalisation using major oxides. The details of the interference corrections are in Table 4.
Reference material glass BCR-2G was monitored for repeatability and reproducibility tests (Kimura and Chang 2012).
- CAU. Analyses were performed with an Agilent 7500s quadrupole mass-spectrometer coupled to a 193 nm excimer laser ablation system (GeoLas Pro;
Coherent, G€ottingen, Deutschland) using a 90lm laser spot, a pulse frequency of 10 Hz and laser fluence of 10 J cm-2. All analyses were performed in a large volume‘Z€urich’ablation cell. The carrier gas was He (~
1.05 l min-1) with addition of H2 (14 ml min-1), which were mixed with Ar (0.85 l min-1) before introduction into the mass spectrometer. Oxide production rate, estimated as [ThO]+/[Th]+, was <0.3%. Analyses were performed in time-resolved mode and included 20 s background measurement followed by 20 s sample ablation and signal measurement. Dwell time was 20 ms for all elements. Scan speed was 0.68 s per cycle. All spectra were processed with GLITTER software.
Mass fractions were quantified from the measured ion yields normalised to25Mg,29Si,57Fe and Mg, Si and Fe mass fractions from EPMA microprobe data. The data obtained using different reference elements were aver- aged. Analyses of MPI-DING reference glass KL2-G as well as one of glasses GOR-128G, GOR-132G and BM90/21G were performed every twenty olivine anal- yses and used for calibration and drift correction (Jochum et al. 2005, 2006). Isobaric interference of
29Si16O on45Sc was monitored and corrected by using data from Sc-free synthetic optical-grade quartz, which was measured together with reference glasses every twenty analyses. The details for the interference correc- tions are in Table 4. Typical Si oxide production rate on
mass 45 was 0.035–0.065% (n=14). In the absence of Al-free reference samples, Zn mass fractions were quantified from the calibration using Al-bearing refer- ence glasses corrected for the interference of 67Zn with
27Al40Ar. Matrix correction was applied for Al and Ca mass fractions based on analyses of an in-house (reference) pressed nanopowder of San Carlos olivine characterised previously by ICP-MS and EPMA.
- CIW. A Photon Machines 193 nm ArF excimer laser was coupled to a Thermo iCapQ quadrupole mass spectrometer. Analytical conditions were as follows: 7 mJ laser energy; 10 J cm-2fluence; 50 lm diameter laser beam; 10 Hz repetition rate. Each analysis involved five laser shots pre-ablation followed by a wash-out of 40 s, 25 s of data acquisition of gas background (laser off)
Analytical uncertainty (%) Analytical uncertainty (%)
% RSD (mean of 120)% RSD (mean of 120)
LA-ICP-MS
LA-ICP-MS
0 5 10 15 20
20 18 16 14 12 10 8 6 4 2 0
0 0.5 1.0 1.5 2.0 2.5 3.0
(b) (a)
0 0.5 1.0 1.5 2.0 2.5 3.0
1:1
1:1 3:1
(b)
3:1 2:1
P
Sr Dy Er Yb Zr Ga Y
Ti
Cu
Ni Ca Zn V
Mn Co Na
Cr Sc Li Al
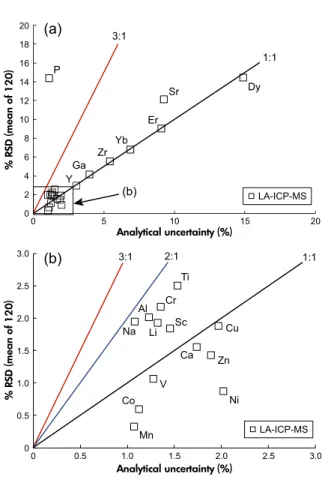
Figure 2. Assessment of homogeneity of olivine Mon- gOL Sh11-2 on the basis of LA-ICP-MS analyses of 120 individual olivine fragments. Values of homogeneity index of 1 (black lines), 2 (blue line) and 3 (red lines) are shown. (a) The full range of values; note that P is the only element showing substantial heterogeneity.
(b) Elements with % RSD values<3%. See text for details.
and 25 s data acquisition during ablation (laser on). The details of interference corrections are in Table 4. Cali- bration reference materials included MPI-DING and USGS glasses (Jochum et al. 2005, 2006). The San Carlos olivine (USNM111312-44; Jarosewich et al.
1980) was used as a secondary reference material to correct for instrumental drift, and to perform secondary reference material corrections using the observed differ- ences between the measured and accepted values.
Secondary ionisation mass spectrometry: Analyses were performed at CIW on a Cameca IMS 6F ion microprobe using energy filtering techniques (Shimizu and Hart 1982). The primary O- ion beam had a current of 15 nA; the crater diameter was 30lm. A field aperture was applied to mask surface contamination. A mass resolution power of 3500 was sufficient to resolve29SiO from45Sc, but not enough to resolve Ca dimers from 88Sr,89Y and 90Zr.
The elements were determined using the ratio of their chosen isotope to30Si. Each measurement was preceded by 5 min of pre-sputtering. The masses measured were as follows:7Li,
9Be,11B,23Na,26Mg,27Al,31P,43Ca,45Sc,47Ti,51V,52Cr,
55Mn,57Fe,59Co, 60Ni,63Cu, 88Sr, 89Y and 90Zr. Interfer- ences of Ca dimer (Ca2+) on Sr, Y and Zr were not resolved.
Calibration reference materials included MPI-DING and USGS glasses (Jochumet al. 2005, 2006). The San Carlos olivine (USNM111312-44; Jarosewich et al. 1980) was used as a secondary reference material to correct for instrumental drift.
Assessment of the homogeneity of olivine fragments
Chemical homogeneity can be defined as variation in element mass fraction, which does not exceed the mea- surement uncertainty of the analytical method (e.g., Boyd et al. 1967, Jarosewich et al. 1980, Potts et al. 1983, Jochumet al. 2000, Gilbertet al. 2013, Harries 2014). As suggested by the key international guide for the character- isation of reference materials (ISO Guide 35:2017), to examine homogeneity of olivine fragments in major ele- ments (Si, Mg, Fe), the F-test for comparison of two population variances was applied. The three sets of EPMA measurements of MongOl Sh11-2 (each containing 36–95 separate fragments) were compared with repeated mea- surements (9–24) of single fragments of the San Carlos olivine USNM111312-44 (Jarosewich et al. 1980) that were run together with each set. The results of the F-test indicated that the standard deviations of all three popula- tions of the different fragments of MongOl Sh11-2 are equal at the 95% confidence level to the standard deviations of the population of analyses of a single fragment of San Carlos olivine USNM111312-44 for all major elements (Table S2).
Additionally, in this study we used the homogeneity index (H) to assess homogeneity of minor and trace elements. H represents the ratio of the measurement uncertainty to the expected value of the total combined uncertainty (e.g., Boydet al. 1967, Harries 2014, Pankhurst et al. 2017). A value of 1 for the index implies that the sample is homogeneous within the analytical uncertainty of individual measurements. A value>3 for the index indicates significant chemical heterogeneity (e.g., Boyd et al. 1967, Jarosewich et al. 1980, Potts et al. 1983, Harries 2014, Pankhurstet al. 2017). TheHvalue can be considered as a particular case of anF-test when the degree of freedom of each population approaches infinity (Harries 2014).
The assessment of homogeneity for minor and trace element was made using LA-ICP-MS data on 120 individual grains obtained at CODES Analytical Laboratories (Fig- ure 2). The average within-run analytical uncertainty of individual measurements includes the uncertainties of the signal on the sample and reference materials, matrix correction and uncertainty related to the instrument drift during the session (e.g., Gilbertet al. 2013).
The observed variations in the uncertainty of individual analyses are due primarily to differences in element mass fractions (lower mass fractions result in higher signal noise) and isotopic abundance. Only phosphorus showed signif- icant heterogeneity with a homogeneity index of 12.
Table 5.
Major element measurement results Mass
fraction (%m/m)
2s 2 RSD (%) Method LN
SiO2
40.79 0.27 0.66 EPMA L 1
40.47 0.34 0.83 EPMA L 6
40.96 0.21 0.52 XRF L 2
MgO
48.85 0.28 0.65 EPMA L 1
48.68 0.42 0.86 EPMA L 6
48.78 0.27 0.54 Isotope
dilution L 2
48.83 0.19 0.39 XRF L 2
FeO
10.16 0.07 0.68 EPMA L 1
10.20 0.09 0.87 EPMA L 6
10.17 0.09 0.87 Isotope
dilution L 2
10.16 0.04 0.42 XRF L 2