The SPARC Data Initiative:
Assessment of stratospheric trace gas and aerosol climatologies from satellite limb sounders
March 2017
Prepared by the SPARC Data Initiative Team, edited by M. I. Hegglin and S. Tegtmeier
SPARC Report No. 8, WCRP-05/2017
sounders. M. I. Hegglin and S. Tegtmeier (Eds.), SPARC Report No. 8, WCRP-05/2017, DOI 10.3929/ethz-a-010863911, available at www.sparc-climate.org/publications/sparc-reports/.
Electronic version available at http://www.sparc-climate.org/publications/sparc-reports/sparc-report-no8/
ISSN 2296-5785 (Print)
Editing, Design, and Layout: Petra Bratfisch, Carolin Arndt and Diane Pendlebury
Authors & Reviewers
Michaela I. Hegglin University of Reading United Kingdom
Susann Tegtmeier GEOMAR Helmholtz Centre for Ocean Research Kiel Germany Lead Authors / Editors / Co-leads of the SPARC Data Initiative
John Anderson Hampton University USA
Adam Bourassa University of Saskatchewan Canada
Samuel Brohede Chalmers University of Technology Sweden
Doug Degenstein University of Saskatchewan Canada
Lucien Froidevaux Jet Propulsion Laboratory, California Institute of Technology USA
Bernd Funke Instituto de Astrofísica de Andalucía, CSIC Spain
John Gille University of Colorado and NCAR USA
Ashley Jones University of Toronto Canada
Yasuko Kasai NICT Japan
Erkki Kyrölä Finnish Meteorological Institute Finland
Jerry Lumpe Computational Physics, Inc. USA
Jessica Neu Jet Propulsion Laboratory, California Institute of Technology USA
Ellis Remsberg NASA Langley Research Center USA
Alexei Rozanov University of Bremen Germany
Matthew Toohey GEOMAR Helmholtz Centre for Ocean Research Kiel Germany
Joachim Urban Deceased/Chalmers University of Technology Sweden
Thomas von Clarmann Karlsruhe Institute of Technology Germany
Kaley A. Walker University of Toronto Canada
Ray Wang Georgia Institute of Technology USA
Authors
Contributing Authors
Gregory Bodeker Bodeker Scientific New Zealand
Juan A. Añel Cabanelas Universidade de Vigo Spain
Florian Ernst University of Bremen Germany
Ryan Fuller Jet Propulsion Laboratory, California Institute of Technology USA
Chris McLinden Environment Canada Canada
Gretchen Lingenfelser NASA Langley Research Center USA
Bruno Nardi NCAR USA
Diane Pendlebury University of Toronto Canada
Charles Robert BIRA Belgium
Chris Roth University of Saskatchewan Canada
Christian von Savigny University of Bremen Germany
Lesley Smith University of Colorado USA
Katja Weigel University of Bremen Germany
Reviewers
Peter Braesike Karlsruhe Institute of Technology Germany
Veronika Eyring DLR Germany
Jens-Uwe Grooß Research Centre Juelich Germany
Neil Harris University of Cambridge United Kingdom
Gloria L. Manney NorthWest Research Associates (NWRA) and NMT USA
Chris McLinden Environment and Climate Change Canada Canada
Gerald Nedoluha Naval Research Laboratory USA
Mijeong Park NCAR USA
William Randel NCAR USA
Karen Rosenlof NOAA USA
Michelle Santee Jet Propulsion Laboratory, California Institute of Technology USA
Robyn Schofield University of Melbourne Australia
Ted Shepherd University of Reading United Kingdom
Johannes Staehelin ETH Zurich Switzerland
Susan Strahan NASA Goddard Research Center USA
Kimberly Strong University of Toronto Canada
Michel Van Roozendael BIRA Belgium
Mark Weber University of Bremen Germany
Acknowledgements While the SPARC Data Initiative has been driven from a
user perspective, the measurement partners have been critical to its success. These partners to whom the SPARC Data Initiative extends its thanks include the relevant instrument teams, the various space agencies (CSA, ESA, NASA, JAXA, SNSB, and other national agencies), and organisations such as CEOS-ACC and IGACO. The SPARC Data Initiative particularly thanks the International Space Science Institute in Bern (ISSI) who supported the activity through their ISSI International Team activity program and facilitated two successful team meetings in Bern. The SPARC Data Initiative also extends its thanks to the World Climate Research Programme (WCRP) and the Toronto SPARC office (sponsored by the CSA and the Canadian Foundation for Climate and Atmospheric Sciences (CFCAS) pogramme) for providing generous travel support for team and review meetings. The Zurich SPARC Office (through ETH Zurich) covered the costs of publication and dissemination, including support for the editing and layout
of the report by Petra Bratfisch and Carolin Arndt. The Toronto SPARC Office (through CSA) supported the work on editing and layout of the report by Diane Pendlebury.
Finally, Michaela I. Hegglin thanks the CSA and ESA for supporting her work within the SPARC Data Initiative through the CSA SSEP (9SCIGRA-29) and ESA STSE- SPIN (4000105291/12/I-NB) programmes, respectively.
The work from Susann Tegtmeier was funded from the WGL project TransBrom and the EU project SHIVA (FP7-ENV-2007-1-226224). Work at the Jet Propulsion Laboratory, California Institute of Technology, was funded by NASA. Development of the ACE-FTS climatologies was supported by grants from the CFCAS and the CSA. Work at Instituto de Astrofísica de Andalucía, CSIC, was supported by the Spanish MCINN under grant ESP2014-54362-P and EC FEDER funds. Development of the SCIAMACHY climatologies was funded in part by the German Aerospace Agency, ESA, and by the University and State of Bremen.
In Memory of Joachim Urban
2 December 1964 - 14 August 2014
vii
PrefaceThe past 30 years have been a ‘golden age’ for vertically resolved satellite measurements and provided a wealth of knowledge regarding atmospheric constituents in the stratosphere. Datasets of chemical trace gases and aerosol are widely used for empirical studies of stratospheric climate, trends and variability, for process studies and for the evaluation of the representation of transport and chemistry in numerical models. The datasets available from the different satellite instruments vary in terms of measurement method, geographical coverage, spatial and temporal sampling and resolution, time period, and retrieval algorithm. Basic information on the availability, quality and consistency of the datasets is required for all scientific applications of the data, and in particular to evaluate Chemistry-Climate Models or to merge datasets from various sources into homogeneous data records suitable for trend studies. However, as pointed out by the SPARC Chemistry-Climate Model Validation (CCMVal) report [SPARC, 2010], knowledge on the availability and quality of satellite observations needed for meaningful model-measurement comparison exercises is not always readily available.
The Stratosphere-troposphere Processes And their Role in Climate (SPARC) core project of the World Climate Research Programme (WCRP) initiated the SPARC Data Initiative in 2009 with the mandate to coordinate an assessment of available, vertically resolved chemical trace gas and aerosol observations obtained from a multi-national suite of space- based satellite instruments. The SPARC Data Initiative assessed, in a first step, the current availability of such past and present vertically resolved, chemical trace gas and aerosol datasets. In a second step, chemical trace gas and aerosol monthly zonal mean time series were compiled in a common and simple-to-use data format. The focus thereby lay on the trace gas and aerosol products that were considered relatively mature, neglecting some of the research products available for minor trace gas species. It is also important to note that not all measurements of satellite instruments available could be included in the report due to the lack of resources to produce the monthly zonal mean climatologies. The monthly zonal mean time series of the observations are provided to the end user via the SPARC Data Center (http://www.sparc-climate.
org/data-center/data-access/sparc-data-initiative/). In a third step, climatologies derived from the monthly zonal mean time series underwent detailed comparisons, which identified strengths and shortcomings of all datasets and differences between them.
The detailed comparisons of the chemical trace gas and aerosol climatologies are presented in the SPARC Data Initiative report. Basic information on quality and consistency of the various data products is provided. Differences between the climatologies and unphysical behaviour of individual datasets are identified and, where possible, an expert judgment on the source of those differences is given. In the report presented here the spread in the climatologies is used to provide an estimate of the overall systematic uncertainty in our knowledge of the true atmospheric state. Such an assessment of the relative uncertainty in the mean trace gas fields yields information on how well we know the global annual mean distribution of each gas and will help to identify regions where more detailed evaluations or more data are needed. The report provides recommendations for model-measurement inter- comparisons and points out particular diagnostics that would be especially appropriate for model evaluations. Additionally, the different instrument techniques and retrieval procedures are documented. The evaluations do not include trend studies or assess instrument drifts but provide valuable information to activities focused on characterizing long-term changes and data merging efforts. Note that the SPARC Data Initiative does currently not provide a merged dataset of the individual instruments’ monthly zonal mean time series.
The report is targeted at various kinds of data users, including (1) scientists seeking an introduction into and overview of available stratospheric satellite datasets and their quality, (2) data analysts aiming at data merging exercises and trend evaluations, and (3) scientists working with Chemistry- Climate Models aiming at model-measurement comparisons.
The report also aims at providing guidance and feedback to space agencies about required improvements in existing datasets and the need for future observations.
The objective of the SPARC Data Initiative report is an assessment of the atmospheric trace gas climatologies based on data versions available at the time. These data versions are (especially for the more recent satellite instruments) undergoing revisions regularly in order to account for known shortcomings in the instrument retrievals, so some of the findings in this report may become obsolete when moving to newer data versions (although the main characteristics of an instrument are not expected to change substantially). In fact, the SPARC Data Initiative’s comparison results have already triggered major revisions of some of the datasets which are now included in their revised form. The SPARC Data Initiative climatologies will be updated with newer data versions as soon as they become available, and information on the changes in the data versions will be provided as appropriate in the future.
While the SPARC Data Initiative report presented here focuses
Executive summary
on vertically resolved global satellite measurements, other important but temporally and spatially limited observations from aircraft missions, ground-based stations, or balloons also exist that would be of great value for future comparisons.
The report was prepared by the scientists of the SPARC Data Initiative Team with contributions from a number of internationally recognised instrument experts and data analysts, and underwent several rounds of extensive peer review and revisions. This Executive Summary outlines the overall approach as well as the key findings and recommendations obtained from the evaluations in this report.
Overall approach
The SPARC Data Initiative has performed the up-to-date most comprehensive comparison of satellite instrument observations obtained from the CSA, ESA, JAXA, NASA, SNSB and other national agencies. In particular, it is the first systematic comparison between the older and younger generation, and the North American and European satellite instruments.
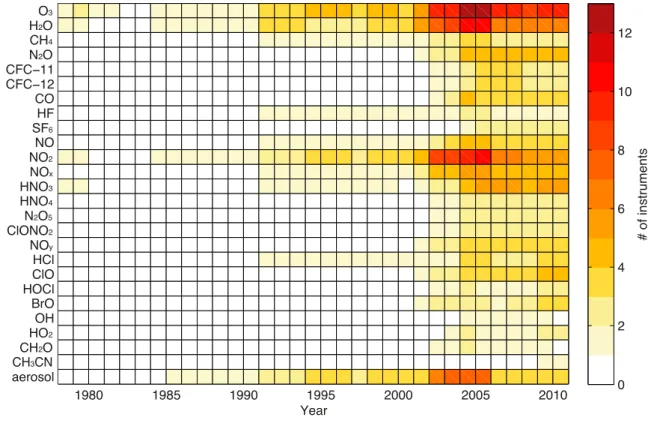
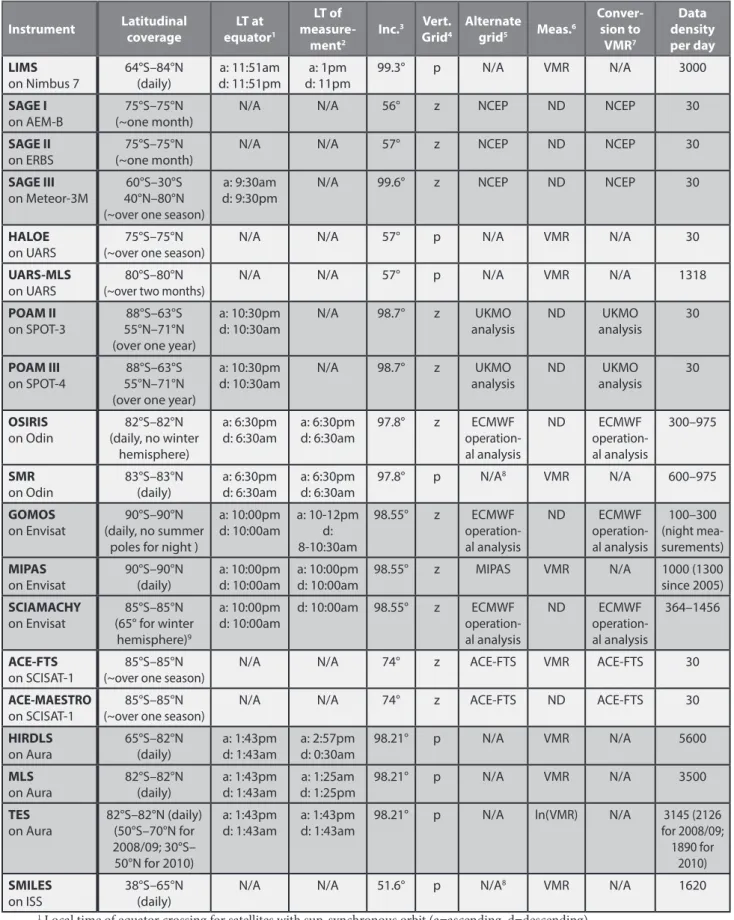
The SPARC Data Initiative provides the most comprehensive set of monthly zonal mean time series of vertically resolved atmospheric trace gases and aerosol on a predefined latitude-pressure grid and in a common format easily useable by the atmospheric science community. The time series are available from the SPARC Data Center and will be updated in the future as soon as new data versions become available. The data products include 25 different chemical trace gases and aerosol from 18 different satellite limb sounders (see Table ES.1).
The trace gas and aerosol time series have been evalua- ted by a common approach, comparing (single- or multi- year) annual or monthly climatologies derived from
SPARC Data
Initiative O3 HO 2 CH4 NO 2 CClF 3 CClF22
CO HF SF6 NO NO2 NOx HNO3 HNO4 NO25 ClONO2 NOy
HCl ClO HOCl BrO OH HO
2 CH2O
ACE-FTS x x x x x x x x x x x x x x x x x x x Aura-MLS x x x x x x x x x x GOMOS x x x HALOE x x x x x x x x HIRDLS x x x x x LIMS x x x x
MAESTRO x
MIPAS x x x x x x x x x x x x x x x x x x x OSIRIS x x xd xm x x POAM II x x x POAM III x x x x SAGE I x SAGE II x x x x SAGE III x x x x SCIAMACHY x x x xd x x SMILES x x x x x x Odin/SMR x x x x x x xm x xlc UARS-MLS x x x TES xt
x available climatology xt used in UTLS comparisons only
xd derived with help of a chemical box model
xm merged and derived from OSIRIS NO and Odin/SMR HNO data xlc with limited coverage
aerosol CH3CN
x
2 3
x x
the monthly zonal mean fields, allowing for maximum overlap between different instruments. The comparison results do not change substantially when changing the number of years going into a climatology or, in case of the longer-lived species, when calculating instrument differences for a month instead of a year. From this, it follows that the comparisons shown yield relatively robust conclusions on instrument/retrieval performance.
By evaluating monthly zonal mean averages, we take a
‘climatological’ approach to data validation in contrast to the more common approach of using coincident profile measurements. The climatological validation method has the advantages that it is consistent for all instrument comparisons, avoids sensitivity to chosen limits defining coincident measurements, and produces generally larger sample sizes, which should in theory minimise the random sampling error. The climatological approach, however, has the disadvantage that climatological means may be biased due to non-uniformity of sampling.
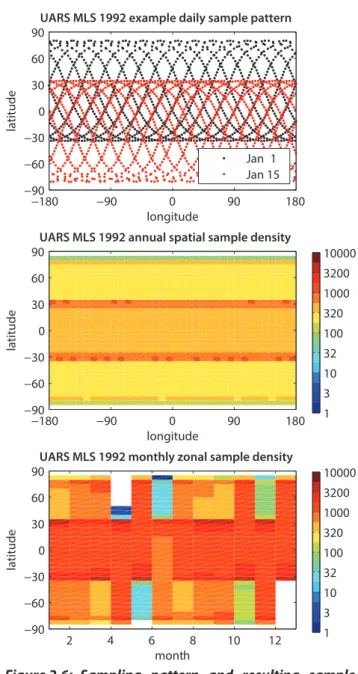
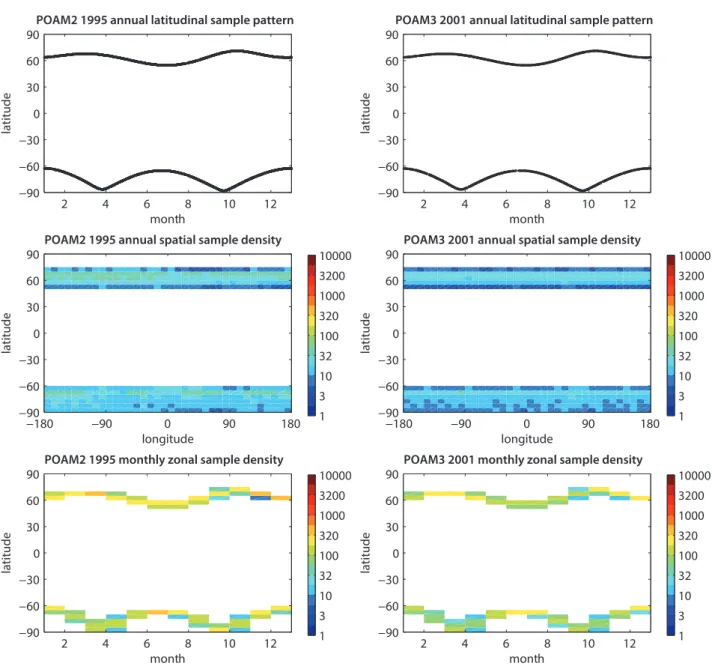
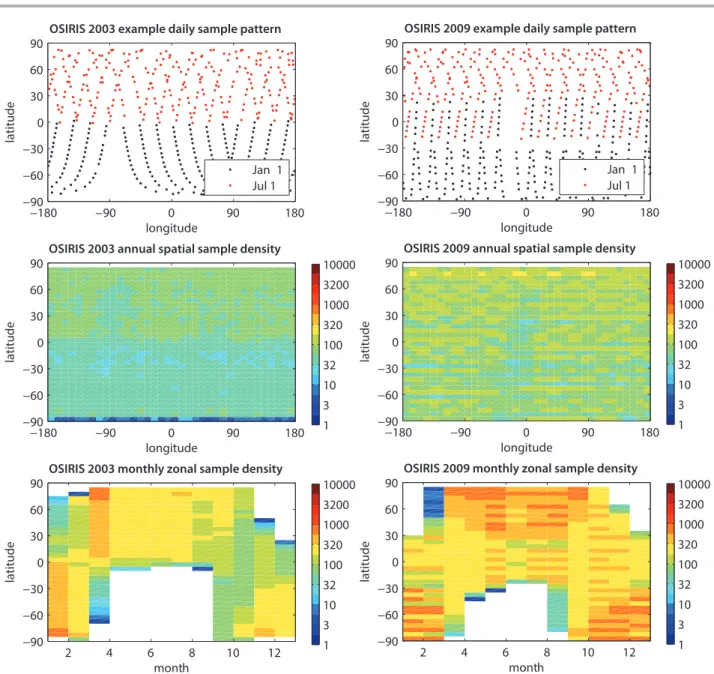
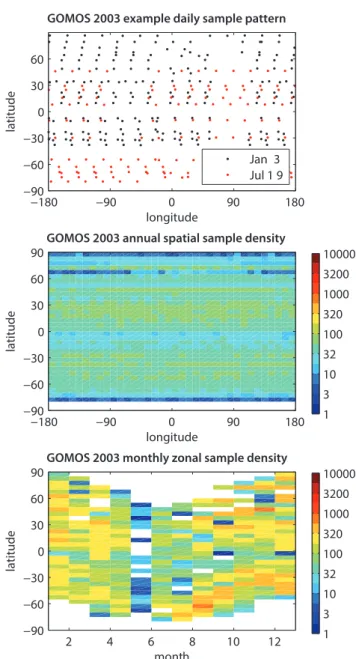
The extent to which the monthly and annual zonal mean climatologies are representative of the true mean has therefore been evaluated by investigating the impact of each instrument’s sampling patterns on the climatologies. This yields information on the potential sampling bias of each instrument’s climatology and is particularly useful to users examining variability and trends, or comparisons with free-running models.
Evaluations focus on different regions, the upper troposphere (UT, from 300 hPa to the tropopause), the lower stratosphere (LS, from the tropopause to 30 hPa), the middle stratosphere (MS, 30-5 hPa), the upper stratosphere (US, 5-1 hPa), and the lower mesosphere (LM, 1-0.1 hPa), illustrating where the various data products are consistent and where they are not. Data products exhibiting unphysical features or strong deviations from the other instruments are highlighted in the report.
Table ES.1: Atmospheric constituent cli- matologies available from the SPARC Data Initiative archive, listed by instrument. Blue indicates the participating limb sounders, grey the nadir sounder Aura-TES, which was included for a comparison of ozone in the upper troposphere and lower stratosphere (UTLS).
In the SPARC Data Initiative report, the term climatology is not used to refer to a time-averaged climate state (which should be reproduced by free- running models, averaged over many years) but to refer to year-by-year values (which free-running models would not be expected to match). Based on different satellite instruments measuring in the same year (or over identical longer time periods), the spread in those measurements is regarded as representing the systematic uncertainty of our knowledge of the true atmospheric state in any given year (or over this period).
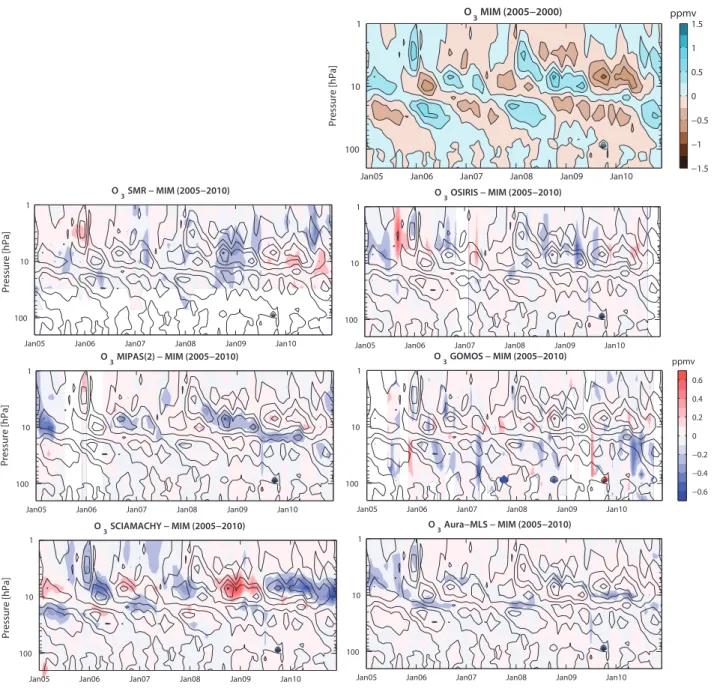
The SPARC Data Initiative evaluations are based on the use of the multi-instrument mean (MIM) as a common point of reference (see Box 1 in the Introduction). It must be emphasised that the MIM is not considered to provide a best estimate since it is impacted, among other things, by changes of the composition of instruments over time and unphysical behaviour of individual instruments.
The MIM is not a data product and will not be provided.
Overall key findings
The findings of the trace gas climatology intercomparison for both, short-lived and long-lived species, are generally consistent with the results of previous validation efforts (where available) based on the classical validation
approach using profile coincidences. However, the uncertainty of the climatological mean values (as given by the standard error of the mean) is generally smaller than that of a single profile or a set of coincident profiles, yielding statistically more significant results on the differences or agreement between the instruments.
In addition, the climatological approach yields more comprehensive information on measurement uncertainty in terms of latitude-pressure range covered.
The comparisons of the climatologies thereby have in many cases improved our knowledge of the quality of the available data products.
A large number of limb-viewing satellite instruments have observed the stratospheric composition over the last 30 years. A total of 18 instruments provide O3 monthly zonal mean time series to the SPARC Data Initiative. A second group of atmospheric constituents consists of NO2, H2O, HNO3 and aerosol, which have been measured by a smaller but still substantial number of instruments. For these gases and aerosol, between 7 and 12 climatologies are available for the SPARC Data Initiative comparisons, while for most other atmospheric trace gases less than 5 climatologies have been contributed.
The report provides an estimate of the systematic uncertainty in our knowledge of the measured fields’
mean state derived from the inter-instrument spread of ±1σ. This range is given for all trace gases where
0 5 10 15# inst
0 5 10 15# inst
0 5 10 15# inst
0 5 10 15# inst
0 5 10 15# inst
0 5 10 15# inst
0 5 10 15# inst
0 5 10 15# inst
0 5 10 15# inst
−50 0 50
0.1 1 10 100
O (2003−2008)
pressure [hPa]
−50 0 50
H O (1998−2008)
−50 0 50
CH (2003−2006)
−50 0 50
0.1 1 10 100
N O (2006−2009)
pressure [hPa]
−50 0 50
CFC−11 (2005−2007)
−50 0 50
CFC−12 (2005−2007)
−50 0 50
0.1 1 10 100
CO (2002−2009)
pressure [hPa]
−50 0 50
HF (2004−2005)
latitude [°]
−50 0 50
SF (2005−2010)
relative standard deviation [%]
0 5 10 15 20 25 30
3 2
2
4
6
Figure ES.1: Synopsis of the uncertainty in the annual zonal mean state of longer-lived species. The relative standard deviation over all instruments’ multi-annual zonal mean datasets is presented for O3, H2O, CH4, N2O, CFC-11, CFC-12, CO, HF, and SF6 (colour contours). The relative standard deviations are calculated by dividing the absolute standard deviations by the multi-instrument mean (MIM). The black contour lines in each panel represent the MIM trace gas distribution for each species. The number of instruments included is given by the right-hand grey bar, while detailed information on which instruments are included can be found in the respective trace gas sections. Note that the time periods used depend on the availability of the instruments included in the assessment and hence differ from trace gas to trace gas.
the available number of datasets allows for such an evaluation (but not aerosol) and is presented in the form of synopsis plots (Figures ES.1, ES.2, and ES.3). For a more detailed discussion of the individual trace gases see the Summary by trace gas Section.
Agreement for the longer-lived trace gases O3, H2O, CH4, N2O, and HF is best in the tropical and mid-latitude MS and LS and worse towards the UTLS (in particular for O3, H2O, and HF), the US (N2O and CH4) and the LM (O3 and H2O) (Figure ES.1). In contrast, the trace gases CFC-11 (CCl3F), CFC-12 (CCl2F2), and SF6 show the best agreement in the UTLS and larger deviations in the MS. Climatologies of CO, which is a trace gas with an intermediate lifetime, are characterised by large relative differences throughout most of the measurement range.
Nearly all trace gases show larger deviations in the polar regions than at lower latitudes.
Figure ES.2: Synopsis of the uncertainty in the annual zonal mean state of nitrogen containing species. As Figure ES.1, but for the nitrogen containing species. The assessment of the uncertainty in the annual mean state of NO, NOx and NO2 is based on climatologies corresponding to 10am and 10pm, and for the latter also on climatologies corresponding to local sunrise (sr) and local sunset (ss). Note that some of the included climatologies have been derived by scaling the individual measurements with a chemical box model to 10am/10pm local solar time (LST) (see individual chapters for detailed information).
0 5 10 15# inst
0 5 10 15# inst
0 5 10 15# inst
0 5 10 15# inst
0 5 10 15# inst
0 5 10 15# inst
−50 0 50
1 10 100
NO2 sr (2004−2005)
pressure [hPa]
−50 0 50
NO2 ss (2003−2008)
−50 0 50
0.1 1 10 100
NO2 10am (2006−2009)
pressure [hPa]
−50 0 50
NO2 10pm (2005−2007)
−50 0 50
NO 10am (2005−2010)
−50 0 50
HNO3 (2005−2010)
Relative standard deviation [%]
0 5 10 15# inst
0 5 10 15# inst
0 5 10 15# inst
−50 0 50
1 10 100
NOx 10am (2005−2010)
pressure [hPa]
−50 0 50
NOx 10pm (2005−2010)
−50 0 50
(2005−2010)
NO2
latitude [°] latitude [°] latitude [°]
1 10 100
pressure [hPa]
NO
NOx
- Only available with very limited spatial coverage.
- An assessment of the uncertainty in the annual zonal mean field cannot be provided.
NO 10pm (2005−2010)
NOy
1 10 100
pressure [hPa]
1 10 100
pressure [hPa]
Treatment of nitrogen compounds
in the SPARC Data Initiative Reactive nitrogen:
NO = NO + NO Total reactive nitrogen:
NO = NO + NO + HNO + 2N O + ClONO + HNO For N O , ClONO , and HNO , an assessment of the uncertainty in the annual mean field cannot be provided since no data products at the same local solar time are available.
x 2
y 2 3 2 5 2 4
2 5 2 4
0 5 10 15 20 25 30
The agreement of the nitrogen species NO, NO2, and HNO3, as derived from the relative deviations between the climatologies, depends strongly on the atmospheric distribution of the respective gas with larger relative differences in regions of smaller mixing ratios (Figure ES.2). While NO and NOx agree very well in the tropical and subtropical MS and US, NO2 and HNO3 have larger deviations in the US and show the best agreement in the tropical and mid-latitude MS and for HNO3 also in the LS. All climatologies (except for HNO3 and NOy in the Northern Hemisphere (NH)) have considerably larger deviations in the polar regions.
Finally, the NOy climatologies show an excellent agreement throughout most of the measurement range except for the polar latitude LM.
The nitrogen species ClONO2, HNO4, and N2O5 with mostly low atmospheric abundances and large diurnal
variations are measured by two satellite instruments only and are not included in the synopsis plots. Very good agreement is found for ClONO2 in the MS where the diurnal cycle is not very pronounced. For HNO4 and N2O5 the region of small diurnal variations, the MS and LS, respectively, coincides with low mixing ratios resulting in large relative differences.
The agreement between climatologies of the bromine and chlorine compounds HCl, ClO, HOCl (see Figure ES.3), and BrO, depends strongly on the lifetime of the trace gas considered. The longer-lived HCl exhibits very good agreement and the daytime climatologies of the shorter- lived ClO show good to reasonable agreement in the MS and US where mixing ratios are highest. The short-lived HOCl shows mostly reasonable agreement in the US during night-time. Only little spatial overlap exists for BrO measurements, which show good agreement in the MS, but considerable disagreement in the LS.
The short-lived species CH2O, HO2, OH, and CH3CN are available from a small number of instruments only and are thus not included in the synopsis plots. For CH2O, datasets overlap only in the LS, where mixing ratios are low and a large disagreement is found. HO2 shows promising first results with mostly good agreement throughout the MS, US, and LM. OH and CH3CN are each obtained from one instrument and shown for illustration purposes only to provide information on distribution and seasonality of these trace gases.
The large deviations between the datasets of shorter- lived species stem partially from the difficulty of accounting for the strong diurnal cycles these trace gases exhibit. Scaling of the data to a common day/night- time using a chemical box model helped to improve the comparisons in some cases. However, it remains a challenge to estimate how much these deviations are related to errors introduced by the scaling procedures and how much of the deviations correspond to direct measurement differences.
Comparisons of aerosol extinction values are complicated due to a strong wavelength dependency of the retrieved products. Evaluation of aerosol extinction products retrieved at similar wavelengths indicates
0 5 10 15# inst
0 5 10 15# inst
0 5 10 15# inst
−50 0 50
0.1 1 10 100
HC (2002−200 )
pressure [hPa]
latitude [ ]
relative standard deviation [%]
0 5 10 15 20 25 30
−50 0 50
C O (2006−2010)
latitude [ ] −50 0 50
HOC (2002−2010)
latitude [ ]
° ° °
Figure ES.3: Synopsis of the uncertainty in the annual zonal mean state of chlorine containing species. As Figure ES.1, but for the chlorine containing species. The assessment of the uncertainty in the annual mean state is based on ClO daytime climatologies and on HOCl night-time climatologies. Note that for ClO, climatologies from SMR are included which have been derived by scaling the individual measurements with a chemical box model to 1:30pm LST (see ClO chapter for detailed information).
variable agreement between them, with at least part of the biases attributable to differences in the wavelength. A new comparison approach based on scaling of different wavelength products towards a common standard reveals general consistency between the aerosol climatologies in terms of physical structures and, during periods of low aerosol loading, very good agreement also in terms of absolute values.
Sampling bias, produced by the non-uniform sampling of temporally and spatially varying trace gas fields, is estimated through analysis of model fields. Climatologies from instruments with regular and uniform sampling patterns have generally small sampling bias. Climatologies from instruments whose latitudinal coverage varies with time can have strong sampling biases for certain months and locations.
Monthly mean sampling biases for O3 were found in some instances to be above 10%, primarily due to non- uniformity in day-of-month sampling. Throughout most of the stratosphere, sampling bias is much more important for O3 than for H2O, since the variability of O3 is stronger.
The knowledge of uncertainty and inter-instrument differences derived in the SPARC Data Initiative evaluations is used to improve model-measurement inter-comparisons. Particular diagnostics that are supported by a well-defined and small observational uncertainty range and would thus be especially appropriate for model evaluations are recommended.
The suggested observational uncertainty range is derived from all available and suitable datasets instead of recommending one particular satellite dataset for the model-measurement comparison. The selection of the data points suitable for the construction of the uncertainty range is based on their agreement with the mean state of the atmosphere as given by all instruments and on the specific satellite characteristics such as sampling patterns and vertical resolution. For most diagnostics presented, the uncertainty range was reduced in comparison to values used in existing model evaluation efforts such as the CCMVal activity.
Overall recommendations
Highlighted species for which further investigations are recommended:
› H2O and O3 show particularly large uncertainties (with an inter-instrument spread of ±30%) in the UTLS, where satellite measurements can be affected by clouds and spatial smearing. At least part of the uncertainty could be reduced by accounting for geophysical variability in the comparisons.
› For O3, large inter-instrument differences are found at high latitudes (up to ±30%), which at least partially may be attributable to sampling issues. More detailed evaluations are required (especially for ozone hole conditions), including the use of coincident measurement comparisons, polar vortex coordinates and the incorporation of other correlative datasets (e.g., in-situ measurements).
› O3 evaluations in the USLM are impacted by diurnal ozone variations, which may cause systematic biases between the instrument climatologies and need to be accounted for in future evaluation activities.
› CO exhibits large differences in the annual zonal mean structure (±30% in the LS), an issue that should be addressed in forthcoming retrieval revisions.
› The evaluations of some of the short-lived species can be improved by further efforts to scale the datasets to a common LST (e.g., for HNO4, N2O5, and ClONO2 no detailed comparisons were possible due to the lack of scaled datasets) and to improve existing scaled datasets by removing outliers (e.g., for NO).
Highlighted species or regions for which more data are needed:
› At present, there is a lack of correlative measurements that provide the necessary species to establish budgets of chemical families such as Bry, and Cly. Current estimates of these families rely heavily on the use of chemical box models and hence independent validation is not possible.
› The long-term monitoring of stratospheric HCl hinges on two instruments (ACE-FTS and Aura- MLS), which are both past their expected lifetimes.
The abundance of HCl (scaled to yield Cly) in the stratosphere is an important measure to assess the effectiveness of the Montreal Protocol, which controls the use chlorine-containing substances that lead to the destruction of ozone. New HCl measurements are needed to be able to fulfill the obligations to the Montreal Protocol in the future.
› There is a general need to improve trace gas observations (especially H2O) in the tropical and extra-tropical UTLS. Higher spatial and temporal resolution measurements that also penetrate to lower altitudes (well into the upper troposphere) are required to overcome this issue.
Instrument differences generally increase towards the UTLS, which is a critical region for chemistry- climate interactions. A detailed UTLS measurement intercomparison, using high spatial and temporal resolution measurements and diagnostic tools that minimise geophysical variability and differences in vertical resolution, is needed to fully characterise differences between satellite instruments. These comparisons should also be extended to include other correlative measurements such as from balloon, aircraft, or ground-based instrument platforms.
A specific focus on instrument comparisons should also be carried out in the mesosphere where inter- instrument differences have been found to be large. Such comparisons will need to take into account differences in the datasets arising from tides and the diurnal cycle.
The SPARC Data Initiative has provided data in an easily accessible format, basic knowledge on data quality, and some first model evaluation diagnostics. A mixed team of scientists from the SPARC Data Initiative and the model analysis community should further pursue on the generation of specific model evaluation diagnostics that include a ‘best’ estimate and its uncertainty range for ready use in model-measurement comparison exercises.
Knowledge of bottom-up, absolute measurement uncertainty as identified in the SPARC Data Initiative should be improved. The uncertainties would need to include a range of error sources such as uncertainty in the spectroscopic data, calibration, pointing accuracy, and others. As much as possible the uncertainties would need to be derived consistently.
The loss of expert knowledge on datasets from some past missions inhibited their careful assessment in this exercise. It is essential to maintain appropriate documentation, knowledge of data quality, and capacity to reprocess the data from historic measurements as necessary.
Some evaluations suffer from too short overlap periods.
Also, given the growing importance of long climate data records from multiple instruments, the lifetime of currently flying limb instruments should be extended as long as possible.
In addition, the dearth of approved future limb satellite missions is likely to lead to a gap (chasm) in vertically resolved stratospheric and mesospheric trace gas measurements when the current missions end. There is therefore an urgent need to develop and fly new atmospheric limb sounder missions in order to remedy this situation.
Summary by trace gas
The overall findings for all trace gas species and aerosol are presented in the following summary with the systematic uncertainty in our knowledge of the atmospheric composition mean state shown in Figures ES.1 (long-lived species), ES.2 (nitrogen species), and ES.3 (halogenated species). Additionally, the summary highlights similarities and differences between the individual datasets based on comparisons of zonal monthly mean latitude-height cross sections, seasonal cycles, and deseasonalised anomalies and other evaluations that test the physical consistency of the datasets (e.g., tropical tape recorder, QBO).
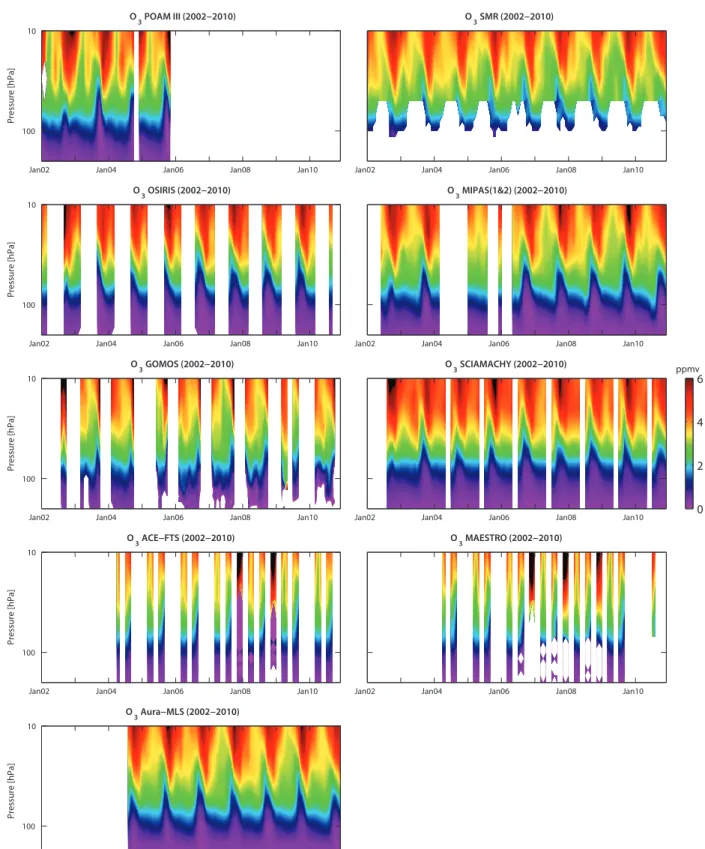
Ozone (O3)
A large number of satellite instruments have been measuring stratospheric ozone profiles over the past three decades. The comprehensive evaluation of vertically resolved monthly zonal mean ozone climatologies from the 18 limb-viewing satellite instruments LIMS, SAGE I, SAGE II, UARS-MLS, HALOE, POAM II, POAM III, SMR, OSIRIS, SAGE III, MIPAS, GOMOS, SCIAMACHY, ACE- FTS, ACE-MAESTRO, Aura-MLS, HIRDLS, and SMILES results in the following conclusions:
The uncertainty in our knowledge of the ozone annual mean state (derived as the ±1σ inter-instrument spread) is smallest in the tropical MS and mid-latitude LS/MS.
Nearly all instruments show very good agreement in those regions, with differences smaller than ±5%; some datasets even agree within ±2.5%.
In the tropical UTLS, the spread between the datasets increases quickly with decreasing altitude, reaching
±30% at the tropical tropopause. In the mid-latitude UTLS, the various datasets show closer agreement, with a spread of ±10% at the tropopause. The poor agreement in the tropical UTLS is related to the small ozone abundances as well as instrumental limitations and demonstrates the need for further evaluation activities, including the use of existing in-situ measurements and nadir sounders.
In the US, all datasets agree well, with deviations around
±10%. Identified inter-instrument deviations in the LM are not necessarily representative of real climatological differences due to the growing importance of the ozone diurnal cycle at altitudes above 1 hPa.
At polar latitudes, the climatologies give a larger spread of the ozone mean state (±15%) compared to lower latitudes. Maximum variations (up to ±30%) are found during times of the ozone hole in the Antarctic LS, possibly related to the different sampling patterns of the individual instruments.
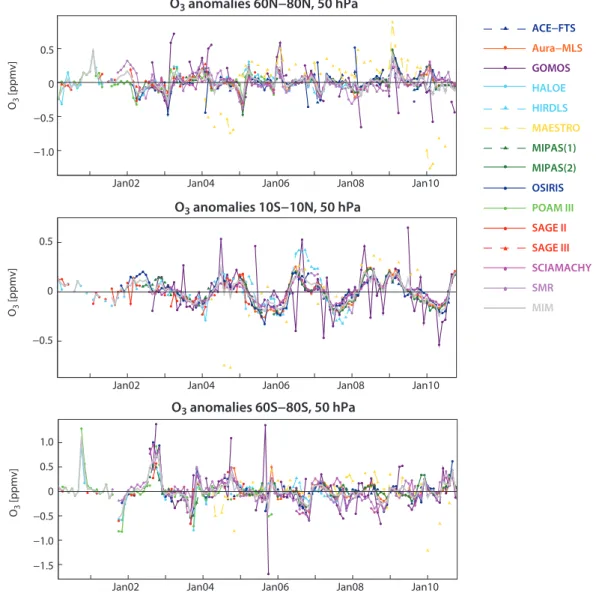
Nearly all datasets show very good agreement in terms of interannual variability and are suitable for studies of climate variability. Note that some instruments show unrealistic spikes (month-to-month fluctuations) in some regions (e.g., GOMOS and ACE-MAESTRO).
SAGE II has been used extensively in validation and long-term studies, and it is of interest to extend the time series through merging activities. In best agreement with SAGE II are the datasets from Aura-MLS, OSIRIS, GOMOS (only in the MS/US) and MIPAS (not at altitudes above 10 hPa).
To improve future model-measurement comparison activities, evaluations of natural variability presented here (seasonal cycle, interannual variability, and downward propagating QBO signal) are recommended.
Depending on the application, individual instruments may need to be excluded from the comparison as demonstrated in Chapter 5.
Water vapour (H2O)
In this report, we assessed the quality of 13 H2O products from 11 different limb-viewing satellite instruments (LIMS, SAGE II, UARS-MLS, HALOE, POAM III, SMR, SAGE III, MIPAS, SCIAMACHY, ACE-FTS, and Aura-MLS) that provide measurements within the time period from 1978 to 2010. SMR provides two data versions and we also treat MIPAS measurements before and after 2005 as two different datasets.
Our knowledge of the atmospheric mean state of H2O derived from the full set of instruments available between 1998 and 2008 is best in the LS and MS of the tropics and mid-latitudes, with a relative uncertainty (given by the
±1σ inter-instrument spread) of ± 2-6%.
The relative uncertainty in the atmospheric mean state of H2O increases toward the polar latitudes (± 10%
and 15% for NH and the Southern Hemisphere (SH), respectively), the LM (±15%) and the UT (±30-50%).
The H2O minimum found just above the tropical tropopause shows annual zonal mean values ranging from approximately 2.5 to 4.5 ppmv, with a mean of 3.5 ± 0.5 ppmv (or ± 14%, 1σ uncertainty). The uncertainty is somewhat larger (± 15-20%) when looking at individual months. Our knowledge of the absolute amount of water vapour entering the stratosphere through the tropical tropopause as derived from satellite observations is hence relatively poor.
Most sensors exhibit very good agreement on the magnitude and structure of interannual variability in the different regions of the atmosphere (once the instruments’ biases are removed), therefore fulfilling a necessary prerequisite for the recommendation of these data for use in studies of climate variability.
Excellent agreement in interannual variability is typically observed between the older dataset from HALOE and the more recent ones from Aura-MLS, MIPAS(1) (MIPAS high spectral resolution measurements before 2005), MIPAS(2) (MIPAS high vertical resolution measurements from 2005 onwards) and ACE-FTS, indicating their potential in extending the HALOE time series in merging activities. Note that the merging of MIPAS(1) and MIPAS(2) needs to address potential
biases between these two datasets. Also, HALOE shows consistently lower values (between -2.5 and -5%) than the MIM throughout the atmosphere, with increasing negative values when moving towards the tropical LS (-15%) and extratropical UTLS (values up to -50%) at altitudes below 100 hPa. The high quality of SAGE II data promises it to be a useful alternative to HALOE at these lower altitudes.
Using a combination of the SPARC Data Initiative water vapour datasets shows great potential for improving past model-measurement comparisons based on the HALOE dataset only (e.g., the seasonal cycle at the tropical tropopause or the tape recorder). However, careful choices have to be made when identifying the set of instruments for specific applications, depending on the region of the atmosphere.
Methane (CH4)
CH4 vertically resolved climatologies are compared from three instruments: HALOE, MIPAS, and ACE-FTS. The instruments overlap only in the year 2005.
The uncertainty in our knowledge of the atmospheric CH4 annual mean state is smallest in the LS and tropical/
NH subtropical MS, with an inter-instrument spread of less than ±6%. The uncertainty is larger in the UT and lowermost stratosphere, with spread of around ±10%. The uncertainty increases also towards higher altitudes and latitudes, where relative uncertainties reach ±20% or more.
HALOE shows consistently lower values than the MIM throughout the atmosphere and in fact shows lower values than all other instruments in the tropics and extratropical UTLS. MIPAS exhibits strong vertical oscillations around the MIM, which are approximately opposite between its high- and low- spectral resolution data version from before and after 2005. ACE-FTS shows features mostly consistent with the other instruments despite the strong impact of sampling (which results in somewhat noisy fields).
Nitrous oxide (N2O)
N2O vertically resolved climatologies are available from four instruments, SMR, MIPAS, ACE-FTS and Aura-MLS, with the earliest starting in 2001.
The uncertainty in our knowledge of the atmospheric N2O annual mean state as derived from the four satellite instruments is smallest in the LS and MS of both the tropics and extratropics, with inter-instrument spreads of less than ±4% and ±6%, respectively. Good knowledge is also obtained in the UT and extratropical LS at altitudes below 100 hPa, where the uncertainty is smaller than
±15%. The relative uncertainty increases moving towards the USLM (with values of more than ±50%).
While the relative inter-instrument differences increase towards the USLM, the instruments show excellent agreement in terms of interannual variability.
Trichlorofluoromethane (CFC-11) and dichlorodifluoromethane (CFC-12)
CFC-11 and CFC-12 vertically resolved climatologies are available from three satellite instruments, MIPAS, ACE- FTS and HIRDLS, which overlap in 2005-2007.
The uncertainty in our knowledge of the atmospheric CFC-11 annual mean state is small at altitudes below 100 hPa, with a relative uncertainty (given by the
±1σ inter-instrument spread) of less than ±5% in the tropics and mid-latitudes and less than ±10% at higher latitudes. In the tropical LS, the spread between the datasets increases quickly with increasing altitude to
±30% due to high ACE-FTS values. In the mid-latitudes LS, HIRDLS displays considerably lower values, and a large relative spread of up to ±50% exists.
The uncertainty in our knowledge of the atmospheric CFC-12 annual mean state is very small at altitudes below 100 hPa, with a spread of less than ±5% and often even less than ±2.5%. In the LS, good agreement between all datasets exists in the tropics, in the NH, and in the SH subtropics (±10%). An exception to this good agreement are the SH extratropics, where considerable disagreement is found (±50%) between ACE-FTS and HIRDLS.
Overall, there is better agreement of the CFC-12 climatologies than of the CFC-11 climatologies, in particular in the LS between 70 and 30 hPa. For CFC-12, largest discrepancies are found in the SH above 50 hPa resulting in pronounced discrepancies between the performance in the NH and SH extratropical regions.
A large number of instrument-specific features can be observed for both trace gases. MIPAS CFC-11 and CFC-12 in the winter hemisphere have different meridional gradients at 200 hPa than the other two instruments. ACE-FTS has problems at its highest retrieval level in the tropics for both trace gases and shows in most regions no clear signals of seasonal cycle or interannual variability. HIRDLS climatologies of CFC-11 and CFC-12 show different gradients in the subtropics compared to the other instruments and large negative deviations in the mid-latitudes.
Carbon monoxide (CO)
The SPARC Data Initiative evaluated vertically resolved CO climatologies from four different instruments: SMR, MIPAS, ACE-FTS, and Aura-MLS.
The uncertainty in our knowledge of the atmospheric CO annual mean state as derived from the four satellite instruments is smallest in the global UT, with an inter- instrument spread of less than ±6%. Good knowledge is obtained in the tropical MS, where the uncertainty is about ±10-15%. The uncertainty is largest in the global LS and also at high latitudes from the MS up to the LM (up to ±50%).
The CO climatologies obtained from the four satellite instruments show large relative differences from the MIM, and do not agree on some key structures in the annual zonal mean distribution. Despite the shortcomings in reproducing the annual zonal mean distribution, the different datasets agree very well on deseasonalised anomalies in the tropical UTLS and MS.
ACE-FTS and MIPAS show a very similar structure of the CO field; however, ACE-FTS exhibits consistently lower values than the MIM in all atmospheric regions. Aura-MLS exhibits an atypical isopleth structure in the LS, and SMR has values that are too high through most of the LS/MS.
Hydrogen fluoride (HF)
Vertically resolved HF climatologies are available from HALOE and ACE-FTS, which overlap in 2004-2005.
The uncertainty in our knowledge of the atmospheric HF annual mean state as derived from the two satellite datasets is smallest at altitudes above 100 hPa, with a multi-instrument spread in this region of less than ±10%
(±5% above 10 hPa). Larger deviations (±15%) are found in the SH high latitude MS mainly caused by the impact of the sampling bias on the annual mean datasets. At altitudes below 100 hPa, HF is less well determined, with a multi-instrument spread of ±30% or larger.
ACE-FTS observes more HF than HALOE at altitudes above 50 hPa, while below 50 hPa HALOE detects more HF than ACE-FTS. For the 2-year long overlap period, both datasets agree roughly on the seasonal and interannual variability, with some differences found for month-to-month variations. Sampling issues are suspected to cause the noticable features found in the latitudinal structure of the HALOE and ACE-FTS annual mean cross sections.
Sulfur hexafluoride (SF6)
Vertically resolved SF6 climatologies are available from MIPAS and ACE-FTS, which overlap in 2005-2010.
The differences between the two satellite datasets are overall very small (up to ±5% and at altitudes below 50 hPa up to ±2%), which implies a small uncertainty and good knowledge of the atmospheric mean state. The only exceptions are some individual grid points where the spread reaches values of ±12%. Note that ACE-FTS and MIPAS both measure SF6 around the same spectral band, and it is therefore possible that the two datasets share systematic error components.
MIPAS detects less SF6 than ACE-FTS in most atmospheric regions, except for altitudes above 10 hPa and below 100 hPa in the SH. MIPAS SF6 in the UTLS around 25°S/25°N shows some elevated mixing ratio peaks, which are most pronounced in the respective winter/spring hemisphere. ACE-FTS shows pronounced month-to-month variations, no clear seasonal cycle,
as well as less steep and much noisier isopleths, likely as a result of its less dense sampling.
Nitrogen monoxide (NO)
The assessment of the atmospheric NO annual mean state is based on the climatologies from MIPAS, and ACE-FTS corresponding to 10am/10pm. Note that the latter have been derived by scaling the individual measurements with a chemical box model to 10am/10pm LST. Additionally, climatologies corresponding to local sunset/sunrise are available from the solar occultation instruments HALOE and ACE-FTS.
The uncertainty in our knowledge of the atmospheric NO annual mean state, as estimated from the 10am MIPAS and scaled ACE-FTS climatologies, is smallest in the MS and US, with an inter-instrument spread of up to ±5% in the tropics, ±10% in the NH mid-latitudes, and ±20% in the SH mid-latitudes. In the LS, the two datasets agree very well in the tropics, but in the mid- latitudes deviations are larger (±20%).
Due to the strong diurnal cycle with a near-zero NO abundance after sunset, the 10pm climatologies provide data only in the high summer latitudes and are not suitable for an assessment of the NO annual mean state.
The local monthly mean sunset/sunrise climatologies from the solar occultation instruments HALOE and ACE-FTS agree well in the US (differences up to
±10%) but show a larger spread (up to ±50%) above and below this region. Their annual mean state for the overlap period 2004-2005 is strongly impacted by sampling and not suitable to derive information on the uncertainty in the annual mean field.
Nitrogen dioxide (NO2)
Vertically resolved NO2 solar occultation measurements are available from SAGE II, HALOE, POAM II, POAM III, SAGE III, and ACE-FTS and can be compared directly if separated into local sunrise and local sunset measurements.
NO2 measurements by limb emission and scattering techniques are available from LIMS, MIPAS, OSIRIS, SCIAMACHY, and HIRDLS, with the latter three scaled with a chemical box model to 10am/10pm LST in order to allow for a direct comparison of the different instruments.
Additionally, ACE-FTS data scaled to 10am/10pm are available. GOMOS provides stellar occultation measurements at 10pm.
The uncertainty in our knowledge of the atmospheric NO2 annual mean state is estimated independently for local sunrise/sunset and 10am/10pm LST. The uncertainty is smallest in the tropical and mid-latitude MS, with an inter-instrument spread in this region of ±5% to ±10% (sunrise/sunset) and ±10% to ±20%
(10am/10pm). In the LS, the NO2 abundances decrease quickly, and for all climatologies a large spread (up to
±50%) exists. In the US, the best agreement is found for
the climatologies corresponding to 10 pm LST (±5%
to ±10%). At high latitudes, the instruments show larger deviations (±50%) than at lower latitudes. Here, sampling issues during high-NOx descent events may contribute substantially to the differences obtained.
The solar occultation climatologies from SAGE II, HALOE and ACE-FTS show very good agreement in the MS, while above and below the differences increase steadily, reaching values of up to ±20% in the US and up to ±50% in the LS. For most regions the NO2, sunrise and sunset evaluations give a consistent picture, however, some differences exist. All three solar occultation instruments, except for SAGE II sunrise data, display the tropical QBO signal. With the exception of the MS sunrise climatologies, SAGE II typically detects the largest NO2 abundances, ACE-FTS resides in the middle range and HALOE is lowest.
The 10am/10pm climatologies show good agreement in the MS, with mean differences of ±10%. In particular, MIPAS, GOMOS, OSIRIS and SCIAMACHY agree very well, with differences below ±5%. In the LS, overall mean differences can be as large as ±40% (GOMOS and scaled ACE-FTS), however, MIPAS, OSIRIS and SCIAMACHY are very close to each other (±5%) in most cases. All 10am/10pm climatologies show the tropical QBO signal, with the best agreement found between MIPAS, OSIRIS, SCIAMACHY and GOMOS.
Interannual anomalies from GOMOS and HIRDLS are characterised by stronger month-to-month fluctuations than the ones from other instruments.
In the tropical MS, scaled ACE-FTS agrees very well with the 10am/10pm climatologies and unscaled ACE-FTS agrees very well with the sunrise/sunset climatologies, with differences up to ±5%. If one were to assume no errors from the scaling, this agreement would suggest that all available measurements are consistent with each other in this region.
Note that scaling with box model is problematic for data during night-time and users should not use scaled data that is based on unscaled values smaller than 0.5 ppbv.
Nitrogen oxides (NOx)
The assessment of the atmospheric NOx annual mean state is based on the climatologies from MIPAS, ACE- FTS, SCIAMACHY and OSIRIS corresponding to 10am and 10pm. For the latter three instruments, individual measurements have been scaled to 10am/10pm LST with the help of a chemical box model. Note that the OSIRIS and SCIAMACHY NOx climatologies are compiled based on their NO2 measurements and on NO profiles derived from a chemical box model. Additionally, climatologies corresponding to local sunset/sunrise are available from the solar occultation instruments HALOE and ACE-FTS.
The uncertainty in our knowledge of the atmospheric NOx annual mean state is smallest in the tropical and NH mid-latitude MS/US, with an inter-instrument spread in this region of up to ±10%. Although in the NH
mid-latitude MS, the instruments agree very well (±5%), deviations increase in the SH mid-latitudes, in particular for the 10am climatologies (up to ±20%). In the LS, low NOx abundances and large relative deviations (±30%) are found. In the high-latitude USLM, the sampling error is exacerbated by stronger gradients due to polar night NOx descent causing an increase of the inter- instrument spread for altitudes above 1 hPa.
The local sunrise/sunset climatologies from HALOE and ACE-FTS show excellent agreement in the US, with mean differences below ±2.5%. In the MS, HALOE detects slightly larger NOx abundances than ACE-FTS (±5%), while in the LS, differences increase steadily (up to ±30%), with HALOE on the low and ACE-FTS on the high side. Overall, the NOx local sunrise and sunset evaluations give a consistent picture, with the exception of the mid-latitude MS. Both solar occultation instruments display important signals of interannual variability like the tropical QBO cycle, but are characterised by stronger month-to-month fluctuations. Their annual mean state for the overlap period 2004-2005 is clearly impacted by sampling and not suitable to derive information on the uncertainty in the annual mean field.
The climatologies corresponding to 10am/10pm show good agreement in the tropical and NH mid- latitude MS, with mean differences of ±5% to ±10%. In particular, the 10am climatologies from MIPAS, OSIRIS, and SCIAMACHY agree very well in the mid-latitude MS and US, with differences of less than ±5%. While scaled ACE-FTS agrees well with the other datasets in the tropical and NH mid-latitude MS, it is considerably lower in the SH mid-latitudes, with differences of up to -30%. This inconsistency between NH and SH mid- latitudes causes the larger inter-instrument spread in the latter region.
Nitric acid (HNO3)
HNO3 climatologies from ACE-FTS, Aura-MLS, HIRDLS, LIMS, MIPAS, SMILES, SMR, and UARS-MLS are evaluated as part of the SPARC Data Initiative.
The uncertainty in our knowledge of the atmospheric HNO3 annual mean state is smallest in the tropical MS and mid-latitude LS/MS, with an inter-instrument spread in this region of up to ±10%. In the tropical LS, mixing ratios are small and the relative differences reach
±50%. In the US, the situation is similar and additionally further complicated by the growing importance of the diurnal variations in HNO3.
At high SH latitudes, a large spread between the annual mean climatologies of up to ±30% exist. Deviations of the individual datasets are often of opposite sign when compared to lower and northern latitudes and are most pronounced during times of the ozone hole. Further evaluations of high-latitude HNO3 need to include the use of coincident measurements and polar vortex coordinates, since the monthly mean comparisons can be impacted by the sampling patterns of the instruments.