Molekulardynamische Untersuchungen heterogener Keimbildung
I n a u g u r a l - D i s s e r t a t i o n
zur
Erlangung des Doktorgrades
der Mathematisch-Naturwissenschaftlichen Fakultät der Universität zu Köln
vorgelegt von
Roberto Rozas aus Chile
Köln 2006
Berichterstatter: Priv.-Doz. Dr. Thomas Kraska Prof. Dr. Ulrich Deiters
Tag der letzen mündlichen Prüfung: 05.12.2006
„Es wird sich zeigen, dass es gar schwierig ist, zu erkennen, welche Eigenschaften jedes Ding in Wirklichkeit hat“ Demokrit, 8 Jh. v. Chr.
v
Zusammenfassung
Heterogene Keimbildung, insbesondere die Kondensation von Dampf in Gegenwart eines Substrates werden mit der Methode der molekulardynamischen Simulation untersucht. Simulationen, die auf diesem Gebiet bislang durchgeführt wurden, haben sich nur wenig mit der detailgetreuen Beschreibung des Substrats beschäftigt. Hier werden die Dynamiken der Gasphase und der Oberfläche simultan behandelt. Es werden zwei Fälle untersucht: Die Kondensation von Argon und die Kondensation von Platin auf Polyethylen-Filmen. Der wesentliche Unterschied zwischen den beiden Systemen besteht in die relative Stärke der Wechselwirkung zwischen dem Adsorbat und dem Substrat.
Das United-Atom-Modell wird eingesetzt, um die Wechselwirkung zwischen den Methylgruppen des Polymers zu modellieren. Die Eigenschaften von Polyethylen in der Bulkphase wie die Temperatur des Glasübergangs, die Dichte und die Ausbildung von gauche-Defekten in der kristallinen Phase können mit diesem Modell für die betrachtete Untersuchung hinreichend genau beschrieben werden. Die Wechselwirkung zwischen den Argon-Atomen kann sehr gut mit dem Lennard Jones-Potential wiedergegeben werden. Die Embedded-Atom-Methode wird benutzt, um die Wechselwirkung zwischen den Platinatomen zu modellieren. Bei Metallen sind Mehrkörpereffekte wichtig, die mit der Embedded-Atom-Methode mit einem Berechnungsaufwand, der vergleichbar zu Paarpotentialen ist, implementiert werden können. Die Kreuzwechselwirkungen zwischen den Atomen und Gruppen werden hier mit dem Lennard Jones-Potential und den Lorentz-Berthelot-Kombinationsregelen beschrieben.
Das Ziel dieser Untersuchung ist es, die Dynamik der heterogenen Keimbildung zu beschreiben und untersuchen und die Variablen zu identifizieren, die das Wachstum und die Strukturbildung von Clustern auf Oberflächen bestimmen. Außerdem werden die Keimbildungsraten bestimmt und die mögliche Modifikationen des Substrates während der Kondensation untersucht. Zu diesem Zweck wurden verschiedene Systeme mit unterschiedlicher Übersättigung der Gasphase und unterschiedlichen Substrat- temperaturen simuliert. Die Berechnungen der stationären Keimbildungsraten in der
Gasphase und auf der Oberfläche werden aus der Clustergrößenverteilung mit der Methode von Yasuoka and Matsumoto durchgeführt.
In den verschiedenen Simulationssystemen wurden unterschiedliche Wachs- tumsmechanismen beobachtet. Argon tendiert dazu auf der Oberfläche als zweidimensionale Inseln zu kondensieren, die koaleszieren und schließlich Lagen auf der Polymeroberfläche bilden. Konsistent mit dieser Art des Wachstums kann die Kondensation in diesem Bereich von relativ leicht übersättigten Systemen bis hin zu untersättigten Systemen mit einem zweidimensionalen Modell im Rahmen der klassischen Keimbildungstheorie beschrieben werden.
Platincluster kondensieren als dreidimensionale Inseln und benetzen die Polymeroberfläche nur partiell. Zum ersten Mal wurde die Einbettung von Metall- atomen und im Inertgas gebildeten Clustern in einem Polymersubstrat, wie sie im Experiment beobachtet wurde, in molekulardynamischen Simulationen erhalten. In Abhängigkeit von der Größe der Platincluster diffundieren sie in die Polymermatrix.
Dies geschieht sogar bei Temperaturen, die unterhalb des Glasübergangs des Polymers liegen.
Die Programme und Routinen, die für die Simulationen und für die Analyse der Simulationsergebnisse benötigt werden, wurden speziell für die hier durchgeführte Untersuchung neu entwickelt. Hierzu zählen Programme für molekulardynamische Simulationen im NpT und NVT Ensemble zur Vorbereitung der Polymerfilme sowie für die Kondensationssimulationen von Argon und von Platin auf den Polyethylenfilmen.
Ausserdem wurden Programmroutinen für die Analyse der Simulationsergebnisse entwickelt. Hierzu zählen a) die Berechnung der radialen und der Winkelverteilungs- funktionen, der Dichteprofile zur Charakterisierung der Polymere, b) die Entwicklung von Algorithmen zur Erkennung von Clustern in der Gasphase und insbesondere an der Oberfläche und c) die Entwicklung von Routinen zur Visualisierung der durchgeführten Simulationen.
vii
Abstract
Heterogeneous nucleation phenomena, in particular the condensation of vapors in presence of a substrate, are studied by molecular dynamics simulations. The simulations reported to this date have paid little attention to the description on the substrate. Here the dynamics of the vapor phase and the surface are simultaneously treated. Two cases are studied: the condensation of argon and the condensation of platinum on polyethylene films. The fundamental difference between both systems is the relative strength of the adsorbate-substrate interactions.
The United Atom Method is used to represent the interactions of methyl groups within the polymer. The properties of polyethylene in the bulk phase such as the glass transition temperature, the density and the formation of gauche defects in the crystalline phase can be well described with this model. The interactions between argon atoms can be well represented by the Lennard Jones potential. The Embedded Atom Method is used to describe interactions between platinum atoms since many body effects, important in metals, can be incorporated with a computation requirement similar to pair potentials. Cross interactions between different types of atoms and groups are here approximated by the Lennard Jones potential with Lorentz-Berthelot combining parameters.
The aim of this investigation is to describe the dynamics of heterogeneous nucleation and to establish the variables which control the growth and structure formation of clusters on the surface, the nucleation rates, and possible modifications of the substrate during condensation. For this purpose, different conditions of the saturation of the vapor phase and temperature of the substrate were simulated in each of the systems studied. Stationary nucleation rates in vapor phase and on the surface are obtained from cluster size statistics using the method of Yasuoka and Matsumoto.
Different growth mechanisms were observed in for the simulated systems. Argon tends to condense on the surface as two-dimensional islands which finally coalesce as layers on the polymer surface. Consistent with this type of growth the condensation in the regime of low saturated and undersaturated vapors can be explained by a two- dimensional model within the frame of the classical nucleation theory.
Platinum clusters condense as three-dimensional islands and partially wet the polymer surface. For the first time the embedding of metal atoms and metal clusters growth into a polymer substrate, as observed in experiments, is attained by large-scale molecular simulations. Depending on their sizes, the platinum clusters can diffuse into the polymer matrix even at temperatures lower than the glass transition of the polymer.
The routines used for the simulation and analysis have been specially developed for the systems studied. Among them are NpT and NVT ensemble molecular dynamics simulations for the preparation and equilibration of thin polymer films, simulations of condensation of argon and platinum on polyethylene films. Furthermore routines developed for the analysis of simulation results include the calculation of a) radial distribution functions, torsion angle distributions and density profiles for the characterization of polymers, b) algorithms for the recognition of clusters in bulk and on a surface and c) routines for the visualization of the performed simulations.
ix
Table of Contents
1. Introduction... 1
1.1 Nucleation Theory ... 3
1.1.2 Homogeneous Nucleation... 5
1.1.3 Heterogeneous Nucleation... 7
1.1.4 Nucleation Work... 9
1.1.5 Nucleation Rate... 11
1.2 Polymers ... 14
1.2.1 Molecular Modelling of Polymers... 15
1.2.2 Crystalline Phases of Polyethylene... 16
1.2.3 Glass Transition in Polymers... 19
2. Methods... 25
2.1 Molecular Dynamics... 26
2.1.1 Integration Algorithm ... 28
2.1.2 Definition of Thermodynamic Properties ... 30
2.1.3 Cut-off Radius Approximation ... 31
2.1.4 Neighbor Lists... 33
2.1.5 Periodic Boundaries and Minimum Image Convention ... 34
2.1.6 Control of Temperature and/or Pressure... 35
2.1.6.1 Nosé-Hoover Thermostat, NVT Ensemble... 38
2.1.6.2 Simultaneous Control of Temperature and Pressure, NpT Ensemble.... 41
2.1.6.3 Simultaneous Control of Temperature and Pressure in Films ... 42
2.2 Force Fields... 44
2.2.1 Potential Models of Noble Gases... 45
2.2.2 Force Fields for Polymers... 46
2.2.2.1 Potential LJ-FENE... 46
2.2.2.2 United Atom Method (UAM) ... 46
2.2.2.3 All-Atoms Models ... 47
2.2.3 Many Body Potentials for Metals, Embedded Atom Method (EAM)... 47
3. Results ... 51
3.1 Simulations of Polyethylene ... 51
3.1.1 UAM Models for Polyethylene... 52
3.1.2 Crystalline Phases of Polyethylene (UAM)... 55
3.1.3 Glass Transition of Polyethylene (UAM)... 59
3.1.3.1 Glass Transition of Bulk PE (UAM) ... 60
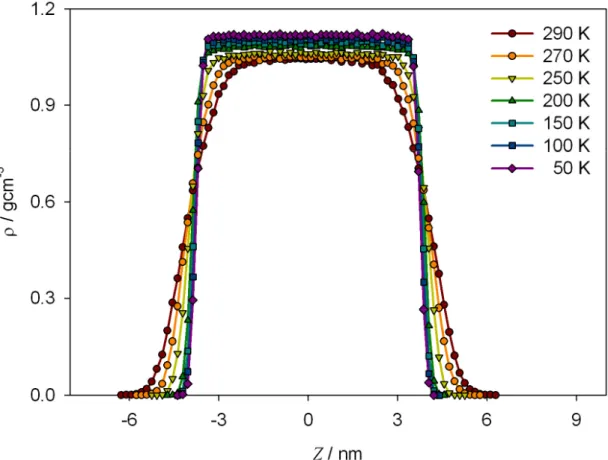
3.1.3.2 Glass Transition of PE (UAM) Films ... 61
3.2 Condensation of Ar on PE Films ... 63
3.2.1 Characterization of Ar Clusters ... 63
3.2.1.1 Interfacial Tension and LV Equilibrium Densities... 64
3.2.1.2 Contact Angle ... 67
3.3 Condensation of Pt on PE Films ... 82
3.3.1 Simulation Methodology ... 82
3.3.1.1 EAM Model for Platinum ... 84
3.3.1.2 Cross Interactions in the System PE-Pt-Ar... 85
3.3.2 Results... 86
4. Summary and Outlook...97
Appendix ...99
A.1 Neighbor Lists ...99
A.2 Expressions for the Calculation of the Forces...103
A.2.1 Useful Formulas ...103
A.2.2 Valence Terms...104
A.2.2.1 Valence Bond ...104
A.2.2.2 Bending ...106
A.2.2.3 Torsion...108
A.2.3 Non-Bonded Interactions ...112
A.2.3.1 Lennard Jones Potential...112
A.2.3.2 Embedded Atom Method (EAM)...113
A.3 Virial Contributions to the Pressure ...116
A.3.1 Valence Contributions...117
A.3.1.1 Valence Bond ...117
A.3.1.2 Bending ...119
A.3.1.3 Torsion...120
A.3.2 Non-bonded Interactions ...121
A.4 Clusters Recognition Algorithm...122
References ...126
Acknowledgments...132
Erklärung...133
Curriculum Vitae ...134
xi
Symbols and Abbreviations
Latin Characters
a lattice parameter
a* deviation of the lattice parameter a from its equilibrium value a0
a0 equilibrium value of lattice parameter a aef effective molecular area
b lattice parameter c lattice parameter
bn shape factor of a two-dimensional island cn shape factor of a three-dimensional cluster d dimension of the system
fn frequency of monomer attachment to a cluster of size n fn* frequency of monomer attachment to nucleus
gn frequency of monomer detachment from a cluster of size n g degrees of freedom
g(r) radial distribution function
h height of a two-dimensional island kB Boltzmann constant
l film thickness
mi molecular/atomic mass of a particle i m number of groups in a polymer chain
n cluster size
n* nucleus size
nt threshold cluster size nd number of outer d-electrons ns number of outer s-electrons nv valence number
p pressure
pN normal component of the pressure tensor pT tangential component of the pressure tensor pB pressure of the barostat
peq equilibrium pressure pc critical pressure
pi generalized momentum of a particle i qi generalized coordinate of a particle i
r Distance
ri position vector of a particle i rc cut-off radius
rl Verlet radius rij distance of a pair
s additional variable of the Nosé-Hoover thermostat
t time
Δt integration step
w characteristic frequency
wT frequency of the thermal response of a system coupled to a thermostat zc coordination index
zi number of particles in the i-th shell of neighbors Ai area of the interface cluster-substrate
As area of the interface substrate-vapor
B bulk modulus
C0 concentration of nucleation sites Cn concentration of clusters of size n Cn* equilibrium concentration of nucleus
Cαβ elastic constants expressed in Voigt notation E0 sublimation energy at zero temperature Esub sublimation energy
F force vector
F(ρ) embedding energy function G Gibbs energy of the system Gex excess energy of a cluster
ΔGn formation work of a cluster of size n ΔG* formation work of a nucleus
I impingement rate
J nucleation rate
Jn net flux through the bin n of the cluster size distribution Lα length of the simulation box in the direction α
M molecular weight
Mη mass parameter of the Nosé-Andersen barostat N number of particles
Na number of nucleation active centers
Q mass parameter of the Nosé-Hoover thermostat S supersaturation ratio
S’ entropy of the system
T temperature
TB temperature of the heat bath Tc critical temperature
Tg glass transition temperature (film) Tg∞ bulk glass transition temperature Tm melting temperature
U potential energy function
V volume
Vl volume of a cluster in condensed phase W virial contribution
Z(r) effective charge function
xiii Greek Symbols
α direction: x, y or z αs sticking coefficient
γ specific surface energy of the interface cluster-vapor γi specific surface energy of the interface cluster-substrate γs specific surface energy of the interface substrate-vapor Δγ effective specific surface energy
δ(r) Dirac delta function δij Kronecker delta operator
ε Lennard Jones energy parameter (energy minimum of the potential) εijk permutation operator
φ torsion angle between four consecutive groups in a chain φ(r) Coulomb pair potential
ξ friction coefficient of the Nosé-Hoover thermostat Θ(r) Heaviside function
θw contact angle
θ bending angle between three consecutive groups in a chain λ scaling factor in the velocity-scaling method
κ specific edge-energy of a two dimensional cluster μ chemical potential
Δμ supersaturation
ρ density
ρl number density of particles in condensed phase ρat atomic electron density
ρh host electron density ρeq equilibrium vapor density
σ Lennard Jones parameter (zero of the potential) τ characteristic time
τB relaxation parameter of the Berendsen thermostat
υ cooling rate
φ setting angle
Ψ(θw) Volmer function of the wetting angle
Ψ(r) double-ζ-wave functions of the Hartree-Fock approximation Ω equilibrium volume per atom
Ф surface energy of a cluster Δ difference
∇ gradient
∂ differential
Others
Hamiltonian of the system kinetic energy of the system
Lagrangian of the system potential energy of the system thermodynamic variable Zeldovich factor
Abbreviations
HEN 2D heterogeneous two-dimensional nucleation HEN 3D heterogeneous three-dimensional nucleation
HON homogeneous nucleation
EAM embedded atom method
MC Monte Carlo
MD molecular dynamics
LJ Lennard Jones
LRC long range corrections RDF radial distribution function
UAM united atom method
xv
Chapter 1 Introduction
The nucleation of a vapor in presence of a substrate has been a topic of current interest in experiments1-8, theory10-12 and simulations13-19. A detailed understanding of the growth phenomena on surfaces requires the study of the microscopic processes such as the nucleation in vapor phase, adsorption on the surface, diffusion and coalescence of clusters in/on the substrate.
Experimental studies based on Electron Transmission and Scanning Tunnelling Microscopy determinations7,8 have been mainly focussed on the epitaxial growth of metal atoms on flat crystalline surfaces at low deposition rates. These experiments have served as a guide for the development of the nucleation theory.
From a technological point of view there is an increasing interest in polymer- metals systems such as metalized plastics, metal nanostructures (nanowires) on polymer templates and nanocomposites formed by finely distributed metal particles in polymers20,22. Additionally, the use of organic polymers as templates in the production of metal nanoparticles has been shown to be an effective method to control their sizes and prevent their oxidation by encapsulation. Concerning the preparation of polymer- metal nanocomposites there are any straightforward synthesis route to obtain nanoclusters of an appropriate narrow size distribution with high concentration. Several methods as colloidal syntheses, solvent-based techniques and sputtering have been used to produce nanocomposite materials containing magnetic nanoclusters embedded in different types of matrices. The limitations of these methods arise from the difficulty to control the nanoparticle size independently of the metal volume fraction. The vapor
deposition of metals on polymers templates is a promising solvent-free alternative, since it provides an easy control over the nanocluster growth1.
Experiments of condensation of low-reactive metals on polymeric substrates have revealed that their clusters deposit on the surface and tend to build crystallites23,24. Larger clusters remain near the polymer surface while small clusters diffuse into the polymer matrix, even below the glass transition temperature of the polymer Tg (Fig.
1.1). This result has been attributed to the existence of a liquid-liquid layer near the surface of the film25 and also interpreted as a change of the glass temperature near the surface26. The temperature at which the metal clusters can embed in the polymer film is lower than its glass transition temperature, and strongly as the average size of the clusters decreases27. Experiments24 also show that the extent of the metallization is sensible to the previous thermal treatment of the polymer substrate since of its effect on the morphology and free volume of the polymer. The temperature of the substrate controls the diffusion of the metals clusters in the polymer matrix and determines their size distribution.
Figure 1.1. Diffusion of small metal clusters on polymer films and deposition pattern of non-reactive metal clusters on polymer substrates24. a) TEM micrograph of the interface gold-trimethylcyclohexane- polycarbonate (TMC-PC) at 80 °C, under the glass transition temperature of the polymer substrate Tg=235 °C. Au is shown in dark. b) Lateral view of the Figure a).
Molecular simulations of condensation of vapors in presence of an active surface have been focussed on the study of confinement effects in phase separation17-19 and also on the effect of strength of the adsorbate-substrate interactions on the growth mechanism. Simulation results of metastable vapors between walls exhibit two differentiated regimes; at small distances between walls the vapor behaves as a capillary system confined in a slit pore, where the vapor experiences a crossover to bulk behavior upon increasing the distance between the walls. Depending on the strength of the attraction between the substrate and the condensing particles, the surface can be
a) b)
3 partially or complete wetted. Weak attractive interactions can even inhibit the condensation on the surface because of the formation of a depletion zone were the vapor density is lower than the bulk one. These studies have served as proof of the nucleation models14-16.
In the simulations reported to this date little attention has been paid to the description of the substrate. In some cases it has been represented as a semi-infinite plane which interacts with the vapor according to an effective potential. Usually a Lennard Jones 9-3 potential is used, since it nearly represents the effective interaction of a particle with a wall of uniform distributed particles13. In these simulations the substrate is modelled as a continuous static medium. In other cases the surface is represented as isothermal flat monolayer of atoms. The control of the substrate temperature is attained by a strong coupling with phantom particles15.
As an extension of these investigations, the heterogeneous nucleation of vapors is simulated here using a more realistic model of the substrate. Polymer substrates are represented as arrangements of linear flexible chains. The dynamics of nucleation, condensation and changes in the substrate are simultaneously treated.
1.1 Nucleation Theory
The direct observation of natural phenomena as rain and snowfalls indicate that the formation of a new phase takes place in a progressive and not in a simultaneous way. Theoretically, the simultaneous and spatial uniform condensation has a higher energetic barrier. Nanoscopic embryos of the new phase produced by local density fluctuations appear in the old phase. The kinetics and the path which describe a phase transformation are called nucleation. Clusters of condensate are randomly formed in the vapor phase, whose sizes can be measured equivalently in terms of their volume or number of atoms. For this purpose a definition of the dividing surface between the phases is required9. The clusters of size n=n* in unstable balance with the vapor are named nuclei. Only the clusters bigger than the nuclei, supernuclei, are able to grow spontaneously until reaching a macroscopic size. The stationary rate of supernuclei generation J is a measure of the dynamics of the nucleation. It is expressed as the number of clusters generated per time unit and volume unit, in the case of homogeneous nucleation, and per surface unit for heterogeneous nucleation.
The early investigations of Farkas, Volmer and Weber, Becker and Döring, Stranski and Kaischew, Frenkel and Zeldovich among others on the search of a kinetic description of the aggregation phenomena and phase transitions led during the last century to the foundations of the classical nucleation theory28. The value of this analytical approach is that it provides a direct interpretation of experimental and simulation results since it establishes a link between the relevant variables of the transition; nucleation rate, formation energy and size of the nucleus, with the macroscopic properties of the system29. In the following sections some models for the description of the condensation of a vapor phase are briefly presented.
1.1.1 Thermodynamics of Phase Transitions
First order phase transitions, for example the condensation of a vapor phase, can be well described by classical thermodynamics arguments; an open system tends spontaneously to a state of minimum free energy. The free Gibbs energy G of a pure substance is a function of the temperature T, pressure p and number of particles of the system N, G=G(T,p,N). As an extensive thermodynamic quantity it can be written as
) , (T p N
G = μ and its total differential is given by
N p V T S
G 'd d d
d =− + +μ (1.1)
where S’, V and μ are respectively the entropy, volume and chemical potential of the thermodynamic system.
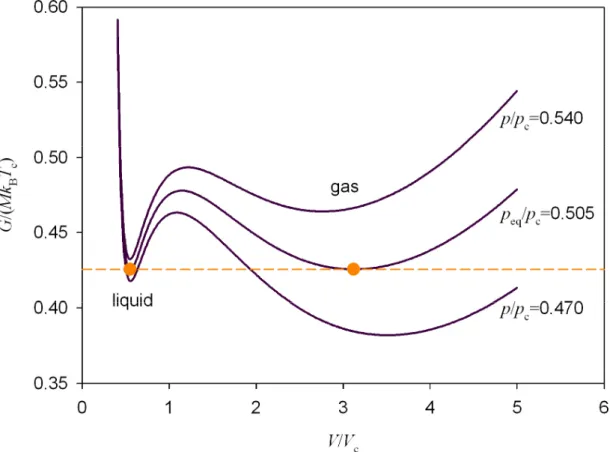
The Gibbs energy of a fluid along a subcritical isobar shows two local minima (see Fig 1.2); one of them corresponds to the gas phase, the other to the liquid. At low pressure the gas phase is stable since its energy minimum is lower than the liquid one.
The Gibbs free energy of the system reaches a global minimum at a given pressure peq
as the energy of both phases converges to the same value. At this point both liquid and vapor phases coexist in a stable equilibrium. Above the pressure peq the vapor is metastable because of the positive the energy difference between the vapor and the liquid phase. In other words, the system can spontaneously condense in order to reduce its Gibbs energy.
The difference of molar Gibbs energy between the two phases, given by Equation (1.2), is called supersaturation
5
(
p p)
k T SV S T
l k
v − = B ln + 0 − eq ≈ B ln
=
Δμ μ μ . (1.2)
V0 denotes the molar volume of the condensed phase. The supersaturation is the driving force for the condensation. Here S, the supersaturation ratio, is defined as the ratio between the pressure of the system and the equilibrium pressure at the temperature of the system S = p/peq(T).
The region of mechanically stable,
(
∂p/∂V)
T <0, supersaturated states, S>1, defines a metastable region in the phase diagram. The metastability in a one-component system is a necessary condition in order that vapor-condensate transition occurs, but it says nothing concerning the dynamics and path of the transition; this condition only establishes the feasibility of the phase change.Figure 1.2. Gibbs energy curves of a Van der Waals fluid along subcritical isobars9 at T/Tc=0.85. Both liquid and gas phase are related to a minimum of the energy. A stable phase equilibrium is reached at peq/pc=0.505.
1.1.2 Homogeneous Nucleation
The formation work of an n-sized cluster is equal to the difference of the system free energy between its final and initial state; before and after the formation of the
cluster. This difference would be simply equal to -nΔμ if the atoms formed simultaneously a sufficiently large bulk condensed phase, but this is not the case: The nucleation takes place in the time interval where the clusters have nanoscopic sizes. The difference between the properties of a cluster and the properties of the corresponding condensed bulk phase introduces an additional contribution to the work ΔG necessary to build a cluster
Gex
n Gn =− Δ +
Δ μ . (1.3)
The excess free energy term Gex takes in to account this additional contribution.
Its definition requires approximations and can be expressed as9
(
−)
+∫ ( )
− Φ
= n
p
p
n pV V p p
p
Gex l l d . (1.4)
Here Vl denotes the volume of the cluster and pn the pressure inside the cluster. The first term Φ in Equation (1.4) is the cluster surface energy, the next one is the energy change related to the variation of pressure experienced by the control volume Vl after the formation of a cluster and the last term is the difference between the potential energy of the particles in the cluster and in the corresponding bulk phase. The excess energy reduces to surface energy of the cluster Gex =Φ. A reasonable good approximation for a cluster in liquid and solid phase is to assume that its volume depends on the temperature only Vl =Vl(T). The cluster surface energy is assumed proportional to the area of the cluster surface Φ=γA, where γ is the specific surface energy of the interface between the cluster and the vapor. Furthermore, the surface of regular shaped bodies is related to the volume by A=cnVl2/3, where cn is the cluster shape parameter, for example cn =
(
36π)
1/3 for a sphere and cn =6 for a cube. Upon considering a uniform density inside the cluster the amount of atoms in a cluster can be approximated as n=ρlVl, where ρl is the number density of the condensed phase at the temperature of the cluster. Under these assumptions the formation work of a cluster of size n is3 /
n2
a n
Gn =− Δμ+ γn
Δ , where a=cnρl−2/3. (1.5)
7
1.1.3 Heterogeneous Nucleation
Heterogeneous nucleation takes place when the old and forming phases are in contact with a third phase or molecular species. According to the shape and dimension of the clusters different kinds of heterogeneous nucleation can be defined. Two idealizations for the vapor condensation on a substrate are perused here; clusters grow as droplets forming a contact angle with the surface (HEN 3D) and clusters grow as disks of fixed thickness along their periphery (HEN 2D).
The denominations 2D and 3D refer to the growth directions of the clusters.
Equation (1.5) can be formulated in more general terms to describe the homogeneous HON and heterogeneous HEN cases of nucleation in three dimensions 3D, for this purpose the surface contribution of the Equation (1.4) is replaced by the energy change of the system after the adhesion of a cluster9
A A
A γ γ
γ + +
−
=
Φ s i i i (1.6)
Ai denotes here the contacting surface between the cluster and the substrate, A the area between the cluster and the vapor and As the area between the substrate and the vapor (see Fig. 1.4).
Figure 1.4. Geometrical quantities involved in the classical nucleation theory for a) cap-shaped clusters and b) cylindrical clusters, they growth in this case on the face adjacent to the substrate.
For cap-shaped clusters the difference γs −γi is written in terms of the contact angle by means of the Young's relation
w i
s γ γ cosθ
γ − = (1.7)
The contact angle θw is defined as the internal angle between the surface and the tangent plane on the cluster basis (Fig. 1.4a). The formation work of a cluster on a surface is9,29,30
a) b)
3 / 2 efn a n
Gn =− Δμ+ γ
Δ . (1.8)
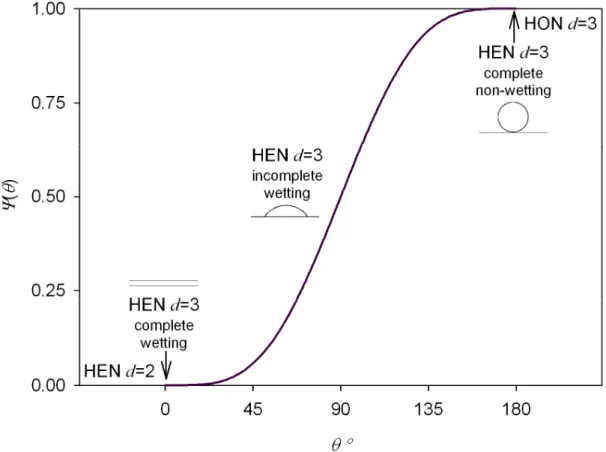
Where γef =ψ1/3(θw)γ is an effective value of the specific surface energy, a=cnρl−2/3 with cn the shape factor of a sphere and ψ the Volmer factor (Fig. 1.5)
( )(
w)(
w)
2w) 1/4 2 cos 1 cos
(θ θ θ
ψ = + − , θw∈[0°,180°], ψ ∈ [0,1]. (1.9)
Homogeneous nucleation can be treated as a particular case of heterogeneous three-dimensional nucleation (1.8). The non-wetting case θw =180° physically corresponds to an inert surface or strong interactions between ad-atoms. As the relative interaction between the surface and the ad-atoms increases, the ratio height/surface of the cap decreases as the contact angle. In the extreme θw =0°, the shape of the cluster converges to a flat layer on the surface.
Figure 1.5. Dependence of the activity factor on the contact angle according to the Equation (1.9). The heterogeneous two-dimensional growth mechanism continuously evolves to the three-dimensional homogeneous nucleation as the contact angle increases.
When γs −γi >γ , the definition of the contact angle loses its usual meaning; the clusters completely or partially cover the surface with islands. These clusters of very
9 low contact angle grow in two dimensions a through their peripheral surface (see Fig 1.4b). This growth mechanism is called heterogeneous two-dimensional nucleation (HEN 2D). Therefore, the formation work of a island of size n is9,30
(
aef)
b n1/2 nGn =− Δμ − Δγ + nκ
Δ (1.10)
h V
aef ≈ l0 / is an effective molecular area, h is the height of the cluster and bn is a shape factor of the island, for example for a cylinder bn =2
( )
πaef 1/2, κ ≈γh is the specific edge energy of the cluster. Δγ is an effective specific surface energy defined bys
i γ
γ γ γ = + −
Δ . (1.11)
<0
Δγ , Δγ =0 and Δγ >0 correspond to incomplete, complete and ‘better-than- complete’ wetting respectively. According to the Equations (1.8) and (1.10), the driving force for the HEN 2D condensation is given by Δμ−aefΔγ . Thus, the condensation of an undersaturated vapor in presence of an active surface is even possible if the term
γ μ− Δ
Δ aef is positive.
1.1.4 Nucleation Work
A thermodynamic law common to natural transformations is that the most favourable path for a change is the minimum energy one. The condensation of a vapor is not an exception to this rule.
The competition between the negative bulk and the positive surface energy contributions to the work of formation of a cluster, Equations (1.5), (1.8) and (1.10), leads to a maximum energy ΔG* (Fig. 1.3a). It represents the energetic barrier of nucleation. Energy must be invested to build a cluster smaller than the nucleus; when a cluster reaches a supercritical size it grows spontaneously to observable sizes.
The size of the nucleus n* and the formation work of a nucleus ΔG* =ΔG(n*) are defined by the maximization conditions dΔGn/dn=0 and d2ΔGn /dn2 <0. For the HEN and HON 3D models results
3
* ef
27
8 ⎟⎟
⎠
⎜⎜ ⎞
⎝
⎛
= Δ
μ γ
n a and μ
μ
γ = Δ
= Δ
Δ * 3 ef23 * 2 1 27
4 a n
G (1.12)
while for the HEN 2D model this condition leads to
2
ef
*
4
1 ⎟⎟
⎠
⎜⎜ ⎞
⎝
⎛
Δ
−
= Δ
γ μ
κ a
n bn and
(
μ γ)
γ μ
κ = Δ − Δ
Δ
−
= Δ
Δ * ef
ef 2
* 2 n a
a
G bn . (1.13)
The Gibbs-Thompson Equation (1.12) shows the dependence of the nucleus size on the supersaturation ratio30. The nucleus size and formation work of the nucleus are monotonously decreasing functions of the saturation.
The change in the Gibbs energy associated to the spatially uniform condensation of N particles in unstable gas phase, for example the gas phase at T/Tc=0.85 for the isobar p/pc=0.540 (Fig. 1.2) is ΔG =NΔμ. The Equations (1.12) and (1.13) indicate that the energy barrier for the local condensation of clusters is about n*Δμ, much lower than the barrier for the spatially uniform condensation; since n* < N. The nucleus size and the nucleation barrier decrease in presence of an active surface because of the reduction of the specific energy of a cluster (Fig. 1.3b).
Figure 1.3. Energy of formation of cluster ΔGn versus the cluster size n. a) At low cluster sizes the positive surface contribution dominates over the bulk one. The maximum of represents the formation work of a nucleus n*. Clusters larger than the critical size n* spontaneously growth b) The nucleus size and the nucleation barrier decrease when a cluster contacts a surface because of the reduction of the surface energy contribution.
The presented models of nucleation lead to different functions ΔG* of Δμ, Equations (1.12) and (1.13). Nevertheless, all of them satisfy the relation
a) b)
11
* *
G n
T
−
⎟⎟ ≈
⎠
⎜⎜ ⎞
⎝
⎛ Δ
∂ Δ
∂
μ .
(1.14)
The Equation (1.14), called nucleation theorem31, finds important applications in the interpretation of experimental information. One of them is the direct evaluation of the nucleus size from isothermal J-S data.
1.1.5 Nucleation Rate
The basic kinetic model of cluster growth of the classic nucleation theory was proposed by Szilard28. In his model the clusters grow according to a reversible bimolecular mechanism, the monomers attach to clusters of size j to build another of size j+1
] 1 [ ] 1 [ ]
[j + ⇔ j+ . (1.15)
Coalescence reactions of the type [j]+[i] ⇔ [j+i], for i>1, are ignored. This mechanism is reasonable for the description of the condensation of a vapor phase, since the amount of monomers notably exceeds the population of larger clusters. Furthermore, the monomers have a higher mobility.
The Szilard’s mechanism can be illustrated as a system of monomers contained in a semipermeable chamber at fixed saturation. The density of monomers is constant since the supercritical clusters once formed are extracted, through a membrane, whereas an identical quantity of monomers enters the system. The evolution of the cluster size distribution is governed by a detailed population balance where all the possible disintegration and generation of an n-sized cluster are accounted for by means of reactions of the type (1.15)
n n
n J J
t
C = −1 − d
d . (1.16)
The bin n exchanges clusters with the bins n-1 and n+1, Cn is the population of clusters of size n expressed as concentration, per volume and surface for HON and HEN respectively, Jn is the net flux through a bin n of the discrete cluster size distribution, given by
1
1 +
− +
= n n n n
n f C g C
J (1.17)
fn and gn are respectively the attachment and detachment frequencies of monomers of a cluster of size n. The solution of the Equation (1.16) conduces to a Boltzmann cluster size distribution9,28
⎟⎟⎠
⎜⎜ ⎞
⎝
⎛ Δ−
= k T
C G
Cn n
B
0exp (1.18)
The nucleation rate, the stationary rate at which the supernuclei are generated, is according to (1.16) equal to the aggregation ratio of monomers to the nuclei minus the rate of disintegration rate of supernuclei. The definition of the monomer detachment frequency is complex, since it depends on the properties of a cluster in its first stages of formation. For this reason the detachment contribution is normally expressed in terms of the attachment by means of the introduction of a correction factor in the Equation (1.17) defined as
2 / 1
* 2 2
2 B
1
⎟⎟
⎠
⎞
⎜⎜
⎝
⎛− ∂ Δ
=
n=n n
dn G T πk
(1.19)
Then, a general expression for the stationary nucleation rate can be expressed as9,30
*
* n
n C
f
J = . (1.20)
Both the Zeldovich’s factor and the nuclei concentration in stationary regime Cn*
depend on the formation work ΔG* and size of the nucleus n*. They are thermo- dynamic quantities which are defined by the Equations (1.12) and (1.13) for the different kinds of nucleation. The attachment frequency is a kinetic term which depends on the transport mechanism of monomers to the growing cluster surface. In a condensing vapor the direct impingement transport mechanism of monomers dominates, the impingement flux is given by the Herz-Knudsen9 relation
(
2 mk T)
1/2I p π B
= . (1.21)
13 I does not depend on the growth mode of the clusters; it only depends on the temperature and pressure of the vapor phase. The attachment frequency fn* is the product of the impingement flux I, the surface of the cluster in contact with the vapor where the monomers attach A and the fraction of impinging monomers which effectively attach to the cluster surface αs, called sticking coefficient
IA
fn* =αs , αs∈ [0, 1]. (1.22)
In the HON model monomers impinge over all the cluster surface in contact with the vapor A=an*2/3. In HEN only a fraction of the cluster surface is in contact with the vapor, in particular for cap-shaped clusters the area of this surface is equal to
( )
*2/33 / 2
w
2 cos
1 an
A ψ
θ
= − (1.23)
Using the Equations (1.18) to (1.23) in (1.20) the following expression for the nucleation rate for cap-shaped clusters HEN 3D is obtained
( )
⎟⎟⎠
⎜⎜ ⎞
⎝
⎛ Δ−
⎟⎟⎠
⎜⎜ ⎞
⎝
⎟⎟ ⎛
⎠
⎜⎜ ⎞
⎝
⎛
= −
T k
G T
k p m
J C
B l
*
B 2 / 1 w
0
s 2 exp
2 cos 1
ψ π
γ θ
α ρ . (1.24)
This equation reduces to the HON case for the non-wetting condition θw=180°.
In the HEN 2D case the monomers attach to the cluster periphery, then
2 /
hn1
b
A= n , (1.25)
where bn is a shape factor of the island. Using (1.18) to (1.22) and (1.25) the expression for the heterogeneous two-dimensional nucleation rate, HEN 2D, is
⎟⎟⎠
⎜⎜ ⎞
⎝
⎛ Δ−
⎟⎟⎠
⎜⎜ ⎞
⎝
⎟ ⎛
⎠
⎜ ⎞
⎝
⎛Δ − Δ
= k T
G T
k p m
h a b C
J n
B
*
B 2 / 1 ef 0
s exp
8π γ
α μ . (1.26)
C0 is the concentration of nucleation sites, a constant in the Szilard’s experiment, equal to the monomer density for the homogenous nucleation C0=ρ. For HEN C0 is the
concentration of active sites on the substrate surface Na/A', it is equal to the inverse of the substrate surface density 1/aef when all the sites are active and in some cases approximated as the projection of the monomer density on a plane15 C0=ρ2/3.
Using the Boltzmann equilibrium cluster size distribution (1.18) and the general expression of the nucleation rate (1.20) the following relation is obtained:
) ln(
ln * 0
*
C f kT J
G
− n
Δ =
− (1.27)
Differentiation with respect to lnS and combination with the nucleation theorem (1.14) provides a useful expression for the direct calculation of the nucleus size from J-S data along an isotherm30
ln 1 ) ln(
ln
ln 0
* ⎟ −
⎠
⎜ ⎞
⎝
⎛
∂
− ∂
⎟⎠
⎜ ⎞
⎝
⎛
∂
= ∂
T S T
C S
n J (1.28)
Usually the term C0 is supposed to be independent of the saturation. However, upon considering the vapor phase as a ideal gas, p= ρkBT , and taking into account the dependence of the concentration of active sites C0 on the vapor density the relation given by (1.28) is not strictly satisfied.
1.2 Polymers
Polymers are materials composed of macromolecules consisting of a large group of bonded repeating units, the monomers. The simplest polymers, homopolymers, are composed by identical monomers. Some examples of homopolymers are polyethylene (PE), polystyrene (PS), polyethylene oxide (PEO) and the bisphenyl-A-polycarbonate (BPA-PC). Heteropolymers are composed of more than a type of monomer. They can be very complex as the DNA, where different monomers (deoxy-ribonucleotides) are present in a large molecule32.
The applications of polymeric materials include the manufacture of food packages, plastic bags, compact discs, covers, tires and microelectronics. Of particular interest here are polymer-metal composites23 and the role of polymers as substrates to support nanoscopic structures as metal nanowires20-22. One of the reasons for the
15 abundance of applications of polymers is the diversity in their chemical structure, ranging from simple linear homopolymers to branched polymers, hyperbranched polymers, stars, H-shaped polymers and copolymers with random or block sequences.
Furthermore, polymers are versatile molecules: Their physical properties can be tailored to satisfy the requirements of specific applications; for example the viscosity and the transition from the elastic to the viscous behavior can be tailored by varying the molecular weight or the functional groups which compose the chains. They can also be used as additives to modify the viscosity of a solution. The interplay between variables such as the connectivity, length and stiffness of the chains determine the properties of a polymeric material33.
Polymers can be found in different states; crystalline, amorphous (glass, melts, rubber, gel) or in solution. In gel and rubber states they are found as interlinked chains in disordered liquid-like structures. In the crystalline state, however, the units are ordered and oscillate around defined positions of a primitive cell that is repeated along the crystal.
1.2.1 Molecular Modelling of Polymers
Molecular simulations have been demonstrated to be adequate methods for the determination of the structure and the statistical properties of polymers. The first step of the molecular modelling is the choice of the simulation method and the model of interaction between atoms/molecules. The available methods range from classic simulations using simple representations as the bead-spring model33-40 to the use of techniques based on density functional approaches as Car-Parinello simulations41-43 and Path Integral Monte Carlo44, which can account for quantum effects.
Polymers can be characterised at different levels of detail. At microscopic level the properties are determined by local vibrations of bonds and valence angles. The properties are uniquely determined by the chemical structure of the involved molecules.
At coarse-grained level the atomic details of the chains lose importance and the chains can be understood as segments characterized by their flexibility. At this level the morphology is determined by the possible arrangements and different ways to pack the chains.
Chain connectivity in polymers introduces length scales which range from the length of a chemical bond to the gyration radius of a chain, covering 2 to 4 orders of
magnitude. This wide range of length scales translates into an even large relaxation time scales of amorphous polymers ranging from 10-13 to 10-3 s or even 103 s when glass dynamics is concerned. There is currently no single simulation technique able to efficiently describe all these length and time scales33.
Chemically realistic models are necessary for a description of polymers at short length scales. Studies of detailed interaction models highlight the importance of torsion dynamics in all relaxation process in polymeric materials. In some cases classic mechanics does not apply and quantum effects must be considered, for example, to describe the low temperature thermal behavior of macromolecular systems where light atoms are present44. However, ab initio methods are still restricted to the study of phenomena that occur in time and length scales considerably smaller than those that can be treated by means of force field based simulations.
The general behavior of amorphous polymer phases; glass, melt, rubber and polymers close to the glass transition, in bulk and confined geometries, have been qualitatively described using classic molecular dynamics simulations with simple coarse-grained models33-40, 45-47. On the other hand, the use of simple models makes it possible to extend the size and time scale of simulations of macromolecular systems.
1.2.2 Crystalline Phases of Polyethylene
Polymer crystals constitute a particular class of systems whose technological applications quickly increase due to their use in the manufacture of composite materials.
In general, polymer crystals of macroscopic size are difficult to produce; therefore the characterization of the properties of the crystalline phases of these systems is complicated in laboratory.
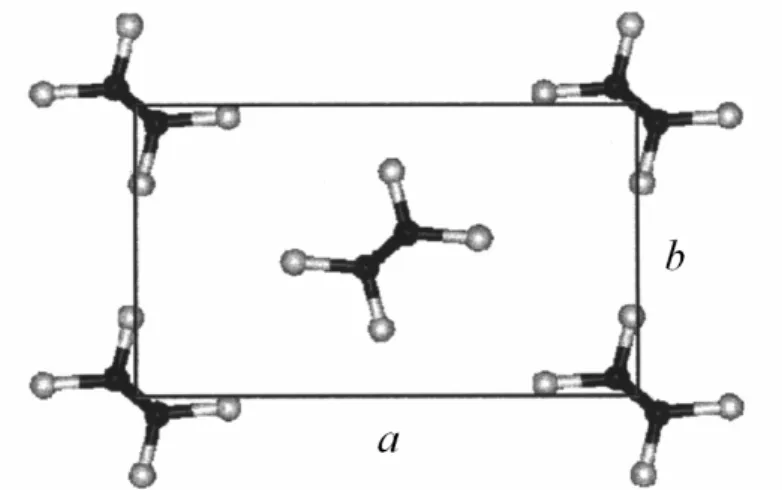
Numerous X-ray scattering experiments, Raman spectroscopy, nuclear magnetic resonance NMR, dielectric relaxation, differential scanning calorimetry DSC and quasielastic neutron scattering experiments48-56 have been made on PE to determine the unit cell parameters of these crystalline structures and to elucidate the nature of the stable phases before melting. From those investigations it has been concluded that PE, as odd paraffins, shows an orthorhombic structure at low temperature (Fig. 1.6), while at higher temperature the stable crystalline structure is hexagonal.
17
Figure 1.6. xy projection of the unit cell of the crystalline structure of polyethylene57.
Structure a [Å] b [Å] c [Å] a/b
orthorhombic53 7.417 4.945 2.547 1.500
orthorhombic54 7.400 4.930 2.534 1.501
orthorhombic55 7.410 4.940 2.555 1.500
hexagonal53 8.420 4.560 —— 1.846
hexagonal56 8.400 4.800 2.400 1.750
§Setting angle57ϕ=43°
Table 1.1. Unit cell parameters of the orthorhombic and hexagonal phases of PE
Molecular modelling is an alternative method to study the relation between microscopic characteristics like the chemical composition and the macroscopic properties of these systems. By molecular simulations it is also possible to determine the temperature dependence of mechanical and structural properties such as elastic constants, thermal expansion coefficients, lattice parameters, etc.
Martoňák et al.58 studied the nature of the crystalline phases of PE in the temperature range from 10 to 450 K at zero pressure by means of a series of Monte Carlo simulations of the crystalline phases of PE. They used a full atomistic force field with flexible valence bonds and angles where the hydrogen atoms are explicitly treated.
The simulations were carried out in the NpT ensemble, the pressure components in each direction x, y and z of the system were controlled by scaling the box lengths and particle positions. Additionally, the use of infinite chains was introduced; the ends of each chain were artificially eliminated by connecting the chain ends through the periodic boundary conditions of the simulation box. The length of the chains of the studied systems was 12 and 96 for the smallest and largest system, respectively. In all cases the “herringbone”
§ Angle between the xy projection of a C-C bond and the a-axis.
arrangement of the chains was stable, even at 450 K, which is higher than the experimental melting temperature of crystalline PE Tm=414 K. The stabilization of crystalline phases of polyethylene above its melting temperature was attributed to the use of periodic boundaries and semi-infinite chains in the simulation
Martoňák et al. observed that at temperatures above 250 K, the lattice parameters a and b experience a linear increase with temperature, and that the quotient a/b increases from 1.44 slowly at first at low temperature and then, near 350 K, abruptly increases until it reaches a value of 1.73. The increase of the ratio a/b is due to the fast increase of a, whereas b grows slowly until reaching a maximum at 350 K and then decreases at higher temperatures. Around 500 K the crystal showed a hexagonal structure, where each chain was surrounded by six chains and the quotient a/b was close to the theoretical value 1.73.
In a more recent study the MC simulation results of Martoňák et al. of the structural and elastic properties of crystalline PE were compared against the predictions of a self-consistent quasi-harmonic lattice dynamics approach59. Both approaches were compared in their classic and quantum version. At temperatures below 2/3 of the melting temperature of polyethylene Tm ~ 250 K, both approaches yield results consistent with the empirical force model used. The model was hybrid, with valence terms similar to the ones used by Karasawa et al.60, but parameterized to emulate the model of Sorensen et al.61. Quantum effects were important for temperatures lower than 300 K. Above this temperature anharmonic effects become important.
Ryckaert and Klein62 performed molecular dynamics simulations with a full atoms model for temperatures between 100 and 400 K to study the effect of the temperature on the inter-chain packing of n-alkanes in solid phase. Systems of semi- infinite chains, composed by 16 carbon atoms each, initially centered on an orthorhombic structure, were simulated in NpT and NpH ensembles. The orthorhombic structure was stable up to about 325 K. Nevertheless, at 375 K the character of the solid changed; liquid-like diffusion occurred along the orientation of the chains. No transition from the orthorhombic to the hexagonal phase was observed even at 400 K.
Later Ryckaert et al.63,64 performed molecular dynamics simulations in order to characterize the structure and dynamics of the solid phases of bi-layers of n-alkane tricosane (C23H48). The simulations were made in the NpT ensemble at zero pressure using the Parrinello-Rahman method65. The intramolecular component of the used model consists of three terms a bond term, bending and torsion terms. Intermolecular
19 interactions between methyl groups were represented with by an exp-6 function. In the crystalline orthorhombic phase at 311 K translational, rotational and torsion motions of chains were detected, but all chains remained in a trans configuration in a herringbone arrangement. In contrast to the orthorhombic phase, a notable increase of longitudinal motions and gauche defects was detected in the pseudo-hexagonal rotator phase at 315 K, where each chain exhibits four well-defined orientations. The gauche defects concentrate mainly at the end groups of the chains.
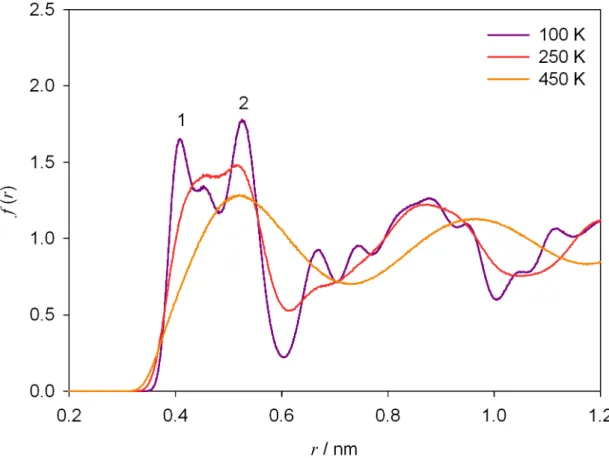
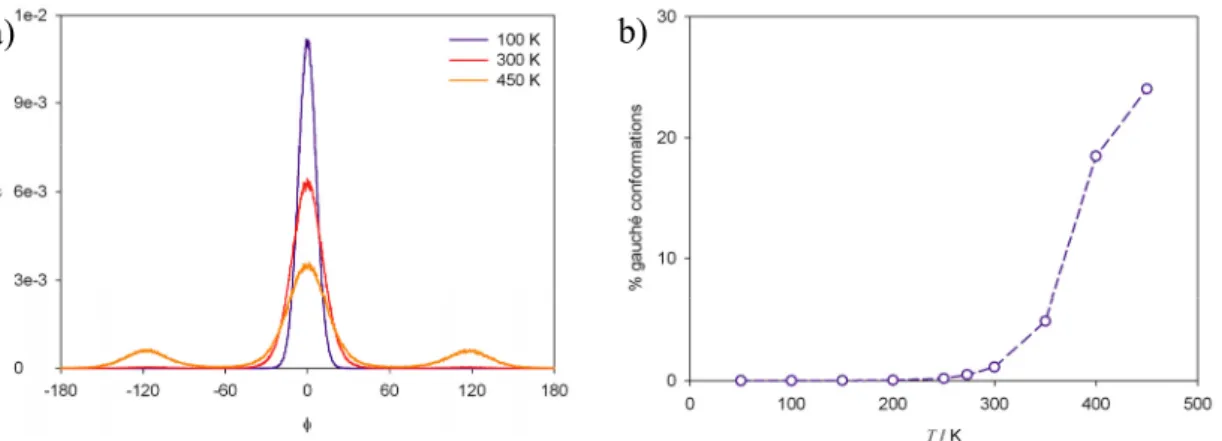
Mavrantza et al.57 performed molecular dynamics simulations in NpT ensemble to investigate the configurational and structural properties of the orthorhombic phase of PE and odd-numbered paraffins in the temperature range from 100 K to 298 K. The results corroborated previous experimental and simulation information about the herringbone arrangement of the chains and the crystalline phases of PE in the range of temperature studied. Below 273 K a little amount of gauche defects (< 0.01 %) was detected in the crystal of finite chains C23H48, while at higher temperature the concentration of defects experimented a notably increase. Any gauche defects were observed below 300 K for the PE crystal of semi-infinite chains.
1.2.3 Glass Transition in Polymers
The glass state is characteristic of systems that contain long chains or systems that form temporary or permanent networks, metallic alloys and polymer melts are some examples of them. When such a system, glass-former, is cooled down enough fast below its melting temperature, Tm, its dynamics becomes so slow that the system cannot reach the lower energy crystalline structure. Thus, the system conserves the disordered structure of the liquid when solidifies and forms a glass66.
The glass phase is sometimes considered a permanent non-equilibrium state of higher volume and enthalpy with respect to the crystalline structure at the same temperature.
In contrast to systems which crystallize, the density of glass-formers evolves continuously at the melting temperature. This behavior is related to the similarity of the glass structure and the structure of the liquid. The Figure 1.7 shows the typical thermal behavior of the density of a glass-former and of a system that crystallises. When a system is slowly cooled down from the liquid state its density continuously increases.
Near the melting temperature the density experiences a sharp increase, because the
atoms/molecules of the system are reordered in a crystalline structure, the latter evolution of the system corresponds to the cooling of a crystal. Glass-formers exhibit a different thermal behavior under cooling: Below the melting temperature they tend to remain in liquid state. The undercooled liquid solidifies when the glass transition temperature is reached. At this point the thermal expansion coefficient changes, but the density continuously increases.
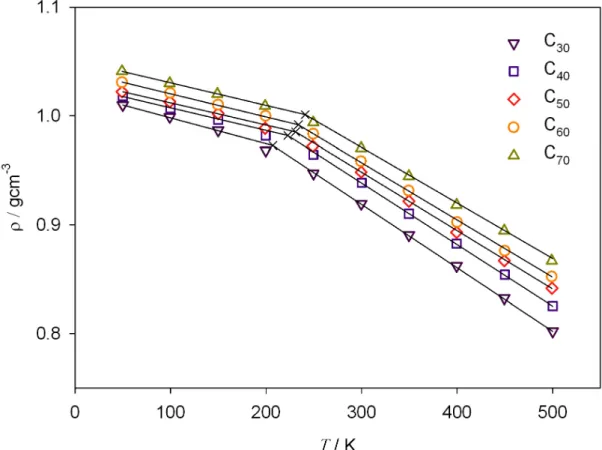
A simple method to detect the glass transition is through the change of the thermal expansion coefficient67-70. The point where the density lines of the glass and liquid states intersect determines Tg (Fig. 1.7).
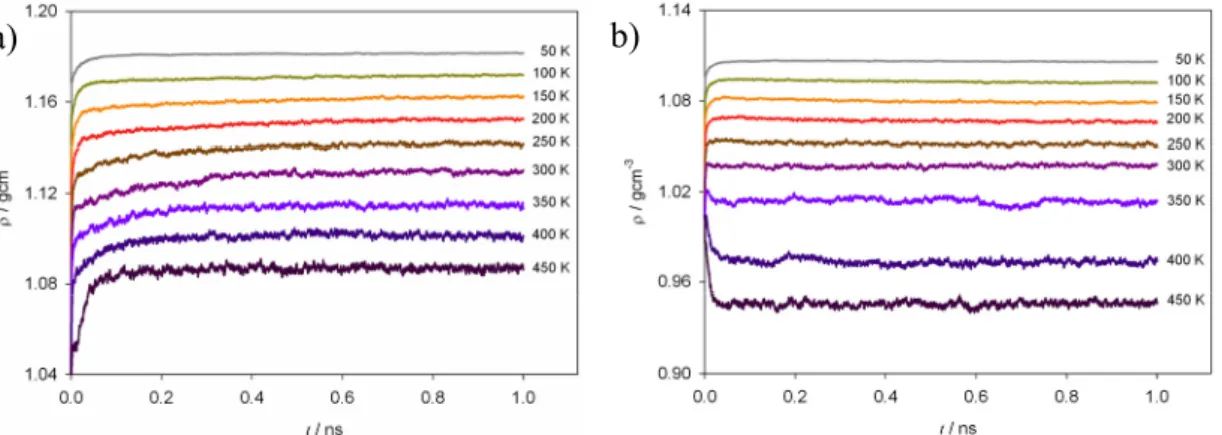
Figure 1.7. Density-temperature phase diagram of UAM model for polyethylene. The liquid glass line was calculated here by NpT simulations of C70 linear chains at p=0 starting from a disordered initial configuration at T=450 K, the system is equilibrated at each temperature and cooled down at relative high cooling rate. The line correspondent to the crystalline state was obtained by simulations of semi- infinite chains starting from an ordered state. The melting temperature indicated by dashed line corresponds to an experimental value of polyethylene.
The changes in self-diffusion coefficient and in the heat capacity are also good indicators of the glass transition33. The frequency of trans-gauche conformational transitions is another property of the system which sensible changes at the glass transition. Conformation changes in linear polymers can be monitored in a simulation
21 through the calculation of the averaged end-to-end distance of the chains; as the liquid is cooled down it increases until reaching a plateau in the vitreous zone71.
An interesting characteristic of the vitreous state is the dependence of the properties of the system to the production history, for example, to the cooling rate and/or the compression rate. The history-dependence of the properties of glass-formers can be qualitatively explained as follows; when a system is cooled at constant rate υ along the cooling curve T =T0 −υt it will take a time Δt =ΔTυ−1 in visiting each temperature. Above the glass transition temperature this time interval is enough so that the system reaches the equilibrium at each visited temperature due to the short relaxation time of a liquid; τ(T)<ΔTυ−1. However, near the glass transition temperature the dynamics of the system slows down and then the relaxation time increases τ
( )
Tg ≈ΔTυ−1. At a given temperature the time of relaxation of the system and the interval of simulation are comparable, further cooling takes the system to non- equilibrium states72. This fact leads to another of the definitions of the glass transition temperature33: as the temperature where the relaxation times of the system are of the order of 102 to 103 s.Microscopically, polymers tend to form glasses. The structural nature of polymer glasses, their entangled chain arrangement and packing, hinder an adequate sampling of the phase space. They show a non-ergodic behavior. Their relaxation on longer time intervals is possible due thermal motions in regions of lower packing and higher mobility.
The dependence of the vitreous transition temperature on the cooling rate can be deduced from the empirical Vogel-Fulcher-Tammann68 (VFT) equation
⎟⎟⎠
⎜⎜ ⎞
⎝
⎛
= −
0
exp )
( T T
A B
τ T . (1.29)
It relates the relaxation time of a system to the temperature. From this equation an expression for the glass transition temperature is obtained upon considering that the relaxation time of the system and the simulation time interval become comparable at this point τ
( )
Tg =ΔTυ−1( )
Cυ T BTg = 0 −ln . (1.30)