Single-Molecule Detection
Advances in Optical Single-Molecule Detection:
En Route to Supersensitive Bioaffinity Assays
Zdeneˇk Farka+, Matthias J. Mickert+, Mateˇj Pastucha, Zuzana Mikusˇov#, Petr Skl#dal, and Hans H. Gorris*
AngewandteChemie
Keywords:
digital assays · immunoassays · optical detection ·
signal background · single-molecule detection
How to cite: Angew. Chem. Int. Ed.2020,59, 10746–10773 International Edition: doi.org/10.1002/anie.201913924 German Edition: doi.org/10.1002/ange.201913924
1.Introduction
The ability to detect individual molecules—at first sight—
holds the promise to reach the ultimate sensitivity. Thus, it is not surprising to see a surge in the number and variety of single-molecule approaches. While there have been many review articles on the advantages of single-molecule fluores- cence spectroscopy in the field of biophysics,[1]more recent reviews have discussed the potential and limitations of single- molecule applications for analytical chemistry.[2]Our Review is focused on single-molecule bioaffinity assays and does not cover similar techniques for fundamental biophysical or biomolecular research. Furthermore, it was necessary to limit the Review to optical single-molecule techniques. Other emerging single-molecule applications of electrochemical[3]
and force-based techniques[4]can be found elsewhere. As the labeling technique is the key element for the ability to detect a single analyte target molecule, the structure of the Review follows different types of optical detection labels. We have also included illustrative examples of label-free optical techniques reported for single-molecule assays.[5]
Most bioaffinity techniques rely on antibodies, though aptamers or molecularly imprinted polymers (MIPs)[6]have also been used to specifically bind and capture an analyte of interest. Antibodies can be generated with high specificity against almost any analyte. Only the affinity ceiling limits their binding constant to approximately 1010m@1,[7] which is much lower than that of (strept)avidin–biotin binding (1014m@1).[8]Since antibodies are rather large, cameloid anti- bodies that consist only of a single binding site have attracted some attention. The advantage of aptamers is the easy large- scale production, whereas MIPs stand out for their high chemical stability. MIPs are especially useful for the detection of small molecules with a rigid structure. MIPs, however, seem less suitable for the detection of structurally flexible analytes such as proteins.
For detecting the binding event, two approaches can be distinguished: 1) In label-free assays, the binding of the
analyte to the detection element results in a signal change that can be directly measured. 2) In the so-called sandwich format, a second affinity reagent, which carries a signal-generating label, binds to the analyte. As a detection label can strongly amplify the signal, this approach is more amenable for implementing single-molecule assays. The first immunoassays used radioactive labels,[9]but enzyme labels have gradually replaced radionuclides for safety reasons and because each enzyme label generates thousands of measurable product molecules (intrinsic signal-amplification step). The enzyme- linked immunosorbent assay (ELISA) is still considered to be the gold standard for the quantitative measurement of various analytes ranging from clinical diagnosis to environmental applications not the least because it is relatively easy to perform.
The ability to detect low concentrations of analytes and in particular low-abundance biomarkers is of fundamental importance, e.g., for early-stage disease diagnosis. The prospect of reaching the ultimate limit of detection has driven the development of single-molecule bio- affinity assays. While many review articles have highlighted the potentials of single-molecule technologies for analytical and diagnostic applications, these technologies are not as widespread in real-world applications as one should expect. This Review provides a theoretical background on single-molecule—or better digital—assays to critically assess their potential compared to traditional analog assays. Selected examples from the literature include bioaffinity assays for the detection of biomolecules such as proteins, nucleic acids, and viruses. The structure of the Review highlights the versatility of optical single- molecule labeling techniques, including enzymatic amplification, molecular labels, and innovative nanomaterials.
From the Contents
1.Introduction 10747
2.Enzyme Labels 10750
3.DNA Labels for PCR
Amplification 10752
4.Fluorescent Molecular Labels 10753 5.Nanoparticle Labels 10757
6.Bead Labels 10763
7.Label-Free Detection 10765 8.Summary and Outlook 10766
[*] Dr. Z. Farka,[+]M. Pastucha, Z. Mikusˇov#, Prof. Dr. P. Skl#dal CEITEC – Central European Institute of Technology Masaryk University
625 00 Brno (Czech Republic)
M. J. Mickert,[+]Priv.-Doz. Dr. H. H. Gorris
Institute of Analytical Chemistry, Chemo- and Biosensors University of Regensburg
Universit-tsstraße 31, 93040 Regensburg (Germany) E-mail: hans-heiner.gorris@ur.de
M. Pastucha, Z. Mikusˇov#, Prof. Dr. P. Skl#dal Department of Biochemistry, Faculty of Science Masaryk University
625 00 Brno (Czech Republic)
[++] These authors contributed equally to this work.
The ORCID identification number(s) for the author(s) of this article can be found under:
https://doi.org/10.1002/anie.201913924.
T 2019 The Authors. Published by Wiley-VCH Verlag GmbH&Co.
KGaA. This is an open access article under the terms of the Creative Commons Attribution Non-Commercial License, which permits use, distribution and reproduction in any medium, provided the original work is properly cited, and is not used for commercial purposes.
Over the last 60 years, the development of immunoassays has been mainly driven by making measurements more sensitive, specific, and reproducible. While conventional ELISAs can measure picomolar concentrations of analytes, higher sensitivities are required because even few molecules of toxins can be harmful,[10]individual pathogens can initiate an infectious disease,[11]and trace amounts of a cancer marker indicate the beginning of a malignant transformation.[12]
Additionally, the development of more sensitive immuno- assays is essential for the discovery of new potential biomarkers that are not accessible using current diagnostic tests.[13]
A conventional ELISA is performed in a laboratory and requires several washing steps and relatively long incubation times. Thus, the second line of immunoassay development has aimed at a faster throughput using lower sample volumes, and assays that can be performed directly at the site of sample collection (on-site testing), for example, at the bedside for diagnostic tests,[14]or in the field for environmental and food products applications. In diagnostics, such assays are com- monly known as point-of-care (POC) tests.[15] Minimally invasive sample collection methods, for example, from urine or saliva, and no washing steps are preferred to maintain the user-friendly operation of POC tests. The most famous antibody-based POC test is the home pregnancy test, a very successful example of a lateral flow assay (LFA) first described in the 1980s.[16] The wide acceptance and user- friendliness is a precondition for POC methods to become a cornerstone in the predictive, preventive, personalized, and participatory medicine, commonly termed P4 medicine.[17]
The family of bioaffinity assays, in particular immuno- assays, can be subdivided depending on the detection label as shown in Figure 1. 1) Enzyme labels represent the central branch and continue to be the most common detection route.
2) Fluorescent molecular labels are in principle easier to implement because the detection antibody is directly labeled with a fluorophore and no enzymatic amplification step is necessary. The simplest form, the fluorescence immunoassay (FIA), however, is limited by background fluorescence with- out the advantage of enzymatic amplification. In addition to the direct intensity-based fluorescence detection, this scheme was adapted for signal amplification (e.g. by Immuno PCR) or for the development of homogeneous assays using fluores- cence polarization. Nevertheless, the non-zero background of fluorescence remains. A decisive breakthrough was the development of time-resolved (TR) detection by employing lanthanide-based labels that display a long lifetime (micro- seconds) compared to organic fluorophores (nanoseconds).[18]
In a time-gated approach, after luminescence excitation, the signal acquisition is delayed by a few microseconds to let the autofluorescence signal decay, and only the specific signal of the lanthanide is recorded. The TR-FIA is a background-free optical detection method that, however, requires a more sophisticated instrumental setup. The dissociation-enhanced lanthanide fluorescent immunoassay (DELFIA) is the most prominent TR-FIA system on the market.[19]
Nanoparticles (NP) currently constitute the most rapidly branching labeling strategy for immunoassays.[20] Colloidal gold has been used for the readout of LFAs. Due to their plasmonic properties, gold nanoparticles (Au NPs) strongly absorb and scatter light such that a direct color read-out by eye is possible, and the user is able to make a yes/no decision.
In the meantime, the use of NPs in immuno- and other bioaffinity assays has experienced a fast growth as a result of concurrent progress in nanomaterials research. Plasmonic NPs are now in widespread use, but also other NPs and nanocomposites have been designed that enable a convenient optical readout. For example, quantum dots (QDs) are Zdeneˇk Farka received his PhD in structural
biology in 2017 under the supervision of Petr Skl#dal at the Central European Institute of Technology (CEITEC), Masaryk University (Brno, Czech Republic). He completed research internships at the University of Regensburg (Germany) with Hans-Heiner Gorris and at the University of Rouen (France) with Niko Hildebrandt. He is cur- rently working as a Senior Researcher at CEITEC. His research interests include the detection of proteins and bacteria via various immunoanalytical techniques.
Matthias J. Mickert is a PhD student at the Institute of Analytical Chemistry, Chemo- and Biosensors of the University of Regens- burg in the group of Hans-Heiner Gorris.
His research interests include single-molecule enzyme kinetics in femtoliter arrays and the development of digital immunoassays using photon-upconversion nanoparticles as back- ground-free luminescent labels. He is speci- alized in the surface modification, character- ization, and imaging of upconversion nano- particles.
Mateˇj Pastucha is a PhD student of bio- chemistry at Masaryk University. He received a Master’s degree in analytical biochemistry in 2015 and is currently pursuing his PhD under the supervision of Petr Skl#dal. His research focuses on the development of immunochemical assays and sensors for the detection of proteins and bacteria. This includes antibody immobilization to diverse substrates, their conjugation with nanoparti- cles or other labels, and detection utilizing optical or electrochemical readout.
Zuzana Mikusˇov# graduated with a degree in biotechnology at the Slovak University of Technology in Bratislava in 2014. She is now a PhD student under the supervision of Petr Skl#dal at Masaryk University. She is cur- rently focusing on immunosensing in the electrochemistry field as well as the immu- nocytochemistry of cells, both using nano- particles as labels.
a better alternative to organic fluorophores because they are more photostable and brighter, which is an important feature for single-molecule applications. Photon-upconversion nano- particles (UCNPs) are another emerging class of labels that can be excited by near-infrared light and emit shorter- wavelength light. The anti-Stokes emission prevents auto- fluorescence and light scattering and thus allows for an optical readout without background interference.[21] The back- ground-free detection renders UCNPs an excellent candidate for single-molecule applications.[22] Furthermore, nanocon- tainers such as liposomes can be filled with large numbers of fluorophores to generate a strong signal. In contrast to enzyme labels that generate the fluorophores in situ, the encapsulated fluorophores are released on demand from the nanocontainer to avoid self-quenching inside the confined environment.[23]There are also mixed detection schemes, e.g., in the form of electrochemiluminescence that generates a strong signal without background.
All three branches shown in Figure 1 have now blossomed into single-molecule assays as a consequence of innovative assay designs as well as advances in instrumental techniques, detector sensitivities and data processing capabilities. In simple terms, single-molecule assays can be considered as the result of driving conventional assays to the highest sensitivity—either by increasing the specific signal to very high levels or by background reduction. Therefore, any standard analytical method can, in principle, reach “single- molecule sensitivity” but background interference such as matrix effects, readout noise or non-specific binding typically prevents it.
It is furthermore essential to understand that the ability to detect a single molecule is not synonymous with the most
sensitive analytical assay. For example, some immunoassays from the pre-single-molecule era actually had higher sensi- tivities than current single-molecule assays.[24]If we shift our attention from the detection of a single molecule as the
“ultimate” sensitivity to the distinct readout mode, however, it becomes clear that single-molecule detection is a unique and powerful tool for background reduction. Since the signal of a single detection label can be reliably distinguished from the background noise of the instrument and reagents, the measurement is completely independent of background fluctuations. Thus, the term “digital assay” (as opposed to a conventional “analog assay”) is a much better description of the advantages conferred by single-molecule detection in analytical chemistry. The digital readout, in turn, makes the measurement more robust and thus indirectly leads to lower detection limits.
The signal-to-noise (S/N) ratio determines whether a single molecule can be detected or not. The strength of the specific optical signal depends on the type of label and can be strongly amplified, as discussed in the next section. In a digital assay, however, each detectable response is derived from a single analyte molecule, and thus the specific signal strength is ultimately fixed. The only option to assure single- molecule detection is the reduction of the background signal, which decreases with the detection volume. This problem has been extensively discussed for fluorescence spectroscopy, one of the earliest and most important methods for single- molecule detection, but similar considerations also hold for nonfluorescent single-molecule detection methods. Fluores- cent molecules are capable of generating a strong signal because each fluorophore can emit up to a million photons before it finally photobleaches. Fluorescence excitation, however, also leads to an optical background signal due to autofluorescence and light scattering.[25]In order to observe a single fluorescent molecule, it is essential to reduce the detection volume to a femtoliter (fL) volume—commonly by using confocal microscopy, fluorescence correlation spectros- copy (FCS), or total internal reflection microscopy (TIRF).
The requirement for a very small detection volume is associated with two closely related problems that must be addressed in order to achieve higher sensitivity with digital assays. The first problem is analyte sampling. At very low analyte concentrations, there are not enough molecules present in an analyte sample to reach the detection volume by diffusion on a reasonable timescale. For example, it was estimated that it takes on average more than ten minutes for a molecule present in a concentration of 1 fm to reach a detection volume of 10 fL by diffusion.[26] Stochastic fluctuations are the second problem.[27] At low analyte concentrations, a small observation volume is randomly at one time occupied by a single analyte molecule and, at another time, empty. The so-called Poisson noise ((pn)/n) depends on the number of counted events (n) and is negligible in conventional analog assays wherenis very large. For digital assays, however, it presents a problem because a single detection event of an analyte molecule does not contain enough analytical information. Therefore, it is necessary to make either many parallel measurements on a larger area or many sequential measurements in the same detection volume.
Petr Skl#dal is an Associate Professor and Head of the Department of Biochemistry, Faculty of Science, Masaryk University. He received his PhD in the field of amperomet- ric biosensors in 1992. After research stays (1991, 1993) at the University of Florence (Italy) with Marco Mascini, he continued to investigate biosensors at Masaryk University.
He currently also heads the Nanobiotechnol- ogy Research Group at CEITEC. His research interests include enzymatic and immunochemical biosensors using electro- chemical and piezoelectric transducers.
Hans-Heiner Gorris studied biology at the University of Mfnster (Germany) and obtained his PhD degree from the University of Lfbeck (Germany). After working on single-molecule enzyme assays with David Walt at Tufts University (USA), he joined the Institute of Analytical Chemistry, Chemo- and Biosensors at the University of Regensburg (Germany) in 2009. He has been a Heisenberg-Fellow of the DFG since 2016. His research interests include back- ground-free luminescent bioaffinity assays based on UCNPs with single-molecule sensi- tivity as well as new methods for investigating enzyme kinetics at the single-molecule level.
2.Enzyme Labels
ELISA has been successfully transformed into single- molecule immunoassays. The generation of thousands of fluorescent molecules per enzyme label molecule multiplied by up to a million photons per fluorophore generates a very strong signal that can be detected by simple wide-field fluorescence microscopy. In particular,b-galactosidase from Escherichia coli is an excellent enzyme label for single- molecule applications because it is robust and can turn over up to 1000 substrate molecules per second. Based on this strategy, Rotman[28] reported the very first single-molecule experiment already in 1961. The enzymatic substrate turn- over, however, is a kinetic process and requires time, which leads to product diffusion. Consequently, the signal is not detectable at the same location as the analyte. There are two options to spatially allocate the signal to the analyte.
2.1.Assays Based on Localized Product Deposition
In the easiest case, the enzymatic reaction generates a product that precipitates around the analyte. The group of Suzuki[29]designed a digital sandwich immunoassay on beads
by using a conjugate of detection antibody and horseradish peroxidase. The enzyme label converted a fluorescence- labeled tyramide substrate to a short-lived radical which immediately coupled the fluorescent labels only to the analyte-bearing beads. This led to a high local fluorescence signal at the site of analyte binding. It was noted, however, that the detection of the tyramide signal on the beads by flow cytometry was less efficient than that of digital ELISAs in confined environments.
2.2.Assays in Confined Environments
Alternatively, the enzyme label converts a substrate to a soluble fluorescent product. In this case, the reaction must be confined in a very small compartment in order to prevent product diffusion.[30] The concentration of the reaction product exceeds the detection threshold in small confined volumes. For example, a single molecule ofb-galactosidase enclosed in a volume of 50 fL (50mm3) can produce a fluo- rophore concentration of 2mmin 1 min, which can be easily detected via conventional epifluorescence microscopy.[31]
Enzymatic reactions were confined in water-in-oil emulsion[28]
or microfluidic droplets, fused silica capillaries,[32] virus Figure 1. Progress in the development of immunoassays using optical detection schemes towards single-molecule detection. Radioisotopes were replaced by labels based on enzymes, fluorescent molecules, and nanoparticles. Through the choice of an appropriate readout method, all these labels can be exploited for measurement at the single-molecule level.
capsids,[33]lipid vesicles,[34]or so-called femtoliter arrays. In particular, femtoliter arrays and water-in-oil microfluidic droplets have found analytical applications.
2.2.1.Femtoliter Arrays
Femtoliter arrays consist of a large number of homoge- neous wells fabricated in the surface of optical fiber bun- dles,[35] fused silica slides,[36] or polydimethylsiloxane (PDMS).[37] The Walt group[38] pioneered single-molecule immunoassays based on a fluorogenic enzymatic reaction in femtoliter arrays, which was commercialized by Quanterix. In the so-called Simoa platform (single-molecule arrays, Figure 2), magnetic beads with a capture antibody were dispersed in a sample. The bead concentration was typically much higher than the analyte concentration. The beads were magnetically separated and incubated with a biotinylated antibody, followed by the addition of a streptavidin–b- galactosidase conjugate. A high bead-to-analyte ratio resulted in a small fraction of beads labeled with a single enzyme molecule and a large excess of unlabeled beads. The beads were loaded with a fluorogenic substrate onto a femtoliter array and sealed with a gasket or oil film. A highly fluorescent product accumulated only in wells that contained a bead with a bound analyte molecule. The analyte concentration was determined digitally by counting the number of fluorescent wells. Prostate-specific antigen (PSA) and tumor necrosis factor-a (TNF-a) were detected with a limit of detection (LOD) of 1.5 fgmL@1(&50 am) and 2.5 fgmL@1(&150 am), respectively. Other clinically relevant analytes included cancer biomarkers,[39] urinary biomarkers,[40] p24 protein of HIV,[41] and the neurofilament light chain protein (NFL),
a neuronal injury marker of various neurodegenerative conditions and brain injuries. Traditionally, cerebrospinal fluid must be obtained for analysis by lumbar puncture because the concentration of NFL in the blood is too low for a conventional ELISA. Shahim et al.[42]developed an ultra- sensitive immunoassay with an LOD of 0.29 pgmL@1, which enabled NFL measurements in the serum of healthy subjects.
Olivera et al.[43] determined tau protein in blood plasma (LOD of 0.012 pgmL@1) to examine the relationship between increased tau protein levels and chronical neurological and psychological symptoms in military personnel after a trau- matic brain injury. The ultrasensitive detection of biothreats such as ricin has also been demonstrated.[44]
The Noji group[45]developed larger arrays of one million femtoliter wells. Counting a very high number of individual immunocomplexes in the arrays reduced the Poisson noise.
The assay was employed for the detection of PSA with an LOD of 60 agmL@1(&2 am). The authors also showed that the digital assay in femtoliter arrays is amenable to multi- plexing by using two different enzyme/substrate labels.[46]
Recently, a competitive femtoliter array format was demonstrated for the detection of small molecules such as cortisol in saliva.[47] The assay achieved an IC50 down to 0.42 ngmL@1, which was 44 times lower than for a conven- tional ELISA.
2.2.2.Microdroplets
Different methods for the generation of water-in-oil microdroplets have been reviewed earlier.[30] Water-in-oil droplets enclose the reactants and the product into pico- to femtoliter volumes. While microdroplets generated by emul- sification methods tend to be rather heterogeneous, more homogeneous microdroplets can be generated and handled by microfluidic devices. Micro- fluidic droplets separate the reactants from the liquid substances, reduce the assay volume, and enable rapid han- dling, which increases the assay throughput.[48] Microfluidic droplets have also been used to study single enzyme molecule reactions[49] and single cells.[50]
Water-in-oil femtoliter droplets generated by a microfluidic device were used to establish a bead-based ELISA (Figure 3).[51] A capture anti- body on the surface of polystyrene beads immobilized PSA. The presence of PSA was then detected by a biotin- ylated detection antibody and a strep- tavidin–b-galactosidase conjugate using fluorescein-di-b-d-galactopyra- noside (FDG) as the substrate. The enzyme product fluorescein was recorded by fluorescence microscopy while the beads were identified and counted based on their red autofluor- Figure 2. Single-molecule ELISA assay in femtoliter arrays. a) Many magnetic beads coated with
capture antibody are dispersed in the analyte sample. After an analyte molecule has been caught, a biotinylated antibody forms the sandwich complex and serves as an anchor for a streptavidin- modifiedb-galactosidase. b) The beads are loaded—together with a fluorogenic substrate—onto a femtoliter array and sealed by a PDMS gasket. c) Scanning electron microscopy shows that only one bead is loaded per femtoliter well. d) Fluorescence microscopy records the fluorescence increase in wells that contain a bead with a captured analyte molecule. Reprinted with permission from ref. [38]. Copyright 2010 Nature America.
escence. The microdroplet assay achieved an LOD of 46 fm and a linear range of 0.046–4.62 pm.
Liu et al.[52] developed another type of enzyme-linked immunoassay on magnetic beads for single-exosome counting in microdroplets (droplet digital ExoELISA). Magnetic beads were equipped with an anti-CD63 antibody to capture exosomes. After sample incubation, a biotinylated detection antibody and a streptavidin–b-galactosidase conjugate were added to the beads. The beads were enclosed in 40mm droplets (&33 fL) containing FDG. The fluorescence increase of fluorescein was detected in each droplet contain- ing a magnetic bead with captured exosome. A bead-to- droplet ratio of 0.3 was employed to ensure that only one magnetic bead was enclosed in a given droplet. The assay achieved an LOD down to 10 enzyme-labeled exosome complexes per microliter (&10 am).
An competitive bead-based immunoassay utilizing micro- droplets was reported for the detection of a-fetal protein (AFP).[53] AFP was captured by antibody-coated magnetic beads followed by the addition of a biotinylated detection antibody and a streptavidin–b-galactosidase conjugate. After magnetic separation, the unbound streptavidin–b-galactosi- dase was injected into a microfluidic chip to generate microdroplets with FDG. The microdroplets were collected into a microtiter plate and fluorescent droplets containing free streptavidin–b-galactosidase were counted under a fluo- rescence microscope. This indirect digital concentration readout reached an LOD in the fmconcentration range.
The Di Carlo group[54] developed a microfluidic digital homogeneous entropy-driven biomolecular assay (dHEBA) for the detection of influenza A. Upon nucleoprotein binding, nucleic acid labeled antibodies formed a catalyti- cally active complex that drove a hybrid- ization/displacement reaction on a multi- component nucleic acid substrate and gen- erated many fluorescence-labeled oligonu- cleotides. The dHEBA format enabled the detection of influenza A nucleoprotein in a concentration of 4 am in approximately 10 min without the need for a purification step.
3.DNA Labels for PCR Amplification
The polymerase chain reaction (PCR) amplifies DNA—in principle starting from a single template strand—exponentially to very high copy numbers of DNA.[55]Drop- let microfluidics on a microchip enables the rapid isolation of single DNA strands and subsequent PCR amplification in pico- or femtoliter reaction containers.[56]For exam- ple, a digital PCR was performed in rota- tional chips to detect viral RNA isolated from single HIV viruses.[57]Wells of differ- ent volumes were employed in the chip to enable quantification over a wider dynamic range. The assay achieved an LOD of 40 RNA molecules per mL.
Similar to the digital readout of single enzyme molecule labels, a digital immuno-PCR can be implemented if the PCR reaction is enclosed in microdroplets. The droplet-based digital immuno-PCR (ddIPCR) used magnetic beads as a solid support, DNA as a marker and PCR for signal amplification, for example, for the detection of PSA.[58]The ddIPCR was performed in three steps as shown in Figure 4.
First, the PCR reaction mixture was emulsified to generate tens of thousands of water-in-oil droplets per microchip.
Subsequently, the samples underwent thermal amplification cycles and the number of positive droplets was determined by end-point fluorescence detection. In the last step, the number of DNA copies was calculated based on the Poisson distribu- tion. The ddIPCR can usually improve the LOD by 100- to 10000-fold compared to a standard ELISA. It was noted, however, that the washing steps and the microfluidic droplet system cannot be easily combined. The LOD for PSA was 0.48 ngmL@1 with a linear range of 0.5–30 ngmL@1. The concentration analysis of human serum samples correlated well with a commercial reference immunoassay.
The digital PCR was combined with a proximity ligation assay (PLA) to improve the precision of the assay.[59]Target proteins such as the cytokine IL-6 were immobilized on magnetic beads and detected by two types of DNA-modified antibodies that are capable of forming a pair of PLA probes.
If both antibodies bound to the protein, the PLA probes were Figure 3. Scheme of single-molecule immunoassay in femtoliter-sized droplets. a) Antibody–
antigen complex formation on beads. b) Beads with or without immunocomplex are encapsulated in droplets with the substrate and incubated on chip in traps to collect the fluorescent products of single-enzyme labels. c) Three droplet populations can be distin- guished: i) droplets without a bead, ii) those containing a bead without immunocomplex, and iii) those containing both a bead and immunocomplex, which exhibit a positive fluorescence signal due to the enzymatic activity of a singleb-galactosidase label. Reprinted with permission from ref. [51]. Copyright 2013 American Chemical Society.
joined by DNA ligation. The ligated DNA reporter strand was then amplified by rolling circle amplification, and the amplified DNA was detected via fluorescent DNA probes.
Because standard rolling circle amplification is not quantita- tive, the ligated DNA strands were compartmentalized individually by using a microfluidic device, and the protein concentration was determined digitally by counting fluores- cent microdroplets.
4.Fluorescent Molecular Labels
The detection of molecular labels at the single-molecule level relies on fluorescence spectroscopy and microscopy.
Confocal microscopy and total internal reflection microscopy (TIRF) efficiently reduce the detection volume and the concomitant background signal, which enables the detection of single fluorescent label molecules. When crossing a focused laser beam in a confocal microscope set-up, individual fluorophores emit bursts of photons that are detected.[60]
The residence time depends on the diffusion of the fluoro- phore through the beam path (with a typical active volume of a few femtoliters) and on photobleaching. Cyanine dyes were proposed for such applications as the excitation within 650–
700 nm is well compatible with the spectral window of low light scattering and autofluorescence of biological substances including blood. Even epifluorescence has more recently been reported to enable single-fluorophore detection. How- ever, the type of microscopy is not relevant for the assay design as long as it allows for the detection of a single fluorescent molecule. Thus, we have organized this section according to different assay formats. Fluorescence counting of single protein analyte molecules immobilized on a surface by
capture antibodies seems in gen- eral to be more sensitive than correlation techniques in solu- tion.
4.1.Detection of Surface-Bound Analytes
Lçscher et al.[61] developed a sandwich assay for the detec- tion of single cardiac actin mol- ecules. The scanning system employed a single-photon-count- ing avalanche photodiode together with a CCD camera for imaging under 635-nm laser excitation. A glass surface was coated with a cellulose layer to reduce nonspecific binding. Con- focal microscopy reduced the optical background by minimiz- ing the detection volume, which enabled the evaluation of photon bursts originating from individ- ual molecules.
A particular kind of bioaffinity assay, the so-called pull- down assay, has been used for the identification of protein–
protein interactions. The Ha group[62] developed a single- molecule pull-down assay (Figure 5). A capture antibody was immobilized in a flow chamber coated with polyethylene glycol (PEG) and biotin. Streptavidin was added to the flow chamber, followed by the addition of a biotinylated anti-His antibody, which captured overexpressed His6-tagged yellow fluorescent protein (YFP) from cell extracts. Individual YFP molecules were detected by TIRF microscopy. A stepwise decrease of the fluorescence intensity during single-molecule bleaching experiments enabled the identification of dimeric and trimeric YFP molecules. Individual protein kinase A (PKA) complexes were detected by a two-color single- molecule pull-down assay. In its inactive form, PKA is present as a tetramer that consists of two catalytic and two regulatory subunits. Cyclic adenosine monophosphate (cAMP) activates the enzyme and leads to tetramer dissociation. The inves- tigation of the stoichiometry of individual PKA complexes is essentially not possible using conventional analog detection.
Burgin et al.[64]developed a single-molecule assay for the detection of enhanced green fluorescent protein (EGFP) and tumor suppressor protein p53. A microfluidic chip was mounted onto a TIRF microscope under 473-nm laser excitation. Two methods for absolute protein quantification were used for the digital readout. In the accumulation method (Figure 6a), the analyte was observed over a defined time period, during which the number of fluorescent spots increased until individual EGFP molecules were no longer distinguishable as diffraction-limited spots. In the detect and bleach method (Figure 6b), fluorescent spots were counted, bleached, and after a fixed time interval counted again. Both images were subtracted to identify newly arrived and Figure 4.Scheme of ddIPCR. a) Antibody-coated magnetic beads capture the antigen (1). A biotinylated
antibody (2), streptavidin (3), and biotinylated DNA sequence fromAspergillus fumigatus(4) are sequentially added. b) The magnetic beads are resuspended in a reaction mixture and emulsified. After ddIPCR, the numbers of negative and positive droplets are counted. Reprinted with permission from ref. [58]. Copyright 2018 Royal Society of Chemistry.
bleached molecules. Protein p53 was detected in the accumu- lation method by using a labeled detection antibody.
Zhang et al.[65]developed a digital ATP assay using split aptamers. A coverslip was bound to a glass slide with a 5-mm hole in the center, followed by surface activation with plasma.
A mixture of poly(l-lysine)-poly(ethylene glycol)-biotin (PLL-PEG-biotin) and PLL-PEG was added to the activated coverslip. Next, streptavidin was added, and a biotinylated Cy3-3’-labeled split aptamer was bound to streptavidin. The analyte ATP was added together with the other Cy5-3’- labeled aptamer. The coverslip was placed on an epifluor- escence microscope, and the emission of the two dyes was collected simultaneously on the same EM-CCD camera.
Diffraction-limited spots of a mixed color indicated specific binding, whereas spots with only one color indicated non- specific binding. The assay achieved an LOD of 100 fmand a working range of 1 pmto 5 nm.
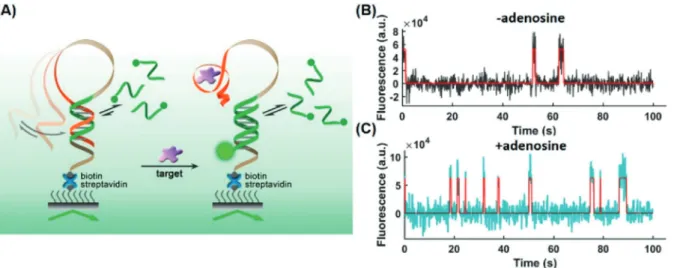
Weng et al.[66]developed an aptasensor for the detection of small molecules. The hairpin-shaped aptamer immobilized
on a glass slide changes its conformation to an open state upon analyte binding (Figure 7). Fluorescently labeled short ssDNA probes bound preferably (but not exclusively) to the open conformation and the fluorescence trajectories of individual aptamers were monitored by TIRF microscopy.
As the binding of the fluorescent probe followed different kinetic patterns depending on the conformation of the aptamer, the kinetic fingerprints were used to distinguish between nonspecific binding and analyte binding. Only spots that showed the signature of specific binding were counted to determine the analyte concentration. The assay achieved Figure 5. Scheme of single-molecule pull-down assay. A cell lysate is
applied directly onto a coverslip for single-molecule TIRF microscopy.
Specific antibodies on the coverslip capture protein complexes. Prey proteins associated with the bait protein are detected via a fluorescent dye fused to the prey. Reprinted with permission from ref. [63].
Copyright 2011 Macmillan Publishers Limited. Figure 6. Different approaches for digital protein quantification. a) For low analyte concentrations, the accumulation method counts the increasing number of fluorescent spots. If the distance between two fluorescent molecules is below the diffraction limit, they appear as one spot and cannot be distinguished anymore. b) In the detect and bleach method, fluorescent molecules are counted after a certain time interval and subsequently bleached. The bleaching step keeps the average number of fluorophores bound to the surface at a constant level such that higher concentrations can be determined. Reprinted with permission from ref. [64]. Copyright 2014 Royal Society of Chemistry.
LODs of 0.3 pmfor adenosine, 0.35 pmfor acetamiprid, and 0.72 pmfor PCB-77 in spiked chicken meat extract.
4.2.Laser-Induced Fluorescence Detection inside a Capillary The Yeung group pioneered the use of capillary electro- phoresis for single-molecule detection.[36]In capillary electro- phoresis, an electric field drives the sample through the illumination volume, which is small enough to allow for the detection of individual fluorescent molecules. Based on the electrophoretic mobility of individual fluorescently labeled antibodies, fluorescent immunoassays were established.[67]
Antibodies bound to an analyte molecule have lower electro- phoretic mobility and can thus be distinguished from free antibodies using cross-correlation. Individual fluorescence- labeled antibodies were recorded in the capillary by wide- field microscopy using a 20 X objective (numerical aperture (NA) 0.75) and an intensified CCD camera.
Stimulated by the need for reliable and sensitive assays for cardiac troponin, a diagnostic marker of acute myocardial infarction, the Erenna platform was developed.[68] First, a sandwich immunoassay was performed in a microtiter plate, and the bound labels were then released and inserted into a capillary electrophoresis device. As only a single fluorescent molecule passed through the detection volume during the observation interval, individual analyte molecules were counted, and an LOD of 1.7 pgmL@1was achieved. In combination with magnetic beads, it was possible to detect troponin I levels of 0.2 pgmL@1, which are typically found in healthy individuals (0.3 to 9 pgmL@1).[69]Esparza et al.[70]used the Erenna assay to study amyloid-beta (Ab) aggregation and deposition in AlzheimerQs disease. Concentrations as low as 1.56 pgmL@1(0.18 pm) of soluble Aboligomers were detect- able above background, and the limit of quantification (LOQ) was 6.25 pgmL@1 (0.72 pm). The method was applied to measure the Aboligomers in human cortical tissue homoge- nate. Wild et al.[71] detected mutant huntingtin protein
(mHTT) in cerebrospinal fluid. The mHTT is a promising biomarker for monitoring Huntington disease progression, but due to its predominantly intracellular localization, the concentration in the cerebrospinal fluid is very low (below pm even in patients in an advanced state of the disease) and conventional methods are not sensitive enough to detect it.
The Erenna assay provided an LOD of 40 fmand the authors found a significant difference in levels of mHTT in carriers of the genetic mutation in the premanifest stage and in different later stages of the disease.
For the detection of the fertility-related human gonado- tropin follicle-stimulating hormone (FSH), the laser beam was shaped into stripes, and 10 “superpixel” zones were evaluated using a CCD camera.[72]Magnetic beads served as a solid support for the immunoassay. The LOD for FSH was 34 fmfor a few hundreds of fluorescent events counted above the background in 12 s corresponding to a few zeptomoles of labeled antibodies.
The combination of several excitation lasers (blue 488 nm; green 543 nm; red 635 nm; infrared 730 nm) and four single-photon-counting modules allowed for the imple- mentation of multiplexed assays.[73] Confocal microsecond- scale alternating-laser excitation (ALEX) single-molecule fluorescence spectroscopy was used to probe the fluorescent acceptor (A) without energy transfer (FRET) and provided donor (D) excitation-based data for each single molecule.
Distinct emission signatures were recovered for interacting species through determination of the FRET efficiency E, which relates to the D–A distance, and distance-independent stoichiometry-based ratioS.The combination ofEandSon two-dimensional histograms allowed for a virtual sorting of single molecules. This technique was evaluated by determin- ing 25 DNA sequences, 6 tumor markers, 8 bacterial gene markers, and 3 drug-resistance determinants.
Figure 7. A) Scheme of a hairpin-shaped aptasensor immobilized on a slide surface. Analyte binding results in a conformational change and binding of a complementary fluorescent ssDNA probe. Single-molecule trajectories B) without and C) with 50 pmadenosine are distinguishable.
Reprinted with permission from ref. [66]. Copyright 2019 American Chemical Society.
4.3.Fluorescence Correlation Spectroscopy
Fluorescence correlation spec- troscopy (FCS) records diffusion at the single-molecule level. Equilib- rium concentration fluctuations due to Brownian motion are mea- sured as spikes of fluorescence intensity within a small sampling volume. A concentration in the nanomolar range should be attained for sub-femtoliter detec- tion volumes to allow for following individual fluorescence-labeled molecules. Such a small detection volume can be obtained using con- focal microscopy or multiphoton microscopy. The sensitivity of FCS depends mainly on the brightness of the fluorescent probe and on the detection volume.[74] Evaluating fluorescence intensity fluctuations over time by an autocorrelation function yields information on the diffusion rates and the concentra-
tion of the fluorescent molecule.[75] The diffusion time depends on the size and shape of the target molecule, on the viscosity of the solution, and on the size of the focused laser beam. FCS can be exploited to follow molecular interactions with other molecules because the diffusion time decreases each time when another molecule has bound.[76]
FCS has found applications in in vitro and in vivo studies of protein–protein interactions, nucleic acid interactions, enzy- matic activities, and membrane diffusion.[77]
The detection of fluorescence-labeled molecules at the single-molecule level by FCS is applicable for the implemen- tation of homogeneous immunoassays that avoid washing and separation steps as well as nonspecific binding to surfaces, which becomes increasingly important at low analyte con- centrations.[75]On the other hand, FCS is prone to background interferences caused by autofluorescence, light scattering, quenching, and potential aggregation of the assay compo- nents. The simplest scheme of an FCS immunoassay is based on following the changes in the diffusion rate after the formation of the immunocomplex (Figure 8). Chatterjee et al.[76]employed a sandwich assay for the detection of the neuronal cell adhesion molecule contactin-2 in cerebrospinal fluid. The assay was based on two different anti-contactin antibodies. One antibody was labeled with Alexa Fluor 488 and the other one was unlabeled. The formation of the sandwich immunocomplex of both antibodies with the analyte increased the diffusion time, which was evaluated from the autocorrelation curve. The authors reached a limit of quantification of 0.2 ngmL@1.
Changes in the diffusion rates were also recorded by FCS to implement a competitive assay for the detection of the mycotoxin fumonisin B1(FB1).[78]The analyte FB1competed with a tracer consisting of FB1and Alexa Fluor 488 for the
free binding site of the antibody. The assay provided an LOD of 1 ngmL@1.
The sensitivity towards the formation of immunocom- plexes closer in size can be enhanced by using fluorescence cross-correlation spectroscopy (FCCS). FCCS uses two spec- trally different fluorescent probes, which can be simultane- ously excited using two separate excitation wavelengths and detected in two different channels. The amplitudes of the cross-correlation curves are calculated to measure the inter- actions of the fluorescent probes with the analyte. Compared to conventional FCS, the use of two labels increases the sensitivity and especially the selectivity of FCCS in the quantitative measurement of biomolecules.
The Klenerman group[79] developed a sandwich assay based on the counting of coincidence spikes of two labeled antibodies. Compared to conventional FCCS, the data evaluation was simplified because only the number of spikes was counted, which corresponds to both labels being present in the confocal volume at the same time. Protein G and herpes simplex virus were detected with an LOD of 50 fm.
Miller et al.[80] demonstrated a sandwich FCCS-based assay for the detection of human chorionic gonadotropin and the prion protein (Figure 9). Two lasers were alternated, and the emissions of different fluorescent labels were measured using separate detectors to eliminate spectral cross-talk and reduce the probability of false positive cross- correlation.[81]The fluorophores were chosen in such a way that their emission is separated, reducing the overlap of the emission and the possible energy transfer. To eliminate aggregation effects on the cross-correlation curves, cross- correlations on short time sections were calculated and those displaying the highest level of fluorescence (top 1% of the intensity distribution) were discarded. The method provided Figure 8. a) FCS setup. A laser is focused to excite fluorescent molecules in a confocal volume.
Fluorescence intensity fluctuations due to Brownian motion are measured in solution by a photodiode connected to an optical fiber. b) The emitted photons are collected and plotted as time-dependent intensity changes. c) The autocorrelation curves show an increase in the diffusion time after formation of the immunocomplex (gg) compared to the antibody alone (cc). Reprinted with permission from ref. [76]. Copyright 2017 Elsevier.
LODs of 100 pm (human chorionic gonadotropin) and 2 nm (prion protein) with an analysis time of 40 min.
5.Nanoparticle Labels
In recent years, various kinds of nanomaterials have been introduced as labels for immunoassays in order to enhance the assay performance.[20a]In particular, NPs with luminescent or plasmonic properties, which allow for a convenient optical readout, are suitable for single-molecule analysis.[82] Com- pared to molecular labels, NPs display generally higher signals, which allows for an easier readout. On the other hand, their larger size can be a drawback in terms of steric hindrance of the immunocomplex formation as well as a potentially higher degree of nonspecific binding.
5.1.Semiconductor Nanoparticles
Quantum dots (QDs) are fluorescent semiconductor nanocrystals with dimensions typically between 1 and 10 nm. The photoluminescence properties of QDs can be tuned by changing the nanocrystal size, making it possible to adjust emission wavelengths in the range of 380 to 2000 nm.[83]
Compared to conventional fluorophores, QDs provide higher emission intensities, better photostability, wider excitation spectra, and narrower emission bandwidths.[84]This allows for an easier detection of individual QDs compared to conven- tional fluorophores.
5.1.1.Detection of Surface-Bound Analytes
Liu et al.[85]developed a sandwich immunoassay based on QD labels. Capture antibody-coated QDs and detection antibody-coated QDs were mixed with the sample, and then immobilized onto a positively charged coverslip. Mixed color spots (yellow) were counted under a fluorescence microscope.
Carcinoembryonic antigen (CEA) was detected with an LOD of 6.1 pm. The same group[86] implemented a homogeneous sandwich immunoassay that employed only one type of label.
Capture and detection antibodies were conjugated separately to 655QD. After formation of a sandwich immunocomplex with the analyte, the QD emission was monitored through a diffraction grating placed in front of a CMOS camera of the microscope. The grating divided the emission into a zeroth- order spot and a first-order streak. Because of the diffraction limit, it was not possible to distinguish between unbound QDs and the immunocomplexes. The QDs were oxidized during excitation, and the first order streak shifted to shorter wavelengths. The oxidation of the QDs started at different times and proceeded at different rates, which split the first order streak into two smaller streaks. The number of split streaks was proportional to the number of analyte molecules.
The LODs for CEA and AFP were 6.7 fm and 3.4 fm, respectively.
5.1.2.Detection in Microchannels
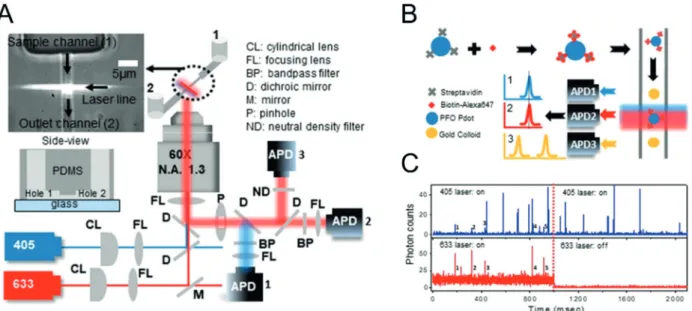
The Nie group[87]implemented a sandwich immunoassay for virus detection based on the parallel detection of red and green fluorescent NPs in a microfluidic channel under 488-nm laser excitation. The immunocomplex was detected by monitoring the coincidence of photon bursts in the red and green detection channels. In this way, wild-type and mutated respiratory syncytial viruses were quantified in parallel with an LOD of 4 X 10⁶plaque-forming units (PFU).
Zhang et al.[88] developed an aptamer-based single-QD FRET assay for the detection of cocaine. They first designed a signal-off assay by assembling a sandwich of a 3’-biotiny- lated oligonucleotide, a cocaine aptamer and a 3’-Cy5-labeled oligonucleotide. The sensitivity of the system was investigated by plotting the Cy5 burst counts against the ratio of Cy5 to 605QD from 0 to 24. It was possible to distinguish between single Cy5 labels. The sandwich complex was dispersed in a diluted cocaine sample to capture the analyte, and then a commercial streptavidin-functionalized 605QD (605 nm emission) was added to capture the aptamer complex. In the presence of a high amount of cocaine, no FRET signal was observed due to the release of the Cy5-oligonucleotide after analyte binding. The signal-off assay achieved an LOD of 0.5mm for cocaine, which is comparable to other electro- chemical and enzyme-based assays. The generally low sensi- tivity was explained by the poor affinity of the aptamer towards cocaine. Additionally, a signal-on assay was designed by forming a sandwich of a 3’-biotinylated oligonucleotide and 5’-Cy5-oligonucleotide, the cocaine aptamer, and a 3’- Iowa-black-oligonucleotide, which quenched the emission of the 605QD/Cy5 FRET. In the presence of cocaine, the quencher containing the oligonucleotide was released, and Figure 9.In FCCS, two fluorescence-labeled antibodies bind to the
analyte. Black line: cross-correlation of labeled antibodies without analyte (antigen); red line: cross-correlation of labeled antibodies in the presence of the analyte. Reprinted with permission from ref. [80].
Copyright 2009 American Chemical Society.