of van der Waals Clusters Formed in Superfluid Helium Nanodroplets
Dissertation zur Erlangung des
Doktorgrades der Naturwissenschaften (Dr. rer. nat.) der Naturwissenschaftlichen Fakult¨ at IV
-Chemie und Pharmazie- der Universit¨ at Regensburg
vorgelegt von Eva-Maria Wirths
2014
Diese Arbeit wurde angeleitet von: Prof. Dr. A. Slenczka Promotionsgesuch eingereicht am: 18.12.2014
Pr¨ufungsausschuss: Prof. Dr. N. Korber, Vorsitzender Prof. Dr. A. Slenczka
Prof. Dr. B. Dick Prof. Dr. A. Penzkofer
&
Benedikt
“Die Endlosigkeit des wissenschaftlichen Ringens sorgt unabl¨assig daf¨ur, daß dem forschenden Menschengeist seine beiden edelsten Antriebe erhalten bleiben und immer
wieder von neuem angefacht werden: Die Begeisterung und die Ehrfurcht.”
-Max Planck-
1 Introduction 1
2 Basic Principles of Helium Droplets 3
2.1 Properties of Helium . . . 3
2.2 Droplet Formation and Properties . . . 5
2.3 Doping and Coagulation within the Droplets . . . 10
3 Spectroscopy on Molecules and Clusters in Helium Droplets 17 3.1 Fluorescence Excitation Spectroscopy . . . 17
3.2 Dispersed Emission Spectroscopy . . . 23
3.3 Stark Spectroscopy . . . 25
4 Experimental Setup 28 4.1 Continuous Droplet Beam Experiments . . . 28
4.1.1 Helium Droplet Apparatus . . . 28
4.1.2 Laser System and Optical Detection . . . 32
4.1.3 Measurement Techniques . . . 34
4.1.3.1 Fluorescence Excitation Spectra . . . 34
4.1.3.2 Stark Spectra . . . 34
4.2 Pulsed Droplet Beam Experiments . . . 35
4.2.1 Helium Droplet Apparatus . . . 35
4.2.2 Laser System and Optical Detection . . . 40
4.2.3 Measurement Techniques . . . 43
I
II Table of Contents
4.2.3.1 Fluorescence Excitation Spectra . . . 43
4.2.3.2 Dispersed Emission Spectra . . . 46
4.3 Comparison of continuous and pulsed helium droplet beams . . . 47
4.4 Analysis of the Droplet Doping . . . 49
4.5 Chemicals and Laser Dyes . . . 51
5 Phthalocyanine Water Clusters in Helium Droplets 52 5.1 Introduction . . . 52
5.2 Excitation Spectrum . . . 55
5.3 Assignment of the Clusters . . . 58
5.4 Stark Spectra . . . 61
5.4.1 Bare Phthalocyanine . . . 61
5.4.2 Parallel Adjustment . . . 62
5.4.3 Perpendicular Adjustment . . . 66
5.5 Summary . . . 70
6 Anthracene Argon Clusters in Helium Droplets 71 6.1 Introduction . . . 72
6.2 Excitation Spectrum . . . 74
6.3 Assignment of the Clusters . . . 80
6.4 Anthracene-Ar1 . . . 85
6.4.1 Fluorescence Excitation . . . 86
6.4.2 Dispersed Emission . . . 93
6.5 Anthracene-Ar2 . . . 95
6.5.1 Fluorescence Excitation . . . 95
6.5.2 Dispersed Emission . . . 101
6.6 Anthracene-Ar3 . . . 104
6.6.1 Fluorescence Excitation . . . 104
6.6.2 Dispersed Emission . . . 109
6.7 Anthracene-Ark with k ≥ 4 . . . 110
6.7.1 Fluorescence Excitation . . . 110
6.7.2 Dispersed Emission . . . 117 6.8 Summary . . . 118
7 Conclusion 120
References 124
1 Introduction
Spectroscopy provides an experimental option to investigate matter on the atomic scale.
One of the most interesting and challenging domains in this field is the research on clusters, as they fill the gap between well-studied isolated molecules and the bulk phase.
Clusters may consist of only a few or up to thousands of atoms and they exhibit a wide variety of properties, which depend to a large extent on the cluster size and structure.
One approach to study clusters spectroscopically is the application of doped clusters, i.e.
clusters containing a chromophore as a probe molecule. Then the properties of the cluster can be analyzed by regarding the chromophore’s spectral signature and its modification under varying cluster formation conditions. Some of the many questions, which are of interest in this research field, are for example: How much insight can be gained about the cluster size and structure by the analysis of the chromophore’s spectral signature? Do structural isomers exist for a given cluster stoichiometry and which are the spectroscopic methods that can be applied to distinguish between their different configurations? Are the clusters stable and rigid or rather fluxional? Which factors (temperature, doping conditions, etc.) influence the cluster formation process?
In order to find answers to these questions experiments using superfluid helium dro- plets as a host system can be applied, since the droplet environment offers many be- neficial properties for a systematic research on clusters and their formation process. In spectroscopy helium droplets serve as a cryogenic matrix cooling the embedded spe- cies to an equilibrium temperature of 0.37 K within picoseconds, while at the same time ensuring the free rotation and movement of the dopant inside the droplet [TV04].
Thus, cluster formation of individually picked up and cooled particles occurs within
1
the droplet environment. Moreover, it was shown that the doping of helium droplets and therefore also the cluster formation is subject to a statistical process, which helps to distinguish between spectral signals of different cluster stoichiometries [LST95]. The particular properties of helium droplets, which characterize this host system as a gent- le matrix well suited for spectroscopic experiments, are reviewed in numerous articles [TV98, CLSS01, SV01, TV04, CDF+06, SL06, ST08]. A general discussion on helium droplets and electronic spectroscopy with helium droplets as a host system can also be found in this thesis in chaps. 2 and 3.
In the present work various aspects of two different cluster systems embedded into super- fluid helium droplets are presented. Water clusters with phthalocyanine as a chromophore were chosen as a prototype system for a cluster with a distinct electric dipole moment, so as to enable investigations containing Stark spectroscopy. These investigations were conducted in a continuous droplet beam. The results are discussed in chap. 5, after a presentation of the experimental setup (chap. 4).
The second species considered in this thesis are van der Waals clusters consisting of one anthracene molecule and a differing quantity of argon atoms. This system was selected for investigations, since weakly bound clusters of aromatic molecules with rare gas atoms serve as prototype systems for the spectroscopic research of solvation on a microscopic scale (see e.g. [AEJ82, AEJD83, ASJ84, LJ87, LB90, SBHEJ91, BHEJL92, HLTV98, KTL00, KNT+11, DMK+12a, DMK+12b, DMBS14]). The study on anthracene-argon clusters was conducted in a pulsed droplet beam for varying pick-up conditions. The re- garded clusters contain between one and up to∼100 argon atoms. The spectra, which are presented and discussed in chap. 6, are compared with corresponding gas phase measu- rements in order to gain information on the influence of the helium droplet environment on the cluster formation.
This thesis ends with a conclusion in chap. 7, which sums up the gained results and presents proposals for further research projects.
2 Basic Principles of Helium Droplets
This chapter gives an introduction into the properties of bulk helium and helium droplets.
The production of droplet beams is discussed for continuous and pulsed helium sources.
Moreover, the doping of the droplets with foreign particles, and their coagulation process within the helium environment is presented.
2.1 Properties of Helium
The existence of the chemical element helium is known since 1868. It was deduced from the observation of a spectral line at 587.49 nm in the solar spectrum [Jan68]. Due to the manner of discovery the element owes its name to the sun (Greek: helios). It was isolated and studied on earth for the first time in 1895 [Ram95].
From all elements of the periodic table helium is the one with the lowest melting and boiling points. It has two stable isotopes, 3He and 4He. With a nuclear spin of I = 0
4He exhibits a bosonic nature, while 3He with a nuclear spin of I = 1/2 is a fermion.
The physical properties of the isotopes are strongly affected by the difference in the spin statistics. As3He is not relevant for this research project it is not further discussed here.
When helium is mentioned in this thesis it generally refers to 4He.
Fig. 2.1 shows the phase diagram of 4He represented in a double logarithmic plot. It ex- hibits several abnormalities. For instance, no triple point exists marking the equilibrium between gaseous, liquid and solid phase. For pressures below about 25 bar the transition into the solid phase is missing completely. The fact that helium at standard conditions
3
pressure p / bar
HeII solid
HeI liquid
gas
critical isentrope
temperature T / K
Fig. 2.1: Phase diagram of 4He (from [BKN+90]). The solid lines are phase boundaries, the dashed lines represent isentropes for different expansion conditions. Tc and pc are the temperature and pressure at the critical point, respectively.
remains liquid even down to absolute zero is due to the zero-point energy being close to the dissociation energy, which results in an increased delocalization of the wavefunction [TV04]. In addition to the transitions between gaseous, liquid and solid phase there is a further phase transformation between HeI and HeII. By cooling helium gas at a pressure of 1 bar the HeI phase is reached at 4.21 K and the HeII phase at 2.17 K. The tempe- rature below which HeI transitions into HeII is called the λ-point. The transition from HeI to HeII is recognized by a significant change in the physical properties, observed for the first time in 1938 [Kap38]. To characterize this transition Tisza introduced the two-fluid model for liquid helium [Tis47]. It states that helium below the λ-point exists as a mixture with two components, a normal fluid and a superfluid fraction. The ratio of the superfluid part increases with further reduction of the temperature. Below 1 K the normal fluid phase is not existent any more and the entire liquid is superfluid. Su- perfluidity manifests in a very high thermal conductivity and a vanishing viscosity. The consequence is a frictionless motion of foreign substances through the superfluid helium as long as a critical velocity is not exceeded. This threshold is called Landau velocity and takes the value of about 58 m/s for bulk HeII at saturated vapor pressure [Lan41].
2.2 Droplet Formation and Properties 5
Helium is transparent for electromagnetic radiation from the microwave to the vacuum ultraviolet range. Furthermore, it has an exceptionally low polarizability ofα= 0.205 ˚A3 and thus its interaction with foreign substances is very weak, which means that it is che- mically inert [RS85]. Its relative dielectric constant of= 1.055 for temperatures between 2 K and 4 K is close to the vacuum value of = 1.000 [LST95]. Its low temperature, chemical inertness and the other characteristics described above make superfluid helium an ideal host system for spectroscopic research.
2.2 Droplet Formation and Properties
Although superfluid helium was expected to be a suitable cryogenic host system for spectroscopy this field of research could not profit from the advantages of HeII in the bulk phase. This is due to the fact that it is basically impossible to solve foreign substances in bulk HeII, since the embedded particles coagulate with each other and condense at the container wall. This problem becomes irrelevant, however, when using droplets of HeII levitating freely in a vacuum apparatus. These helium droplets are composed of thousands up to several millions of helium atoms depending on the expansion conditions.
The first experiment on molecular spectroscopy with helium droplets was reported in 1992 for the infra-red spectrum of SF6 [GSS92]. Subsequent measurements on the same system revealed the fully-resolved rotational lines of the P, Q and R branches [HMTV95].
From the intensity profile of the rotational fine structure a droplet temperature of 0.37 ± 0.05 K was determined, which was in good agreement with earlier theoretical predictions. Later measurements on the IR-spectrum of OCS [GHH+00] and numerous other molecules could confirm this value [CLSS01]. Assuming similar transition tem- peratures for bulk helium and droplets (cf. fig. 2.1) as well as an inner pressure of the droplets far below 25 bar this temperature implies the superfluid state of helium droplets [LST95, TV04]. Further evidence for their superfluidity is given by the free rotation of molecules inside the droplet environment. The fully resolved rotational li- nes in the reported IR-spectra are therefore seen as a microscopic indication for HeII
[HMTV95, GTV98]. Thus, helium droplets serve as an ideal microscopic research system for superfluidity in addition to their application as a cryogenic host system for embedded species. Moreover, chemical and photochemical reactions can be studied in the gentle ultra-cold droplet environment [TV04, ST08].
Helium droplets are generated by adiabatic expansion of helium into a vacuum chamber.
The size and velocity of the superfluid droplets depends on the nozzle characteristics and on the expansion conditions. Typical are nozzle temperatures between 7 K and 30 K and high stagnation pressures between 10 bar and 100 bar. According to the applied droplet source a continuous or pulsed droplet beam is formed.
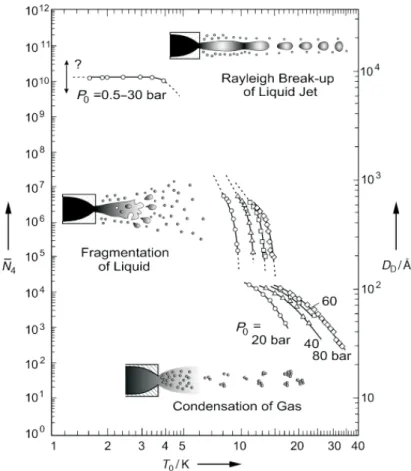
A continuous-flow nozzle with a small diameter of 5 µm or 10 µm is used for the gene- ration of a directed continuous droplet beam. The droplets originate either from free jet expansion of helium gas condensing into clusters or from the fragmentation or Rayleigh break-up of expanded liquid helium. Their size distribution and scattering cross secti- on were determined by different deflection experiments [JN92, LST93, Knu97, HTD98, KH99, TV04]. The average number of helium atoms per droplet and the corresponding droplet diameter are illustrated in fig. 2.2 as functions of the nozzle temperature [TV04].
The graphs correspond to varying stagnation pressures. The droplet size is calculated assuming a spherical shape, a uniform density and a sharp outer edge for a helium dro- plet. The droplet radius is then given byR0 = 2.22·N1/3 ˚A with N being the number of helium atoms, which the droplet contains [BS90]. These assumptions follow the liquid- drop model and are quite reasonable for helium nanodroplets. In the droplet center the particle density almost equates the value for bulk liquid helium of ρbulk = 0.0218 ˚A−3, while at the droplet surface region the density decreases to 10 % of this value [HTD98].
The plots in fig. 2.2 show that for a constant stagnation pressure the droplet size grows with decreasing nozzle temperature. The smallest droplets are produced by condensati- on of helium gas, the largest ones by Rayleigh break-up of a liquid jet of helium. The different expansion processes are represented by isentropic curves in the phase diagram.
They are plotted as dashed lines in fig. 2.1 and can be divided into three groups, the subcritical (I), the critical (II) and the supercritical (III) isentropes, whose evolution is
2.2 Droplet Formation and Properties 7
determined by the initial stagnation conditions.
Fig. 2.2: Graphic representation of the helium droplets’ diameter DD and the number of helium atoms per droplet ¯N4 for the three modes of continuous jet expansion. The graphs correspond to different stagnation pressuresp0 and they are plotted against the nozzle temperatureT0. (from [TV04])
In the case of subcritical expansion the gas-liquid phase boundary is approached from the gas side. The expanding helium is cooled adiabatically leading to its condensation into droplets. When the collision rate in the expanding gas abates further downstream the condensation process expires. The droplets commence cooling by evaporation of helium atoms. The binding energy for bulk helium of 5 cm−1 (≡ 7.2 K) per atom on average is also assumed for helium droplets [ST87, TV04]. The evaporation rate decreases exponentially with time, starting with ca. 1010 Ks−1 and finishing with a droplet temperature of about 0.4 K for times larger than 10−4 s, which is in good agreement with the experimental equilibrium value [Ste85, HMTV95, HTK97]. The very high initial cooling rate makes the helium droplets a nearly perfect thermostat, as it prevents the increase of the droplet temperature [TV04].
In a droplet beam generated via subcritical expansion the droplets contain between 102 and 104 helium atoms. The droplet size distribution can be simulated by a log-normal distribution via fit of the parameters µand σ [LST93, TV98].
f(N) = 1 N σ√
2πe−(lnN−µ)22σ2 (2.1) Thus the mean number of helium atoms per droplet ¯N is given by
N¯ =eµ+σ
2
2 (2.2)
with a standard deviation of
sN¯ = ¯Np
eσ2 −1. (2.3)
The droplet’s velocity ranges from 200 m/s to 400 m/s. They show a high speed ratio of about 100.v/∆v .300 [BKN+90].
With supercritical expansion droplets are formed from liquid helium fragmenting into clusters. After the break-up of the liquid the droplets also cool down to the equilibrium temperature of 0.37 K by evaporation of helium atoms, as in the subcritical case. The droplets formed thus exhibit a bimodal size distribution. The large droplets consist of more than 106helium atoms with an exponentially decreasing size distribution. The small droplets contain about 104-105 atoms [BKN+90]. The droplet velocity lies in between 50 m/s and 100 m/s. The transitional area between the subcritical and the supercritical expansion is characterized by a droplet formation corresponding to isentropes passing the phase boundary near the critical point (Tc= 5.2 K, pc = 2.3 bar).
In addition, a continuous droplet beam can be generated via Rayleigh break-up of a liquid jet of helium. These droplets are much larger than the ones discussed above. They contain between 1010 and 1012 helium atoms. The beam velocity is low, clearly below the Landau velocity of 58 m/s, and satisfies the Bernoulli equationv =cp
2P0/ρ0. The pressure P0 and the density ρ0 correspond to the expansion conditions, while c is a constant. The speed ratio is high, approaching values of v/∆v & 100 for decreasing
2.2 Droplet Formation and Properties 9
source temperature and increasing stagnation pressure [GT03].
Alternatively a directed beam of helium droplets can be produced with a pulsed dro- plet source. The pulsed setups reported in the literature are equipped with a General Valve [GEA02, SKMV02, YBE05, YBWE06, YBN+07, YE08] or an Even Lavie Valve, modified for cryogenic application [PRD+09, FAMvH12]. The droplet density in pulsed helium droplet beams is increased by more than an order of magnitude compared with continuous beams. Another fundamental difference is the time dependence of the heli- um pressure at the nozzle outlet during pulse generation. Hence, the size distribution and velocity of the droplets varies within one pulse, determining its time profile. To characterize the droplet pulses undoped droplets were investigated by Rayleigh scat- tering of UV radiation [GEA02, PRD+09]. In addition, doped droplets were analyzed by mass spectrometric measurements [YBE05, YE08, FAMvH12] and by recording the laser-induced fluorescence of chromophore molecules embedded inside the helium dro- plets [GEA02, SKMV02, PRD+09].
With a General Valve 30 - 100 µs droplet pulses are produced by the movement of a poppet beating against a stainless steel front plate. The shape of the nozzle throat is essential for the expansion characteristics. Depending on the nozzle shape and expansion conditions droplets containing 103 up to 105 helium atoms can be produced [SKMV02, YBE05]. For nozzle temperatures between 9 K and 14 K at a stagnation pressure of 20 bar the droplets exhibit velocities between 330 m/s and 400 m/s [SKMV02].
Instead of a poppet the Even Lavie Valve possesses a plunger pressed against a front gasket with an orifice of 60µm in diameter. A helium pulse is produced by sending a short high-current pulse (12 - 25 A) to a low inductance coil inside the valve so as to pull back the plunger by magnetic field force. The opening duration is only about 20µs before the plunger is pushed back into its sealing position by a return spring and the gas pressure [noz]. The helium droplet beam produced thus exhibits a bimodal size distribution. The leading fraction consists of droplets with an average size between 104 and 106 helium atoms per droplet depending on the expansion conditions [PRD+09, FAMvH12]. The rear part of the pulse holds large droplets consisting of >106 helium atoms. In contrast
to the former ones these large helium droplets are not suitable for doping with foreign particles. By varying the expansion conditions the relative abundance of the two fractions is shifted. With decreasing stagnation pressure and increasing nozzle temperature the leading part of the pulse rises and smaller droplets are produced. The droplet velocity can be varied from 250 m/s up to 410 m/s. Fig. 2.3 shows the beam velocity as a function of the stagnation pressure at different nozzle temperatures and repetition rates.
From the graphs it becomes obvious that also the repetition rate influences the helium expansion and droplet formation. However, it has only a thermal effect on the valve and an increased repetition rate can be compensated by lowering the nozzle temperature [PRD+09].
The Even Lavie Valve offers several advantages compared with a General Valve. The gas pulse duration is shorter and a better reliability of the system is ensured as it is independent of the lifetime of a poppet. Moreover, the pulse-to-pulse fluctuation is smaller and the short opening time of the valve minimizes the gas load in the source chamber significantly [Pen10].
Fig. 2.3: Velocities of helium droplets produced at different expansion conditions with an Even Lavie Valve (from [Pen10]).
2.3 Doping and Coagulation within the Droplets 11
2.3 Doping and Coagulation within the Droplets
The inelastic collision between a superfluid helium droplet and an atom or molecule can result in the embedding of the foreign particle inside the droplet. This is a pick-up procedure, which is used in order to dope the helium droplets with foreign particles.
These particles are provided as a gas phase sample in a pick-up unit, which the droplet beam passes on the flight through the vacuum apparatus. The particle density in the pick-up cell is adjusted by tuning to a corresponding vapor pressure. Its adjustment depends on the desired doping, for the pick-up probability is directly influenced by the particle density of the dopant species in the pick-up cell.
The mathematical description, which can be deduced for the probability Pk of doping the droplets on their flight through the pick-up cell withk particles is given by a Poisson distribution [LST95].
Pk(n) = (σnL)k
k! e−σnL (2.4)
The length of the droplets’ flight path through the pick-up unit is referred to asL, while n denotes the particle density of the dopant in the pick-up cell.σ is the effective pick-up cross section of the helium droplets, which is proportional to the droplets’ geometric cross section. From this it follows that the pick-up probability scales with the size of the droplets N as N2/3 for spherical droplets. Hence, equ. 2.4 describes the probability that droplets with an effective pick-up cross section σ leave the pick-up cell (length L, particle density n) with exactly k particles inside.
This model is used for the doping of helium nanodroplets with clusters of a well-defined size distribution. Above all it is applied to experimental data in order to assign spectral features to clusters with a particular stoichiometry. To this purpose the pick-up pro- bability is influenced by varying the dopant’s particle density in the pick-up unit. By analyzing the evoked intensity response of the spectra the transitions can be assigned to the clusters under investigation. This is one of the few methods in mass spectrometry, which enables the assignment of cluster stoichiometries without the destruction of the sample.
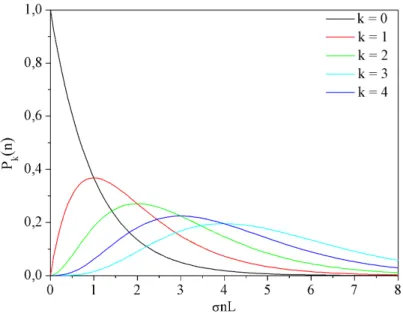
Fig. 2.4: Fraction of helium droplets doped withkforeign particles as a function of the particle densitynin the pick-up cell. The length of the droplets’ flight path through the pick- up cellLand the pick-up cross section of the dropletsσ are assumed to be constant.
The graphs showing the Poisson distribution according to equ. 2.4 with k = 0 up to k = 4 are illustrated in fig. 2.4. The argument σnL is the average number of collisions between droplets and particles leading to a capture. In the case of undoped droplets (k = 0) equ. 2.4 shows an exponential decay. In the case of doped droplets (k >0) the graphs rise with nk, i.e. a linear increase for k = 1, a parabolic increase for k = 2, etc.
After reaching a maximum the probabilityPk decreases exponentially. The positions of the maxima show a linear correlation with k and are characterized by equ. 2.5.
nσL=k (2.5)
As can be seen in fig. 2.4 the curves for different k overlap and the size distribution of the clusters becomes broader with increasing σnL. With increasing k the gradient of Pk(n) decreases and the difference between graphs of neighboring k numbers becomes less characteristic. Therefore, the easiest case to accomplish and analyze is single particle doping. A loss in size selectivity has to be considered when analyzing multiple particle doping.
The mathematical derivation for the description of the pick-up process is based on several
2.3 Doping and Coagulation within the Droplets 13
assumptions. One condition for the validity of the Poisson distribution for this procedure is that the doping is a pick-up process of individual particles. In addition, it is assumed that the helium droplets have a uniform size. Furthermore, the cross section of the droplets should not be influenced by the number of picked up particles and therefore be independent of k. Another assumption is that the scattering of helium droplets out of the beam can be neglected as well as evaporation effects [LST95]. These conditions are not inevitably fulfilled for a helium droplet beam crossing a pick-up unit.
The assumption that foreign particles are picked up individually by the droplets is quite reasonable. In the pick-up cell the samples investigated in this project are provided at room temperature or higher and their vapor pressure is in the 10−4 mbar - 10−5 mbar range. On account of these conditions, i.e. high temperature and low vapor pressure, the formation of clusters in the gas phase can be excluded. The neglect of droplet scattering out of the beam axis and detection volume is also appropriate, as the expansion of the skimmed and aligned droplet beam is small compared to the collection angle of the detector. A monodisperse size distribution and a constant cross section σ of the droplets is, however, an approximation, which holds for the case of large droplets and a small number of captured particles. The required droplet size and the allowed number of captured particles for the validity of this approximation depends on the substance under investigation.
Another aspect neglected in this consideration is the fact that stationary conditions, an inherent basic for the mathematical assumptions made above, are not given when using a pulsed helium droplet source. During the passage of one pulse through the pick-up unit a time dependency of the particle density might occur due to the pick- up procedure. However, only a small fraction of the droplet pulse is relevant for the spectroscopic measurements undertaken in this research project as the pulsed helium droplet beam is only used together with pulsed lasers. These have a pulse duration in the nanosecond range (5 ns - 50 ns) and constant pick-up conditions can be assumed for the correspondingly small fraction of the droplet pulse used for spectroscopy. Furthermore, the time profiles are equal for every pulse. Thus, quasi-stationary conditions apply for
the doping of a pulsed droplet beam and the pick-up process can be described under the same assumptions as made for the continuous beam [Pen10].
The variation of the droplets’ cross sectionσremains the most serious deviation from the assumptions made above. Therefore it will be considered separately for the substances under investigation in this research work, which are phthalocyanine-water (Pc(H2O)k) clusters and anthracene-argon (An(Ar)k) clusters. The decrease in droplet size and there- fore the decrease of the droplets’ cross section depends on the energy, which is transferred into the droplets during the doping process. This energy dissipates via evaporative coo- ling, which is described in chap. 2.2 for the droplet formation. After a collision and capture the momentum and energy of the picked up particle dissipates into the helium environment. In some cases this transfer is not fully completed, but the captured par- ticle leaves the droplet again after passing through it. The probability that a capture is proceeded by the embedding of the particle is characterized by the sticking coefficient s, which is<1 for helium droplet doping. Its value depends on the interaction potential between the droplet and the particle as well as on the momentum of energy of the sample [LST95]. In the case of a completed energy transfer the embedded particle reaches the helium droplet equilibrium temperature of 0.37 K within picoseconds.
It is assumed that individually captured and cooled particles undergo coagulation within a droplet due to long-range electrostatic or van der Waals forces between the molecules and atoms. These forces are only marginally shielded by the interspersed helium as the dielectric constant of liquid 4He is almost in accordance with the vacuum value [LST95]. By these interactions clusters consisting ofkconsecutively picked up and cooled particles are formed within the droplets. This coagulation process takes place on a time scale between 10−10 s and 10−8 s [LST95] and releases energy into the droplets, which is dissipated again by evaporation of helium atoms from the droplet surface. Due to the superfluidity of the droplets the dopants move and rotate freely according to the interaction with each other. Thus, the formation of unique cluster structures occurs inside helium droplets. This was first observed for cyanoacetylene (HCCCN) forming a long chain cluster only in a helium droplets environment [CDF+06].
2.3 Doping and Coagulation within the Droplets 15
Accordingly, the formation of inhomogeneous clusters can be influenced by the order of the pick-up cells, as has been shown frequently [PVH01, LTV06, LSS07, KGMNS+07, KNT+11, DMBS14]. In this work a post pick-up process refers to the embedding of a cromophore into undoped helium droplets and the formation of a van der Waals cluster around it. In the case of a prior pick-up this sequence is changed and the cromophore is the last particle captured by the droplets.
In summary, the total energy released into the helium droplets on pick-up derives from the collision, the internal energy of the foreign particle, the binding energy between dopant and helium and the coagulation process within the droplets. As this energy is dissipated via evaporative cooling a single particle pick-up can lead to the evaporation of between hundreds and thousands of helium atoms from the droplet surface. This size decrease can be estimated for the substances under investigation. The upper boundary of the average internal energy of the gas particles can be estimated calculating withkT /2 per degree of freedom. The lower boundary can be estimated assuming an equal distir- bution of the vibrational states. Hence the internal energy of phthalocyanine at 600 K is between 15.4·103 cm−1 and 36.3·103 cm−1. The internal energy of anthracene at 300 K is between 1.9·103 cm−1 and 7.1·103 cm−1. The collision energy is estimated for an ave- rage droplet velocity of about 350 m/s from which follows a value of ca. 2.6·103 cm−1 for phthalocyanine and 0.9·103 cm−1 for anthracene, respectively. Neglecting the binding energy with helium, which is small in comparison, the the pick-up of one phthalocyanine molecule leads to an evaporation of between 3600 and 7780 helium atoms. The pick-up of one anthracene molecule provokes an evaporation of between 560 and 1600 helium atoms. These numbers are estimated with an evaporation energy of a helium atom of 5 cm−1 (≡7.2 K) on average [ST87, TV04]. Argon and water are provided at room tem- perature and thus the total energies released into the helium environment upon their capture are about 0.5·103 cm−1 and 1·103 cm−1, respectively. When multiple pick-up is considered the energy dissipation upon coagulation within the droplet must be taken in- to account, too. The energies for Ar-Ar and H2O-H2O binding are about 0.5·103 cm−1 and 3.4·103 cm−1, respectively, estimated from the corresponding evaporative energies
[Atk01]. Thus, the number of evaporated helium atoms is about 200 per Ar atom and about 880 per water molecule. This shows that small Pc(H2O)k clusters or even large An(Ar)k clusters can be embedded into medium-sized or large helium droplets. In the present study of electronic spectroscopy the superfluid droplets can be considered as large, as they consist in all measurements of >104 helium atoms, on average.
However, due to the evaporative cooling the cross section σ of the helium droplets decreases significantly during the droplet beams flight through the pick-up unit. When multiple particle doping is investigated the distinct change in droplet size influences the analysis of the data. In order to respect this effect mathematically the cluster size within the droplets, which corresponds to the number of picked up particles k, is redefined for large pick-up rates [KGMNS+07]. Assuming again that the pickup probability scales with the size of the droplets N as N2/3, the corrected average number of picked up particles can be derived from the ratio of the real droplet size (N0 −ck) to the initial droplet sizeN0.
dk= (N0−ck)2/3
N02/3 σLdn (2.6)
The constant c corresponds to the number of helium atoms evaporating upon a single pick-up andσLis defined using equ. 2.4. The integral of equ. 2.6 then yields the average number of captured and embedded particleskcorrected for the case of a multiple particle pick-up.
k = N0 c
"
1−
1− cσL 3N0n
3#
(2.7) Dopant species are divided into two groups, heliophobic and heliophilic ones. Heliophobic substances remain at the droplet surface, while heliophilic ones are located inside the droplets. This depends on the potential between the foreign particle and the helium environment. Organic closed-shell species, rare gas atoms and water molecules show heliophilic behavior while alkaline and alkaline earth metals are generally heliophobic.
All substances, which are of relevance in the present work, are heliophilic from which follows their embedding and coagulation inside the helium droplets.
3 Spectroscopy on Molecules and Clusters in Helium Droplets
In the following chapter the characteristics of fluorescence excitation spectroscopy, di- spersed emission spectroscopy and Stark spectroscopy are discussed for molecules and clusters in helium droplets. These spectroscopic methods are based on recording the fluorescence of the dopant and therefore they can only be applied for species, which exhibit an adequate fluorescence quantum yield. Besides general explanations on the spectroscopic methods the differences between helium droplet spectra and gas phase spectra are considered, since they reflect the interaction between the sample and the helium environment. In this work only organic closed shell molecules and the transitions between their singlet states are regarded.
3.1 Fluorescence Excitation Spectroscopy
The principle of laser-induced fluorescence excitation spectroscopy is illustrated in fig.
3.1. It shows the energy level diagram of the ground state S0 and the first electronically excited state S1 of an organic molecule in the gas phase (left) and in a helium droplet environment (right). For each of the electronic states several vibrational modes are shown as well. Ideally, only the lowest vibrational state of S0 is populated and all transitions caused by photon absorption emerge from this state. In order for an absorption to take place the transition has to be allowed and the laser frequencyνL has to be on resonance with it. If this is the case, the electronically excited state gets populated and emission
17
with the frequenciesνF might occur. The plot of the integrated fluorescence as a function of the excitation frequency yields the laser-induced fluorescence excitation spectrum.
The signals in the spectrum provide information on the (ro)vibrational structure of the sample’s excited state. The term electronic origin or 000 signal refers to the transition from the vibrational ground state of the S0 state into the vibrational ground state of the S1 state. The signal intensities depend on the transition dipole moments, the fluorescence quantum yields of the emissive states and the population in the S0 state. However, for supersonic jet spectroscopy as well as helium droplet spectroscopy the radiative decay upon excitation competes with other non-radiative decay mechanisms such as internal conversion, internal vibrational redistribution and intersystem crossing.
Fig. 3.1: Energy level diagram illustrating the principle of fluorescence excitation and disper- sed emission spectroscopy. The electronic S1 ←S0transitions of an organic molecule in the gas phase are compared with those in helium droplets. For details see text.
3.1 Fluorescence Excitation Spectroscopy 19
To achieve conditions where only the vibrational ground state of S0 is populated, free molecules or clusters in the gas phase can be prepared by adiabatic expansion in a su- personic jet. However, the cooling is not as efficient as the evaporative cooling observed for helium droplet experiments and thus hot bands are sometimes observed in spectra of jet cooled species. Moreover, the formation process of clusters in supersonic jet measure- ments can not be described with a well-defined statistic. By contrast, in helium droplets the cluster formation is subject to a statistical process, as explained in detail in chap.
2.3. This helps to assign the excitation signals to clusters with a distinct stoichiometry.
A further difference between gas phase and helium droplet spectra is a frequency shift of the electronic transitions, which is normally in the range of up to ±100 cm−1 [TV04]. It is provoked by the solvation of the molecule in the droplet, which leads to a stabilization of the ground state and the excited state. In the case of helium droplet spectra of phthalocyanine and anthracene, the two substances used as chromophores in this work, the signals appear red-shifted compared to the gas phase spectra [SDHT01, KRH05].
This implies a larger stabilization energy for the excited state than for the ground state.
Such a case is depicted in fig. 3.1 on the right side. The vibrational frequencies are affected much less by the droplet environment. Typically, they are only shifted by ± 5 - 10 cm−1 [CLSS01, TV04].
Moreover, the intensity pattern of the signals in supersonic jet spectra may differ from the one observed in helium droplet spectra. The reason for this is the state specificity of the radiative and non-radiative decay mechanisms [AHJ88, KM95]. As shown in fig.
3.1, in the case of isolated molecules in the gas phase emission originates only from states, which are isoenergetic to the state populated by the excitation process. In helium droplets, however, emission stems only from the vibrational ground state of the S1. Vibrational energy and other excess energy upon excitation of the dopant dissipates into the helium environment prior to radiative decay [Leh04, ST08]. This relaxation competes with the relaxation into other non-emissive states. Thus, the relaxation mechanism and the fluorescence quantum yield of the vibrational ground state of the dopant’s S1 are decisive for the signal intensities in the excitation spectra in helium droplets.
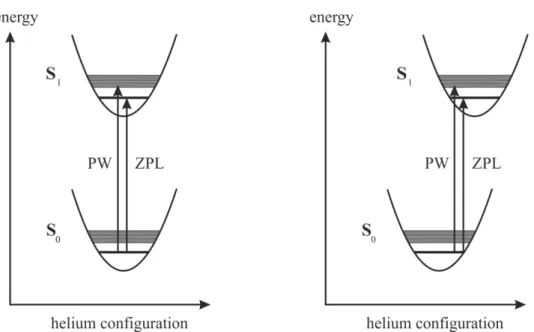
The most noticeable difference to gas phase spectra is, however, the appearance of pho- non wings (PWs) in helium droplet spectra. They accompany the pure molecular tran- sitions called zero phonon lines (ZPLs) and are a result of the coupling of the dopant’s transitions with the droplet environment. The PWs are assigned to transitions from the electronic ground state of the dopant to collective excitation states of the superfluid helium matrix [TV04]. Therefore, they always appear on the blue side of the ZPLs in the excitation spectra. This is illustrated in fig. 3.1 on the right side, where the phonons of the helium environment are depicted as quasi continuous levels accompanying each molecular state. In the case of glyoxal the PW observed in the excitation spectrum is seen as evidence of the superfluidity of helium droplets, since its structure could be re- produced using the density of states spectrum of bulk HeII [HMTV96]. In fig. 3.2 the high resolution excitation spectrum of glyoxal in helium droplets (a) is compared to the computer simulations of the PW (b). The gap of 5.6 cm−1 between the ZPL and the PW as well as the spectral structure of the PW can be explained this way. In the context of helium droplet spectroscopy the term PW generally includes all elementary excitations of the helium environment coupled to the molecular transitions. This can also be seen in fig. 3.2.
Fig. 3.2: Comparison of the excitation spectrum of glyoxal in helium droplets (a) with simu- lations of the PW using the density of states of elementary excitations in bulk HeII (b) (from [TV04]).
3.1 Fluorescence Excitation Spectroscopy 21
Yet, the phonon gap and the structure of the PW vary with the dopant under investigati- on. Often sharp lines are observed in the PW fine structure, e.g. for tetracene, pentacene, porphin and phthalocyanine [HLTV02]. These deviations from the spectral structure of elementary excitations of superfluid helium are seen as an indication for a non-superfluid layer of helium atoms localized on the surface of the dopant species [HLTV02, TV04].
Hence, the structure of a PW is determined by excitations of this helium solvation layer in addition to excitations of the superfluid droplet. This explains why the spectral shape of PWs is quite distinct for different dopant species and their excitation signals, ranging from broad features to sharp peaks. Therefore, ZPLs and PWs can not necessarily be distinguished by the shape of the signal [PWP+14].
As ZPLs and their accompanying PWs belong to different transitions they normally exhibit different transition moments. As a consequence, they differ in their saturation behavior in the excitation spectrum. In most cases including phthalocyanine [HLTV02]
and anthracene [PS12], the pure molecular transitions have the larger transition probabi- lities and thus the ZPLs are dominating the spectrum for measurements with moderate laser intensities. With an increasing photon flux, however, these transitions become more easily saturated than the corresponding PWs.
Fig. 3.3: Configuration coordinate model showing the displacement of potential energy curves, which corresponds to a weak (left) and strong (right) electron phonon coupling.
However, for some dopant species the PWs are the dominating signals in the excitation spectrum even for measurements with low laser intensities, i.e. even without a saturation of the ZPLs. This was reported e.g. for aniline [LRD05], phenol [Log08], fluorazen [Pen10]
and 4-aminophthalimid [Wir10]. The phenomenon is explained with the interaction of the dopant and the non-superfluid helium solvation layer around it. If the configuration of this layer of localized helium atoms differs for S0and the S1a change in the ratio of the transition probabilities of ZPL to PW is caused. This is illustrated in the configuration coordinate model of fig. 3.3 showing the dependence of the dopant’s potential energy curves on the configuration of the helium solvation layer for a one-minimum potential.
The so-called electron phonon coupling responsible for the dominance of the PWs be- comes stronger with a growing displacement of the potential energy curves, i.e. with an increasing difference between the configurations of the helium solvation layer in S0 and S1 [Log08, Pen10]. In addition, it has to be assumed that the potential energy surfaces in S0 and S1 may exhibit more than one stable minimum and have a more complex structure than depicted in fig. 3.3. Transitions of metastable configurational variants of the dopant-helium solvation complex might occur, which do not inevitably exhibit stronger oscillator strengths than the PWs. For these reasons a definite assignment of excitation signals to ZPLs or PWs is impossible on the basis of their saturation behavior [PWP+14].
As indicated in the preceding paragraph and fig. 3.3, the helium droplet environment also influences the line width and fine structure of the ZPLs. Ideally, the line width in ex- citation spectra is homogeneous and only determined by the life time of the excited state, which leads to Lorentzian shaped lines. Often, however, the line width of the excitation laser is the limiting factor. Also Doppler broadening or power broadening can influence the signals line width. In helium droplet spectra sharp signals with Lorenzian line shapes are observed for many organic molecules, e.g. in the case of phthalocyanine [PRV+11] and porphine [Rie11]. However, the droplet size distribution affects the line shape as it leads to a small inhomogeneous broadening [DS01, SDHT01]. In addition, for some molecules in helium droplets, e.g. pentacene [HLTV01] and 9,10-dichloroanthracene [PS13], single
3.1 Fluorescence Excitation Spectroscopy 23
vibronic transitions in the excitation spectrum appear broadened. In the case of sub- stituted pyrromethene dyes in helium droplets only the electronic origin remains sharp [PRV+11]. For other molecules, as e.g. 3-hydroxyflavone [LPV+09], 9-phenylanthracene [PGDS10] and 2-methylanthracene [PGDS10], the broadening is even observed for the 000 transition and no sharp signals remain in the excitation spectrum. The broadening is explained as a result of a drastic change in the electron density distribution of the dopant upon electronic excitation, which induces an enhanced coupling of the helium environment to the dopant [PRV+11].
Another influence of the solvation of a molecule in helium droplets is a splitting of the ZPLs in the excitation spectrum, which has been reported, among others, for te- tracene, anthracene, some metal-phthalocyanines and idole species [HLTV98, LLTV01, LSK+04, KRH05, BMLS07, PS12]. This phenomenon was investigated most thorough- ly for tetracene showing a 1.1 cm−1 splitting into an α and β line for all ZPLs in the excitation spectrum in helium droplets [HLTV98, HLTV01, PVH01, LTV04, LTV06].
It could be explained by different structures of the helium solvation layer around the dopant analogously to different sites appearing in solid matrices [HLTV01, LS05]. These observations confirm the possibility of several minima in the potential energy surfaces of dopant-helium solvation complexes in S0 and S1, which was discussed in the preceding paragraphs.
Many of the described phenomena regarding the fine structure of ZPLs and PWs reveal the strong influence of a non-superfluid solvation layer around the chromophore on fluo- rescence excitation spectra measured in helium droplets. Apart from these observations also rotational spectra indicated the existence of a shell of localized helium atoms around the sample species. It was deduced from the observation that the effective moment of inertia of the solvated molecule was significantly larger than the one of the isolated sy- stem [HMTV95, CLSS01, TV04, CDF+06]. Moreover, theoretical studies confirmed the assumption of a coexistence of a superfluid phase and a normal-fluid solvation layer for doped helium droplets, too [WHKW05, WDW09].
3.2 Dispersed Emission Spectroscopy
To understand the principle of dispersed emission spectroscopy fig. 3.1 can be regarded again. The basis of the technique is to keep the frequency of the excitation laserνL fixed on resonance with one of the transitions. Thus, the excited state gets populated and emission with the frequenciesνF can be recorded in the case of an adequate fluorescence quantum yield. To record a spectrum the emission is dispersed and the fluorescence intensity is plotted according to its frequency. The signals in the spectrum provide information on the (ro)vibrational structure of the sample’s ground state. Their intensity pattern is determined by the transition moments, which are given by Franck-Condon- factors depending on the geometry of the dopant species in the ground state and in the excited state [Fra26, Con26].
In the case of isolated molecules in the gas phase emission is only observed from states, which are isoenergetic to the state populated by the excitation, as shown on the left side of fig. 3.1. Thus, the vibrational excess energy and therefore the excitation frequency of the laserνLis decisive for the vibrational frequencies and the signal intensities observed in the emission spectrum. However, in helium droplets the main characteristic of disper- sed emission spectroscopy is the fact that fluorescence only occurs after any vibrational or other excess energy of the excited dopant has dissipated into the helium environment.
This is shown on the right side of fig 3.1. As a consequence emission measured in helium droplet experiments exclusively stems from the vibrational ground state of the dopant’s S1. If the origin of the dispersed emission spectrum coincides with the excitation frequen- cy it can definitely be assigned to the 000 transition of the dopant system. Thus emission spectroscopy helps to identify the electronic origin of a chromophore in helium droplet spectra and can be used to distinguish between isomeric clusters, as they show differing emission spectra. However, this analysis is limited by the resolution of the spectra, which depends to a large extent on the experimental conditions (cf. chap. 4.2.3.2). In contrast to gas phase spectra the dispersed emission recorded for molecules or clusters in helium droplets is generally independent of the excitation frequency νL and molecules excited
3.3 Stark Spectroscopy 25
into high-energy vibrational states show the same emission frequencies νF as those ex- cited at the electronic origin [LS03, LS04b, LS04a, LS05, PS12, PS13]. Thus, emission spectra in helium droplets are only comparable with gas phase spectra measured for the excitation of the 000 transition.
As in the case of fluorescence excitation spectroscopy, however, the droplet environment affects the fine structure of the signals also in dispersed emission spectra. In addition to the usually sharp lines of the molecular transitions, whose line width is normally limited by the experimental conditions, PWs are observed as well. This is depicted in fig. 3.1 on the right side for the PW accompanying the transition from the excited state into the vibrational ground state of S0.
Also the influence of the non-superfluid solvation layer of localized helium atoms on the dopant’s surface can be observed in emission spectra recorded in helium droplets. For some molecules and clusters, e.g. Pc, Mg-Pc and Pc(Ar)k withk = 1,2,3 [LS03, LS04a, LS04b, LSS07], it provokes a line splitting of the emission signals. As each isomer of the dopant-helium solvation complex exhibits its own emission this phenomenon indicates a relaxation dynamic upon the excitation of a distinct isomer. This theory was confirmed for Pc by path-integral Monte-Carlo calculations, which identified two different confi- gurations of the helium solvation layer around the chromophore [WHKW05]. A more detailed explanation on the spectroscopy of Pc is discussed in chap. 5.1.
3.3 Stark Spectroscopy
The basic principle of Stark spectroscopy is to disturb an initially isotropic molecular ensemble by the application of an external electric field. In the gas phase molecules or clusters can rotate freely and thus show isotropy. Free rotation is also ensured in superfluid helium droplets, as was demonstrated in spectroscopic experiments revealing the fully-resolved rotational fine structure of molecules in helium droplets [HMTV95, GTV98]. A homogeneous electric field can be used in order to transform the molecules or clusters under investigation into an anisotropic ensemble. For the interaction with the
external field the sample particles are required to possess a permanent dipole moment.
Then the potential induced upon the molecular electric dipoleµ~p by the external electric fieldE~f can be described according to equ. 3.1. The angle between the electric field and the dipole moment is given by ϑ.
Epot =−µ~p·E~f =−µp·Ef ·cosϑ (3.1)
Thus, the isotropy of the molecular ensemble is broken by the application of an external electric field. It hinders the free rotation of the molecules or clusters, which leads to a splitting of initially degenerated rotational states. This phenomenon is known as Stark effect. However, an alignment of the sample particles in the external electric field is only achieved forErot<< µp·Ef, i.e. if the energy gained by the orientation of the molecular dipoles in the external field significantly exceeds the rotational energy. This results in an oscillating movement of the dipoles around the direction defined by the electric field and the rotational states of the particles undergo a change into so-called pendular states.
Therefore, the spectroscopic technique to investigate this anisotropy is also known as pendular state spectroscopy.
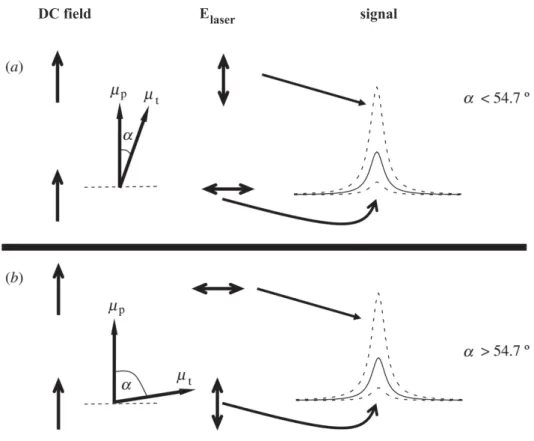
In order to achieve information about the alignment of molecules or clusters under investigation the probe technique has to be sensitive to detect the anisotropic angular distribution generated by the static electric field. The method applied in the present work is based on recording the laser-induced fluorescence of the sample particles. The fluorescence intensity recorded for an adjustment with the laser polarization parallel to the electric field is compared to the fluorescence intensity recorded for a perpendicular adjustment. In the case of an anisotropic ensemble of chromophores these intensities differ depending on the orientation of the transition dipole moment µ~t with respect to the electric dipole momentµ~p. Fig. 3.4 illustrates the correlation between the orientation of µ~t and µ~p, the laser polarization, the direction of the electric field and the resulting transition intensity. Generally, the best transition probability is observed when the laser polarization matches the direction of the transition dipole momentµ~t.
3.3 Stark Spectroscopy 27
Fig. 3.4: Schematic depiction illustrating the effect of a DC electric field on the intensity of a transition signal for different directions of the laser polarizationElaser, parallel and perpendicular relative to the electric field. Chromophores with a transition dipole moment µ~t rather parallel (a) and rather perpendicular (b) to the electric dipole moment µ~p are distinguished. The solid lines represent the field free experiment.
(from [CDM05])
In the upper panel (a) of fig. 3.4 the transition dipole moment of the chromophore is almost parallel to the electric dipole moment. In such a case the signal is most intensive for a parallel adjustment of the laser polarization with respect to the electric field. The signal decreases significantly for a perpendicular adjustment. The reverse is the case for the situation depicted in the lower panel (b) of fig. 3.4, where the transition dipole mo- ment of the chromophore is close to perpendicular to the electric dipole moment. These situations are compared to the field free experiment. The corresponding signal is repre- sented in fig. 3.4 by a solid line. The difference between the absorption of light polarized parallel and perpendicular to an orientation axis is also known as linear dichroism.
This research work was performed with two different experimental setups. One consists of a vacuum apparatus for continuous droplet beams combined with continuous laser systems. Comparable helium droplet machines have been described frequently e.g. in [BKN+90, TV98, TV04]. The second setup combines pulsed laser systems with a vacuum apparatus for pulsed droplet beams equipped with an Even Lavie Valve for cryogenic application. It was first described in [PRD+09, Pen10]. This chapter is devoted to the detailed description of both setups.
4.1 Continuous Droplet Beam Experiments
4.1.1 Helium Droplet Apparatus
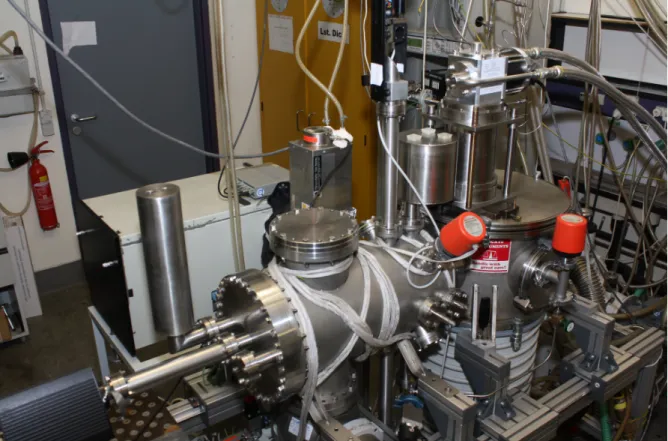
A picture of the vacuum apparatus for continuous droplet beams used for this study can be seen in fig. 4.2. It consists of two differentially pumped vacuum chambers, the source chamber and the detection chamber. The schematic drawing of fig. 4.1 illustrates the essential components for the droplet beam formation, skimming, doping and detection.
For the experiments undertaken with this machine conditions near the ultra high vacuum range are indispensable. The typical pressure values are listed in tab. 4.1. In each chamber the vacuum is measured with an Active Inverted Magnetron Gauge / Penning Gauge (Edwards AIMSL-NW25) and the prevacuum with an Active Pirani Gauge (Edwards APG-M-NW16). They are read out with an Active Gauge Controller (Edwards RS232 Option).
28
4.1 Continuous Droplet Beam Experiments 29
Fig. 4.1: Schematic depiction of the helium droplet apparatus.
Fig. 4.2: Photo of the helium droplet machine for measurements with a continuous droplet beam.
Tab. 4.1: Base and operating pressures in mbar. The operating pressure refers to beam gene- ration at 11 K and 20 bar.
chamber base pressure operating pressure source chamber 2·10−6 6·10−5 detection chamber 5·10−8 4·10−7
The formation of a directed helium droplet beam takes place in the source chamber of the apparatus, which is evacuated by an oil diffusion pump (pumping rate 6000 l/s, Leybold DI 6000 E). A roots pump (Leybold Ruvac WAU 251) and a rotary vane pump (Leybold Trivac D65B) act as booster pumps. The droplet beam is generated by super- sonic expansion through a continuous flow nozzle with a diameter of 5 µm. The nozzle is mounted to the second stage of a closed cycle helium cryostat (Sumitomo cold head RDK-40852 and compressor unit F-50Hw), which suffices to cool down to a nozzle tem- perature of 7.5 K. Higher temperatures are accomplished with an accuracy of ± 0.2 K by counter heating with a thermal resistor. A silicon diode mounted on the second stage of the cryostat is used as sensor for reading the so-called “nozzle temperatures”. The temperature is stabilized by a remote control system (Neocera LTC-11). Temperatures between 10.3 K and 12 K were used for the experiments undertaken with this apparatus.
Through the nozzle pre-cooled4He (purity 99.9999 %, Linde Helium 6.0) at a stagnation pressure of 20 bar is adiabatically expanded into the source chamber. This results in the formation of droplets with an average size in the order of 104 helium atoms per droplet.
In order to adjust the droplet beam axis the whole expansion unit can be moved in the three directions in space. At 1.8 mm distance from the nozzle the continuous droplet beam passes a skimmer, which separates the two vacuum chambers. It is mounted to a conically-shaped wall and exhibits an opening diameter of 0.7 mm.
In the detection chamber vacuum is generated by a turbo molecular pump (pumping rate 500 l/s, Pfeiffer TPU 510) and a rotary vane pump (Edwards RV12). The doping of the droplets, the excitation of the sample and the measurements are undertaken in this chamber. For the research of inhomogeneous clusters inside superfluid helium droplets two separate pick-up units are required. About 9 cm within the detection chamber
4.1 Continuous Droplet Beam Experiments 31
the droplet beam enters the first pick-up cell consisting of a cylindrical oven for solid probe substances. The length L of the pick-up cell is equal to the inner diameter of the cylinder, which is 20 mm. The helium droplets pass the oven via two opposite holes with a diameter of 4 mm each. The sample is provided as a pellet in a holding cap of the oven. For sublimation it can be heated resistively up to 400 ◦C with a tunable DC- voltage supply (Voltcraft TNG40). The temperature is controlled with a thermocouple (type k, Thermocoax) connected to the oven. To exchange the probe the whole pick-up unit can be removed from the apparatus without breaking the vacuum via an airlock.
This pick-up unit was used for doping the helium droplets with Pc. In order to shield the photomultiplier tube from black body radiation the oven is encased in a stainless steel cylinder and the entire pick-up unit is surrounded by a cylindrical copper shield. Both have openings for the droplet beam to pass through, 5 mm and 7 mm, respectively.
The copper housing is cooled to 77 K via contact with an external liquid nitrogen reservoir. This ensures a better thermal shielding of the oven and considerably reduces contamination of the detection chamber, for water and other impurities as well as effusing probe molecules from the oven are condensed onto this liquid nitrogen trap.
The second pick-up unit employed to dope the helium droplets with water is located at a distance of about 13 cm from the skimmer and consists of a stainless steel pipe of about 15 cm in length. In order to realize doping a continuous flow of probe molecules is perpendicularly intersected with the droplet beam. The pipe’s diameter, which is 6 mm, therefore corresponds to the lengthLof the pick-up cell. The helium droplet beam passes this pick-up unit via two opposite openings of 4 mm. In order to control the sample flow the pipe is connected to a gate valve and a leak valve. The leak valve (Leybold 283-41-V2) is operated manually and enables a gas flow from 5.0·10−6 mbar l/s up to 1000 mbar l/s. This performance suffices for doping the helium droplets with single molecules, but also enables the building of bigger clusters with up to several hundreds of molecules. Implementing stable pick-up conditions for water doping poses a challenge, because of fluctuations in the gas flow caused by condensation. The distilled water is provided in a small glass container, which is connected to the metering valve via a piping
system consisting of stainless steel tubes. This construction is based on the description in [Chr13], but could be considerably improved by shortening the pipeline from 1.5 m down to 15 cm and connecting it directly to the water reservoir. To avoid condensation the stainless steal pipe and the two valves were constantly heated to 35 ◦C during measurements. A convenient vapor pressure is achieved by cooling the water reservoir with salty ice water, which offers a minimum temperature of -23◦C.
About 17 cm from the skimmer laser excitation and signal detection takes place (cf.
chap. 4.1.2). For this purpose the droplet beam is intersected at right angle with a laser beam. The detection of the laser-induced fluorescence is conducted perpendicularly to both beams. Also perpendicular to both beams two capacitor plates are installed to enable the application of a static homogeneous electric field in the detection area. They are mounted at a distance of 1.2 cm and one electrode exhibits a center hole, so as not to block the fluorescence light. The voltages are provided by a commercial high voltage supply regulated via an analogue voltage between 0 V and 10 V so as to be able to change the Stark field continuously. For this research project voltages between 0 V and 20 kV were applied to the electrodes, though voltages up to 25 kV would be possible without emitting of electric sparks. The output voltages are read out and recorded with a data acquisition program on the experiment’s PC.
A residual gas analyzer operating on the basis of a quadrupole mass filter (Inficon Tran- spector H300M) is mounted to the backside of the detection chamber on-axis to the dro- plet beam. It permits the detection of mass to charge in a range of m/z = 1 - 300 amu and allows to monitor the alignment of the droplet beam during operation. It is used to align the nozzle, to check on the droplet formation and to analyze the doping conditions.
To avoid background signal, the analyzer is switched off during measurements.
4.1.2 Laser System and Optical Detection
The continuous visible light required for these studies is provided by a tunable conti- nuous wave dye laser (Coherent 899-29 autoscan) pumped by a continuous Ar+-laser
4.1 Continuous Droplet Beam Experiments 33
(Coherent Innova Sabre R). The dye laser, which is equipped with a wavemeter, is run in single-mode operation with fully automatic frequency tuning. It offers an accuracy of 0.0017 cm−1 and a spectral linewidth ≤ 1 MHz. Output powers are typically between 150 mW and 300 mW, but these values are reduced by about 20 % on the way to the excitation region inside the helium droplet apparatus.
An optical fiber is used to guide the beam from the laser to the machine, where it is coupled into the detection chamber from above. To minimize reflections and to avoid interferences the quartz window used for this purpose is mounted at Brewster angle (55,58◦). For a good signal to noise ratio (S/N-ratio) in the spectra it is essential to reduce laser stray light as much as possible. Therefore the beam does not directly enter the detection chamber after passing the quartz windows, but is guided through a 20 cm tube with an inner diameter of 4 cm. It is blackened and equipped with baffles in such a way as to minimize stray light of the laser beam entering the vacuum chamber. The beam passes an analogue construction at the exit side. In this study measurements with the laser polarization perpendicular to the Stark field were conducted as well as such with the laser polarization parallel to the electric DC field. Since the transmission of Brewster windows is sensitive to the laser polarization, the entire optical setup had to be turned by 90◦ when switching between the two arrangements.
Perpendicular to the two intersecting beams the optical detection unit is mounted. A quartz lens collects the fluorescence light at 6 cm from the excitation region. This di- stance corresponds to the lens’ focal length. With a second lens the fluorescence signal is imaged onto the photocathode of a photomultiplier tube (PMT) (Hamamatsu R943- 02). To reduce thermal noise the PMT is cooled to -25 ◦C. Besides, an edge filter can be placed in front of the photocathode to reduce scattered laser light and thus additio- nally improve the S/N-ratio. The PMT signal is then amplified by a factor of five via a Preamplifier (Stanford Research Systems SR445) before being recorded by a photon counter (Stanford Research Systems SR 400). Finally the data is read out, stored and imaged by a PC, where a LabView program is used for the data acquisition and the graphic display.
![Fig. 2.1: Phase diagram of 4 He (from [BKN + 90]). The solid lines are phase boundaries, the dashed lines represent isentropes for different expansion conditions](https://thumb-eu.123doks.com/thumbv2/1library_info/4652089.1608332/11.892.225.622.109.463/phase-diagram-boundaries-represent-isentropes-different-expansion-conditions.webp)
![Fig. 2.3: Velocities of helium droplets produced at different expansion conditions with an Even Lavie Valve (from [Pen10]).](https://thumb-eu.123doks.com/thumbv2/1library_info/4652089.1608332/17.892.204.640.734.1062/velocities-helium-droplets-produced-different-expansion-conditions-lavie.webp)
![Fig. 3.2: Comparison of the excitation spectrum of glyoxal in helium droplets (a) with simu- simu-lations of the PW using the density of states of elementary excitations in bulk HeII (b) (from [TV04]).](https://thumb-eu.123doks.com/thumbv2/1library_info/4652089.1608332/27.892.219.622.750.1077/comparison-excitation-spectrum-glyoxal-droplets-lations-elementary-excitations.webp)