The German
Residential Energy Consumption Survey 2011-2013
Rheinisch-Westfälisches Institut für Wirtschaftsforschung (RWI)
forsa Gesellschaft für Sozialforschung und statistische Analysen mbH
Extended Abstract for Research Project No. 54/09 commissioned by Federal Ministry of Economics and Technology
August 2015 Team:
RWI: Prof. Dr. Manuel Frondel (Project Leader), Dr. Mark Andor, Dr.
Nolan Ritter, Stephan Sommer, Prof. Colin Vance, Ph.D.
forsa: Dr. Peter Matuschek, Ute Müller
Executive Summary
This study aims to estimate the energy consumption of German private households for the years 2011 to 2013. A nation-wide survey among more than 8,500 households serves as a starting point to determine the consumption of electricity and various fuels for residential heating pur- poses and due to private car usage. Apart from providing socio- economic information, responding households were interviewed with respect to their housing conditions, dwelling characteristics and the con- sumption of fossil fuels, electricity and renewable energy sources. In order to derive consumption figures for the total of private households in Germany, the sample estimates of each energy source were extrapolat- ed.
Our results will be compared with those of 2010 that are extract- ed from the preceding study performed by RWI and forsa (2013). As these are based on the same interview tool and panel of households, they should be well-suited for comparison purposes. Moreover, the re- sults will be compared to the values of the German energy balances (AGEB). In comparison to the preceding studies completed by RWI and forsa (2008, 2010, 2013) the sample was extended by about 2,000 households succeeding in a higher statistical precision of our estimates.
Beyond estimating consumption figures, this study analyzes the result- ing residential energy costs for 2012.
Methodology
The current study is in many respects comparable to its predecessors, the German Residential Energy Consumption Surveys 2005–2010, espe- cially with respect to the interview tool and the extrapolation procedure (RWI, forsa 2008, 2010, 2013). The extrapolation was stratified by re- gion and building type, or in exceptional cases (e.g. in the case of elec- tricity) by household size. Recognizing that the ability to provide details about, for example the electricity consumption, may be correlated with the consumption behavior, econometric discrete choice models were used to derive a weighting scheme to overcome possible problems with self-selection effects in the data. Self-selection might occur if house- holds who are unaware of their energy consumption are also less dili- gent with keeping their energy bills, and are therefore unable to quanti-
fy their energy consumption. In consequence, the sample would sys- tematically consist of households with a low consumption, and the “true”
residential energy consumption would be underestimated. Applying dis- crete-choice models and the resulting weighting scheme aims at ac- counting for such potential data problems.
Discrete-choice models are econometric regression models in which the dependent variable is categorical. In this case a binary cate- gorization was created that distinguishes households according to whether or not they gave valid information on fuel consumption. Based on socio-economic characteristics, for each household a probability is estimated that the observation falls into one of these two categories.
These probabilities were used to develop a weighting scheme that sys- tematically puts more weight on households with low response probabili- ties and vice versa. In accordance with our previous studies, applying this weighting scheme practically does not yield any differences at all with respect to consumption figures.
The survey was performed via forsa.omninet, an interview tool that allows an easy implementation of complex questionnaires by filter techniques and visual assistance providing high response rates and high data reliability. This tool avoids entry errors during the data transmis- sion and carries out plausibility as well as consistency checks during the data input by the participant. Furthermore, the visualizing abilities turn out to be very advantageous since they resolve the problem of complex energy bills by projecting them on the television or computer screen.
After a household has indicated its respective billing company, the survey procedure subsequently presents an exemplary bill issued by this company. The system goes step by step through the details of the exemplary bill, while highlighting the parameters of interest. By this means, the interview is also manageable for households with little tech- nical understanding.
Like in the preceding reports of RWI and forsa (2008, 2010, 2013), the residence information provided by the households is used in order to consider the individual climatic conditions of the households.
Household-specific climate conditions were obtained by a grid of climate stations operated by the German Weather Service (DWD), and geo- graphically interpolated to the households’ places of residence using
heating degree days. This procedure considerably improves the quality of the results for storable fuels such as heating oil.
Results
Generally, all results obtained by a sample survey entail a certain de- gree of statistical uncertainty, having also implications for the extrapola- tion procedure. By definition, a sample consists of only a fraction of the population, and the sample estimates will therefore randomly deviate from the true parameters in the population. Consequently, in addition to the estimated average consumption, this study provides the range of the confidence interval, which is likely to include the true, but unknown population parameter with a probability of 95%. These confidence inter- vals are indispensable when extrapolation results are compared to re- sults of other data sources, for instance to the consumption figures pub- lished by AGEB.1 It would be highly unlikely if the AGEB-values coincided perfectly with the extrapolation results obtained in this study. But if de- viations occur, it should be assessed whether they are random or sys- tematic. To answer such questions, the empirical literature applies the computation of standard errors and confidence intervals.
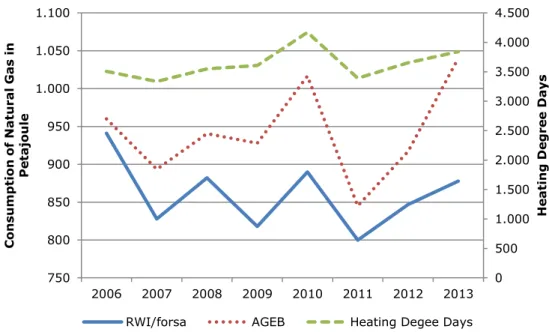
By comparing the results of this study with the consumption val- ues of the AGEB it seems salient that for most energy sources the same pattern occurs, which could also be observed for the preceding studies for 2005-2010: Compared to the AGEB values, the results for natural gas, district heating, hard coal and lignite of this study are lower, while our consumption figures for heating oil are substantially higher. Howev- er, this is mainly due to methodological reasons: While AGEB (2014) publishes the amount sold to households, in this study the factual con- sumption is estimated.
For the period from 2006 to 2013 our estimated consumption fig- ures for natural gas are significantly below those published by AGEB (Figure Summary 1). Differences amount up to 160 Petajoule for a con- sumption level between 800 and 950 Petajoule. Causes for these sys-
1“[T]o reject a hypothesis because the data show `large´ departures from the prediction requires a quantitative criterion of what is to be considered a large de- parture (Jeffreys 1967, 384)”, in Ziliak, McCloskey (2004:528). Interpreted in this comparison, this means: Criteria such as standard error are required to evaluate whether the extrapolation results do not deviate randomly but systematically from
tematic deviations remain unclear. Beside heating oil and natural gas, large deviations also emerge for hard coal and lignite. While AGEB as- sesses a joint consumption level of 31 Petajoule for 2012, this study estimates that private households consumed about 9 Petajoule.
Figure Summary 1: Comparison of the Extrapolation Results for Natural Gas Pub- lished by RWI/forsa and AGEB
Note: Values for 2013 are preliminary.
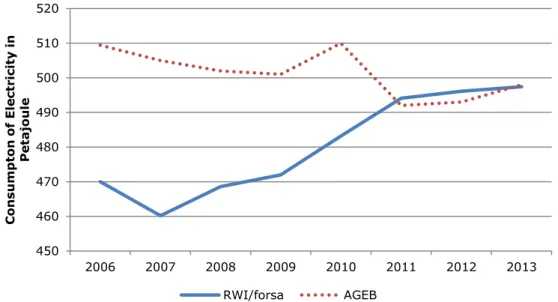
Turning to electricity, deviations are negligible under statistical and practical considerations. In contrast, the deviations of 5-6% found in previous studies performed by RWI and forsa (2005, 2008, 2010 and 2013) are not detected (Figure Summary 2). Analyzing the evolution of the consumption figures of electricity published by AGEB, it apparently drops markedly from 510 Petajoule in 2010 to 492 Petajoule in 2011.
According to our estimations, there is no evidence of such incident.
0 500 1.000 1.500 2.000 2.500 3.000 3.500 4.000 4.500
750 800 850 900 950 1.000 1.050 1.100
2006 2007 2008 2009 2010 2011 2012 2013
Heating Degree Days
Consumption of Natural Gas in Petajoule
RWI/forsa AGEB Heating Degee Days
Figure Summary 2: Comparison of the Extrapolation Results for Electricity Published by RWI/forsa and AGEB
Note: Values for 2013 are preliminary.
Differences are also small for the total energy consumption: Un- der statistical aspects the values for 2011 and 2012 coincide with those published by AGEB, although there are severe differences for specific fuels. Long-term comparisons show that this was not always the case (Figure Summary°3). Moreover, the AGEB values are much more sensi- ble with respect to changes in degree heating days.
Figure Summary 3: Comparison of the Total Energy Consumption (without Electricity and Gasoline) Published by RWI/forsa and AGEB
Note: Values for 2013 are preliminary.
450 460 470 480 490 500 510 520
2006 2007 2008 2009 2010 2011 2012 2013
Consumpton of Electricity in Petajoule
RWI/forsa AGEB
0 500 1.000 1.500 2.000 2.500 3.000 3.500 4.000 4.500
2.200 2.250 2.300 2.350 2.400 2.450 2.500 2.550 2.600 2.650 2.700
2006 2007 2008 2009 2010 2011 2012 2013
Heating Degree Days
Total Energy Consumption in Petajoule
RWI/forsa AGEB Heating Degee Days
Our estimates indicate that about 1,200 PJ are spent for private car usage in 2013, which accounts for nearly one third of the total ener- gy consumption of private households. Between 2010 and 2013 the cor- responding use of energy did not change in a statistically significant way. Addressing renewable energies, 11% of the households own solar- thermic systems. Further, almost 7% of the households are in posses- sion of photovoltaic systems and about 4% are equipped with heat pumps.
Summary and Conclusions
By the repeated survey among private households, a study design for the residential use of energy was continued that attracts attention throughout Europe. No other country is equipped with a dataset of sev- eral thousand households that are repeatedly surveyed about their en- ergy consumption and their housing conditions. By this means, the in- formation published by the German energy balances is supplemented and useful insights into private households’ energy use are provided.
Yet, there are some open issues as to whether some fuels – especially natural gas – show systematic differences between the figures published by RWI and forsa and those published by AGEB.
A special focus of the survey lies on the elicitation of energy costs of private households. Our analysis shows that energy costs can repre- sent a considerable share of the household net income, especially among households in lower income classes. Although the sample was extended by about 2,000 households in order to increase the number of valid responses, the number of observations in lower income classes is not satisfying since low-income households tend to refuse providing in- formation on their income situation.
A deeper and more representative analysis of the energy cost evolution and the resulting burden for households seems to be appropri- ate in the light of presumably rising electricity prices. This holds not least in the context of the findings of this study: Instead of an annual electricity consumption of 3,500 kWh, the consumption of a typical three-person household can be expected to be about 4,400 kWh and more. A typical four-person household consumes up to 5,000 kWh per year.