The German
Residential Energy Consumption Survey 2006-2008
Rheinisch-Westfälisches Institut für Wirtschaftsforschung (RWI)
forsa Gesellschaft für Sozialforschung und statistische Analysen mbH
Extended Abstract for Research Project No. 54/09 commissioned by Federal Ministry of Economics and Technology
October 2011 Team:
RWI: Prof. Dr. Manuel Frondel (Project Leader), Dr. Peter Grösche (Project Leader), Nolan Ritter, Dr. Harald Tauchmann, Prof. Dr.
Colin Vance
forsa: Peter Matuschek, Ute Müller
Executive Summary
The aim of this study is to estimate the energy consumption of German private households in the years 2006 to 2008. A nation- wide survey among more than 6 700 households serves as starting point to determine the consumption of various fuels for residential purposes and due to private car-usage. The households were in- terviewed with respect to their housing conditions, the characteris- tics of the respective dwelling, and the equipment with electric appliances. The sample estimates were extrapolated for the cor- responding years to derive consumption figures for the entire pop- ulation of private households in Germany.
Renewables gain increasingly importance in the residential sector. In order to gauge the consumption of renewables in the household sector, a telephone survey among some 80 000 house- holds was conducted in 2006. For the present study, the usage of renewables was updated using a smaller sample of households.
The task of this study was enhances with a deeper analysis of the energy consumption behavior of the interviewed house- holds. A new survey called “Energy Diary” was designed in order to record the equipment and usage of electric appliances on a regular basis. The first wave of the obtained information was used to esti- mate the electricity consumption for several purposes, such as water heating, lighting, and usage of appliances.
Methodology
The current study is in many respects comparable to its predeces- sors, the German Residential Energy Consumption Survey 2003 and 2005. The households of the forsa.omninet-panel serve again as survey sample, who are equipped with an interface that allows an easy implementation of complex questionnaires by filter tech- niques and visual assistance. This tool further allows for automatic consistency checks during the data input by the participant. By this means, the forsa.omninet-panel ensures that the collected data is of high quality.
The extrapolation was stratified by region and type of build- ing, or in exceptional cases by household size. Econometric dis-
crete choice models were used to derive a weighting scheme to overcome possible problems with self-selection effects in the data.
Self-selection might occur, if households who are hardly aware of their energy consumption are also less diligent with keeping their energy bills, and are therefore unable to quantify their energy con- sumption. In consequence, the sample would consist systematical- ly of households with a low consumption, and the “true” residential energy consumption would be underestimated. The derived weighting scheme aims at accounting for such potential data prob- lems.
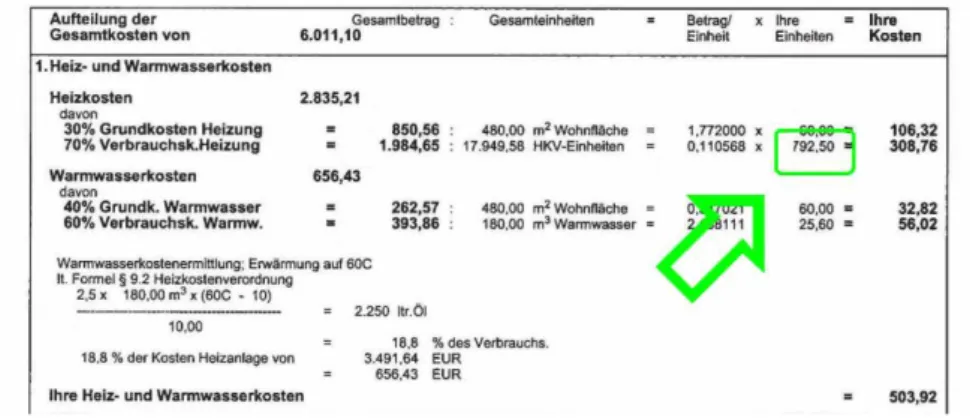
Notoriously critical points for surveys on energy consump- tion are the complex heating bills for dwelling in multi-family homes with central heating. To address this challenge, an inter- view tool was developed that draws extensively on the visualizing and filter abilities of the forsa.omninet-system. After a household has indicated its respective billing company, the survey procedure subsequently presents an exemplary bill issued by the company.
The system goes step by step through the details of the exemplary bill, while highlighting the parameters of interest (see Figure 1). By this means, both the error rate and drop-out quota of households living in multi-family houses with central heating were reduced substantially.
Figure 1: Screenshot of an exemplary bill
Measuring consumption is particularly challenging for stockable fuels, such as fuel oil. Typically, households are able to provide information about the purchased or delivered quantity, while the consumed quantity is likely to deviate from the purchase. To miti- gate such problems, the households’ deliveries were surveyed for the period from 2005 to 2009, and the household’s fuel consump- tion was calculated using information of heating-degree days of the corresponding years. The household-specific climate conditions were obtained by a grid of climate stations operated by Deutscher Wetterdienst, and geographically interpolated to the households’
places of residence.
Generally all results obtained by a sample survey entail a certain degree of statistical uncertainty, having also implications for the extrapolation procedure. By definition, a sample consists of only a fraction of the population, and the sample estimates will therefore randomly deviates from the parameters in the popula- tion. Therefore, in addition to the estimated average consumption this study provides the range of the confidence interval, which is likely to include the true, but unknown population parameter with a probability of 95%. These confidence intervals are indispensible when extrapolation results should be compared to results of other data sources, for instance to the consumption figures published in the German energy balances.
Results
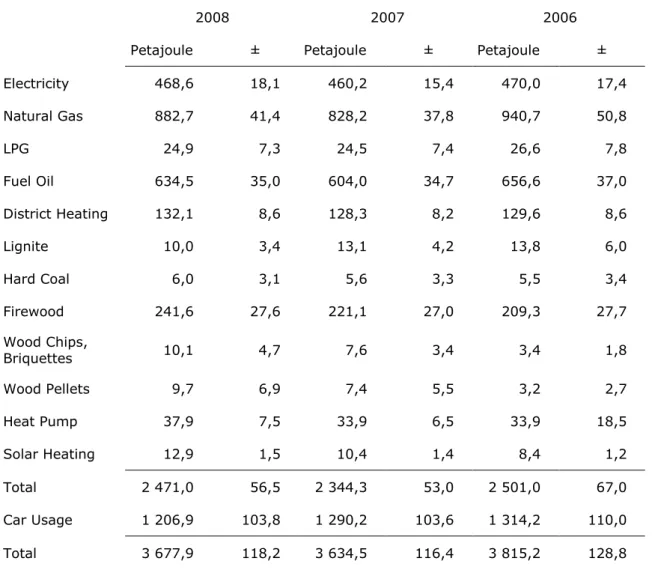
German households consumed 2008 about 2 470 PJ of energy, excluding the consumption of private car-usage (Table 1). Natural gas (883 PJ) and fuel oil (635 PJ) are the most important fuels in the residential sector, followed by electricity with 469 PJ. Interes- tingly, biomass in terms of wood provides 261 PJ, and contributes 11% to residential energy consumption for housing purposes in 2008. To our estimates, about 1 207 PJ are spent for private car usage in 2008. This accounts for nearly 33% of the total energy consumption of 3 678 PJ.
Table 1: Residential Energy Consumption 2006-2008 in Petajoule
2008 2007 2006
Petajoule ± Petajoule ± Petajoule ±
Electricity 468,6 18,1 460,2 15,4 470,0 17,4
Natural Gas 882,7 41,4 828,2 37,8 940,7 50,8
LPG 24,9 7,3 24,5 7,4 26,6 7,8
Fuel Oil 634,5 35,0 604,0 34,7 656,6 37,0
District Heating 132,1 8,6 128,3 8,2 129,6 8,6
Lignite 10,0 3,4 13,1 4,2 13,8 6,0
Hard Coal 6,0 3,1 5,6 3,3 5,5 3,4
Firewood 241,6 27,6 221,1 27,0 209,3 27,7
Wood Chips,
Briquettes 10,1 4,7 7,6 3,4 3,4 1,8
Wood Pellets 9,7 6,9 7,4 5,5 3,2 2,7
Heat Pump 37,9 7,5 33,9 6,5 33,9 18,5
Solar Heating 12,9 1,5 10,4 1,4 8,4 1,2
Total 2 471,0 56,5 2 344,3 53,0 2 501,0 67,0
Car Usage 1 206,9 103,8 1 290,2 103,6 1 314,2 110,0
Total 3 677,9 118,2 3 634,5 116,4 3 815,2 128,8
Compared to 2006, residential energy consumption has declined by 1.6%. While electricity consumption remains almost constant, fuel oil and gas consumption have declined significantly by 3.4%, respectively 6.2%. It is likely that the mild weather in 2008 (com- pared to 2006) and, in particular, the sharp rise in fuel prices are the underlying causes of this decline. According to the Federal Sta- tistical Office the consumer price for natural gas rose about 14.4%
between 2006 and 2008, the consumer price for fuel oil rose about 30%. The decrease in demand for fuel oil and natural gas was partly compensated by a higher consumption of firewood, wood chips, briquettes, and pellets. Between 2006 and 2008 the con- sumption of wood increased by remarkable 21%.
Results for electricity generation by photovoltaic are not listed in table 1, since private households generally feed the gen- erated electricity into the public grid. Hence, electricity generated by photovoltaic is not part of the residential energy consumption.
However, the solar electricity generation in private households amounts to 1.3 Terawatt-Hours (TWh) in 2006, about 2.2 TWh in 2007, and rises to 2.9 TWh in 2008. Against this backdrop, be- tween 60% to 70% of all supplied solar electricity was generated from private households (BDEW 2007, 2008, 2009).
Usage of Renewable Energies
An extensive computer-assisted telephone survey with respect to the market penetration of renewables in households was con- ducted in fall 2006. In total more than 80,000 households were interviewed whether they use a heat pump, solar heating, wood pellets or a photovoltaic device. Based on these results for 2006, the market penetration of renewables in 2007 and 2008 is updated by the developments in the sample of the 6 700 participating households of the forsa.omninet-panel. For instance, if the number of solar heating systems rose by 2% between 2006 and 2007 in the forsa.omninet-panel, the telephone survey results were up- dated in a similar manner.
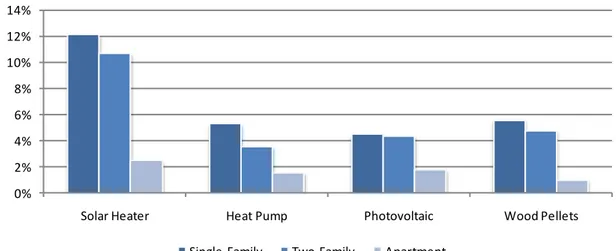
To our results, about 12% of all single-family homes and 11% of all two-family homes are equipped with solar heating (fig- ure 2). Heat pumps and wood pellets are used in less than 6% of all single- and two-family homes. Basically no difference between single- and two-family homes exist for the usage of photovoltaic:
about 4.5% of these houses are equipped with a respective facility.
Renewables are generally much less present in apartment houses since the building owner typically does not benefit from the in- stalled systems.
Figure 2: Usage of renewables in households 2008
Decomposition of Electricity Consumption: the Energy Diary
Electricity is probably the most versatile fuel in the residential sec- tor. Electricity can be used for various purposes, for instance light- ing, cooking, hot water preparation the usage of electric ap- pliances. Typically, only the total electricity consumption of a household is known, if at all. In order to differentiate electricity consumption into single usage purposes, an additional survey
“Energy Diary” was designed. Information about the equipment and usage of electric appliances for a sample of almost 900 house- holds was collected. The “Energy Diary” will be conducted on a regular basis, about every three months, with the same set of households. By this means, the gathered information will provide reliable insights into the electricity consumption behavior of the residential sector. Actually, the “Energy Diary” has been conducted just once, while a second wave is scheduled for the end of Novem- ber 2010.
0%
2%
4%
6%
8%
10%
12%
14%
Solar Heater Heat Pump Photovoltaic Wood Pellets
Single-Family Two-Family Apartment
References
BDEW (2009), EEG-Jahresabrechung 2008, Stand: 27.07.2009, http://www.bdew.de/bdew.nsf/id/DE_EEG-Jahresabrechnungen BDEW (2008), EEG-Jahresabrechung 2007, Stand: 26.09.2008,
http://www.bdew.de/bdew.nsf/id/DE_EEG-Jahresabrechnungen BDEW (2007), EEG-Jahresabrechung 2006, Stand: 21.09.2007,
http://www.bdew.de/bdew.nsf/id/DE_EEG-Jahresabrechnungen