• Keine Ergebnisse gefunden

Thomas Kuster 26. Februar 2007

N/A
N/A
Protected

Academic year: 2021

Aktie "Thomas Kuster 26. Februar 2007"

Copied!
7
0
0

Wird geladen.... (Jetzt Volltext ansehen)

Volltext

(1)

Thomas Kuster 26. Februar 2007

1

1.1

Schwere Isotope sind bei Molek¨ ulen mit starren Bindungen angereichert. Je k¨ urzer die Bindungen desto steiffer die Bindung. Die Bindungen in Bors¨ aure sind k¨ urzer als die in Borat und somit auch starrer. 11 B welches schwerer ist als 10 B ist daher in Bors¨ aure angereichert.

1.2

Auf Grund der Aufgabe muss folgendes gelten:

∆B(OH) 3 · 0.82 + ∆B(OH) 4 · 0.18 = ∆B Sample (1) (2) Definitionen der δ-Werte ergibt:

∆B Sample

R − 1

· 1000 = δB Sample (3)

∆B(OH) 3

R − 1

· 1000 = δB(OH) 3 (4)

R ·

δB(OH) 3 1000 + 1

= ∆B(OH) 3 (5)

R · δB(OH) 4 1000 + 1

!

= ∆B(OH) 5 (6)

Einsetzen der Gleichungen (5) und (6) in (1) und diese dann in (3) ergibt:

R δB(OH)

3

1000 + 1

0.82 + R δB(OH)

4

1000 + 1 0.18

R − 1

 1000 = δB S. (7) δB(OH) 3

1000 0.82 + δB(OH) 4

1000 0.18 + 1 − 1

!

1000 = δB S. (8) δB(OH) 3 · 0.82 + δB(OH) 4 · 0.18 = δB S. (9)

1

(2)

UWIS, Advanced Geochemistry, Homework 3 2 Aus der Gleichung (9) folgt Gleichung (10):

α − 1 = 1.02 − 1 = 20 ‡ = δ 11 B(OH) 3 − δ 11 B(OH) 4 (10) δ 11 B Sample = 39.6 ‡ = δ 11 B(OH) 3 · 0.82 + δ 11 B(OH) 4 · 0.18(11)

δ 11 B(OH) 3 = δ 11 B Sample − δ 11 B(OH) 4 · 0.18

0.82 (12)

Aus Gleichung (10) und (12) folgt:

20‡ = δ 11 B Sample − δ 11 B(OH) 4 · 0.18

0.82 − δ 11 B(OH) 4 (13)

0.82 · 20‡ = δ 11 B Sample − δ 11 B(OH) 4 · 0.18 − δ 11 B(OH) 4 · 0.82(14)

0.82 · 20 ‡ = δ 11 B Sample − δ 11 B(OH) 4 (15)

δ 11 B(OH) 4 = δ 11 B Sample − 0.82 · 20 ‡ (16)

= 39.6 ‡ − 0.82 · 20 ‡ (17)

= 23.2 ‡ Borat (18)

Gleichung (12) verwenden bzw.

” vertauschen“ der Variablen f¨ uhrt zu:

δ 11 B(OH) 3 = δ 11 B Sample + 0.18 · 20 ‡ (19)

= 39.6 ‡ + 0.18 · 20 ‡ (20)

= 43.2 ‡ Bor S¨ aure (21)

2

Je h¨ oher der pH desto gr¨ osser die Borat (B(OH) 4 ) Konzentration. 11 B hat eine Pr¨ aferenz f¨ ur Bors¨ aure (B(OH) 3 ). Die isotopisch schwereren Borat Mo- lek¨ ule dissozieren bevorzugt zu Bors¨ aure. Liegen auf Grund eines hohen pH-Wert nur wenige Bors¨ auremolek¨ ule vor, ist in diesen der Anteil der 11 B Atome gr¨ osser (δ 11 B ist h¨ oher).

In die Karbonate wird nur Borat eingebaut. Der δ 11 B entspricht daher dem

pH. Um den pH zu bestimmen, kann in der Abbildung 1 unten, der δ 11 B

Wert mit der Kurve von Borat (B(OH) 4 ) geschnitten werden.

(3)

3

δ 11 B Sample = δ 11 B(OH) 3 · 0.82 + δ 11 B(OH) 4 · 0.18 (22) δ 11 B(OH) 3 = δ 11 B Sample − δ 11 B(OH) 4 · 0.18

0.82 (23)

δ 11 B Temperatur = δ 11 B(OH) 3 − δ 11 B(OH) 4 (24)

(23) = δ 11 B Sample − δ 11 B(OH) 4 · 0.18

0.82 − δ 11 B(OH) 4 (25)

= δ 11 B Sample − δ 11 B(OH) 4

0.82 (26)

=

39.6 ‡ −

( 21.5 ‡ 26.0 ‡

0.82 (27)

=

( 22.07 ‡

16.58 ‡ (28)

Nein, da bei 22.07 ‡ die Temperatur des Ozean unter 0 ° C w¨ are und bei 16.58 ‡ weit ¨ uber 60 ° C.

4

Die Werte wurden in Tabelle 1 berechnet. Der Eintrag von Bor ist geringer als die Senken von Bor. Im Gegensatz dazu findet jedoch eine Anreicherung von 11 Bor statt (Fluss ·δ 11 B ist positiv). Dies f¨ uhrt zu einer Verarmung von Bor bei gleichzeitiger Erh¨ ohung von δ 11 B. Der Ozean befindet sich im Bezug auf Borisotope nicht im Gleichgewicht.

5

Wie in Aufgabe 4 gezeigt wurde h¨ angt der δ 11 B-Wert von den Quellen und Senken von Bor und deren δ 11 B-Werte ab. Vermehrte Verwitterung f¨ uhrt z. B. zu einer Zunahme der δ 11 B-Werte. Eine Zunahme der Verwitterung kann z. B. durch die Neubildung von Gebirgen verursacht werden.

Das Minimum der Kurve in Abbildung 1 und 2 liegt vor 65 Millionen Jahren.

Dies entspricht dem Beginn der Entstehung des Himalaya. Nach Tabelle 1

muss dies auch zu einer Zunahme des δ 11 B-Wert f¨ uhren (mehr Verwitterung)

(4)

UWIS, Advanced Geochemistry, Homework 3 4

T ab e lle 1: Senk en un d Qu e ll e n v on Bor un d deren δ 11 B- W e rte Bor Flu ss [10 10 g a − 1 ] δ 11 [ ‡ ] F luss · δ 11 [10 7 g a − 1 ] Senk en F ehler ± 1

¨ And

e run g d e r oze an isc hen Kr uste -27 4 -108 Absorb tion v on S e d ime n ten -13 15 -195 Mi tf ¨allu ng in Kar b on ate -6 20 -120 T otal S e n k e n -46 -423 Qu e ll e n F ehler ± 1 Ei n tr ¨age d ruc h Fl ¨usse (V erwitteru ng) 38 10 380 Hyd roth e rmale Ak tivit ¨at 4 6.5 26 Flu ss v on angereic h e rt e Pr is men(?) 2 25 50 T otal Qu e lle n 44 456 T otal -2 33

(5)

UWIS, Advanced Geochemistry, Homework 3 5

for each depth interval and resulting in the relative lack of constraints on the past pH profiles. Error calculations easily show that a d 11 B sw value of 36 x 42 Myr ago cannot be ruled out. These differ- ences have important consequences, especially for reconstructing seawater paleo-pH values.

4.5. Sensitivity of the model to boron fluxes

In our model, the quantification of errors is diffi- cult to achieve. However, the model presented here can bring clarifications on the parameters controlling the oceanic boron budget and the assessment of the uncertainties importance of each flux can be attemp- ted. In this purpose, we have carried out sensitivity tests to the processes affecting boron in the oceans by alternatively superimposing sinusoidal variations on the natural variations. The magnitude and the period of the sinusoid are fixed at 20% of the associated flux and at 20 Myr (close to the marine residence time of boron), respectively. Shorter periods do not impact significantly the d 11 B sw values and longer periods lead to smoothed variations. Results are presented in Fig.

6. It is shown that, at the first order, the marine boron evolution is fixed by the boron uptake during low temperature alteration of the oceanic crust and by the boron continental discharge. The two associated noised curves for marine boron isotopes (Fig. 6b and f) follow the variations imposed by the sinusoid with a delay due to the residence time of boron in the oceans. The magnitude of the delay is about 5 Myr and depends on the characteristic time of the associ- ated flux and therefore leads to a different phase displacement in the two curves. The boron uptakes by adsorption on clastic sediments and coprecitation in carbonates play a secondary role. The hydrothermal vents as well as the input by fluid expulsion from accretionary prisms do not impact the boron oceanic budget.

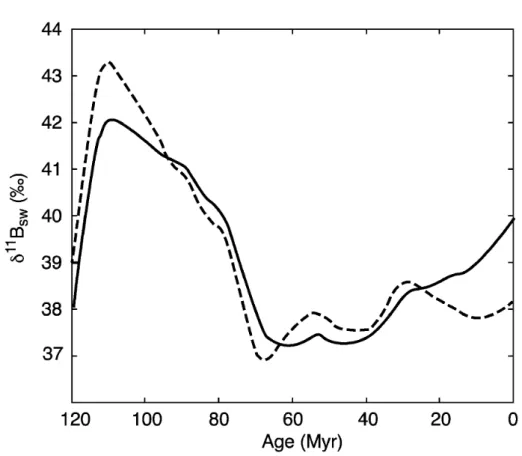
To test the validity of the observation that the boron oceanic budget is mainly controlled by the riverine discharge and by the uptake during low temperature weathering of the oceanic crust, we have attempted to model the boron secular evolution in the oceans only driven by these two fluxes. By compar- ison to the previous curve (Fig. 4a), and at the exception of the last 20 Myr, very few differences are observed (see Fig. 7). This comparison confirms

the first role played by the riverine discharge and the oceanic crust alteration in the boron oceanic budget but points out the relative importance taken by the recent increase of the continental sedimentary supply.

Over the past 20 Myr, the relative enhancement of the role played by the boron uptake during adsorption on sediments is due to the simultaneous relative con- stancy of the major fluxes over this period. This means that only the continental erosion, both the river dissolved load (for the B input) and the river sus- pended load (for the B output), is driving the increase of the d 11 B sw since 20 Myr. From this observation, seawater d 11 B appears to be a tracer for the physical erosion of the continents. If we assume that the secular variation of marine boron isotopes is well known over this period, then advances in the under- standing of continental erosion processes and of their evolution through the last 20 Myr could be achieved.

Study of marine boron isotopes could thus permit to focus on the impact of the Himalayan erosion to the oceans.

As pointed out earlier, the boron continental dis- charge plays a prevalent role in the boron oceanic budget and the evaluation of the impact of its possible secular variations has to be attempted. Unfortunately, no record or model for the variations through time of

Fig. 7. Comparison of models for boron secular evolution in the oceans. The solid line represents the reference curve with the scenario of constant riverine flux. Dashed line represents the boron isotopes evolution when the boron oceanic cycle is only driven by boron continental discharge and boron uptake during low temper- ature alteration of the oceanic crust.

Abbildung 1: Lemarchand u. a. (2002, Seite 134)

(6)

UWIS, Advanced Geochemistry, Homework 3 6

are provided by Spivack et al. (1993) from the ODP hole 803D and by Pearson and Palmer (2000) from the ODP holes 871A, 872C and 865C. Apart from the important difference between the modern d 11 B carb values measured in these two studies (16.2 x after Spivack et al., 1993, and 24.9 x after Palmer et al., 1998), the magnitude of the d 11 B carb decrease through time is also different (down to 10.5 x after Spivack et al.,1993, 21 Myr ago when Palmer et al., 1998, measured values similar to present day). As men- tioned by Spivack et al. (1993), although a number of precautions have been taken, there are possibilities that analyzed samples result from a mixing between primary seawater-precipitated carbonate and a secon- dary diagenetic component. If this is not the case, based on the estimation of a d 11 B sw constant through time derived from the poor fluids analysis, a seawater pH value of 7.4 F 0.2 is calculated 21 Myr ago.

Pearson and Palmer (2000) measured boron isotopic compositions in handpicked species of planktonic foraminifera for a period covering the past 60 Myr.

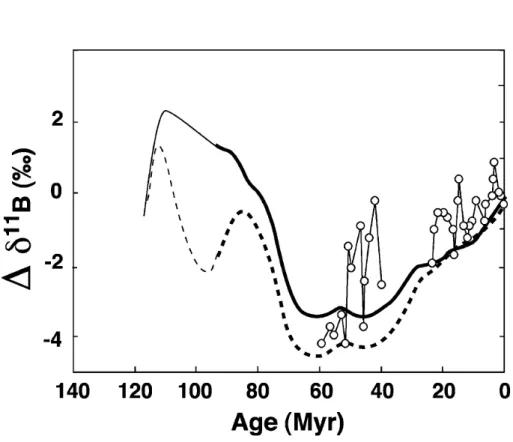
Based on the d 11 B sw reconstruction from pH – depth profile mentioned above, seawater pH values have remained roughly constant over the past 25 Myr and significantly lower (down to 7.42), 60 Myr ago. We use the relative variations of the measured d 11 B carb values over the past 60 Myr to compare with that of the model presented here for seawater. As shown in Fig. 9, a remarkable consistency is observed. If the d 11 B carb variations through time actually follow that of seawater d 11 B, it suggests that the variations of the seawater pH values may not have been important over the past 60 Myr. Nevertheless, such a constancy on geological time scale does not preclude rapid changes of the marine acidity – alkalinity balance over glacial – interglacial periods. The rapid fluctuations shown by carbonate analysis cannot be explained by marine boron changes on the basis of its long residence time in seawater. The erratic fluctuations shown by d 11 B carb could be induced by analytical uncertainties or by variable vital fractionations amongst the different foraminifera species. If not, explanations have to be found in rapid changes of the marine physical and/or chemical parameters that control the boron isotopes incorporation in biogenic carbonates and that may show such rapid fluctuations. Candidates may be pH changes (through changes of the global acidity or through changes of the local biological production) or

important fluctuations of the sea-surface temperature (through its influence on the isotopic fractionation factor) even if explanations for the sudden appearance of such erratic fluctuations for ancient ages are not clear.

From our model for the evolution of marine boron isotopes, we present, in Fig. 10, the expected fluctua- tions of the d 11 B of biogenic carbonates in the cases of constant seawater pH, gradual increase of the seawater pH from 7.4 to 8.2 and gradual decrease of the seawater pH from 8.7 to 8.2 over the past 60 Myr.

The calculation of the isotopic composition of B incorporated in carbonate is very sensitive to changes of seawater pH, so that seawater pH values higher than 8.5 are difficult to explain with boron data in carbonates. Similarly, seawater pH values lower than 7.8, corresponding to a shift of the calculated d 11 B carb of about 3 x , appear to be not explainable with our model.

The pH of seawater is believed to be linked to the atmospheric carbon dioxide concentration through the dissolved carbonate content so that reconstructed marine pH values are sometimes used for assessing correspondent levels of atmospheric pCO 2 (Sanyal et al., 1995; Pearson and Palmer, 1999; Pearson and Palmer, 2000). The direct link between seawater pH and atmospheric pCO 2 implies that higher pCO 2

Fig. 9. Comparison between the model presented in this study and data of boron isotopes in carbonates. Data are presented as deviation from the present value. Scenario of constant riverine flux (solid line); scenario of riverine flux following runoff changes (dashed line). Boron isotopes in handpicked foraminifera, plotted circles (Pearson and Palmer, 2000).

D. Lemarchand et al. / Chemical Geology 190 (2002) 123–140 136

Abbildung 2: Lemarchand u. a. (2002, Seite 136)

(7)

Literatur

[Lemarchand u. a. 2002] Lemarchand , D. ; Gaillardet , J. ; Lewin , E. ; Allegre , C. J.: Boron isotope systematics in large rivers: implications for the marine boron budget and paleo-pH reconstruction over the Cenozoic.

In: Journal of the Atmospheric Sciences 190 (2002), Oktober, Nr. 1,

S. 123–140

Abbildung

Fig. 7. Comparison of models for boron secular evolution in the oceans. The solid line represents the reference curve with the scenario of constant riverine flux
Fig. 9. Comparison between the model presented in this study and data of boron isotopes in carbonates

Referenzen

ÄHNLICHE DOKUMENTE

The average δ 13 C anomaly between the LIG and Holocene periods for cores deeper than 2500 m is consistent across the different regions despite their geographic separation, sug-

Este sistema representa una gran oportunidad para mejorar la transparencia de la Cuenta Pública, para evaluar la asignación de recursos por parte de los congresistas y el desempeño

The state established for the tax liabilities represented by duties, taxes, rates and other state back finances including matching increase in tax and penalties for overdue

As part of the meridional overturning circulation which connects all ocean basins and influences global climate, northward flowing Atlantic Water is the major means of heat and

This article contains a comparison between EU budget and Iraq in order to overcome the economic imbalances in general and the budget deficit in particular, and show the role

The Arctic Ocean is tightly connected to the global ocean system via water mass exchanges with the Pacific and Atlantic Oceans through several main oceanic gateways: Bering

Meridional transports of mass, heat, nutrients, and carbon across coast-to-coast WOCE and pre-WOCE sections between 11 8 S and 45 8 S in the South Atlantic are calculated using

Study of chemical composition of aerosols (both individual particles and total samples), determination of source regions using the tracer ratios; estimation of the