Integrable e-lements for Statistics Education ∗
Wolfgang H¨ ardle, Sigbert Klinke and Uwe Ziegenhagen Humboldt-Universit¨ at zu Berlin
Center for Applied Statistics and Economics
Abstract
Without doubt modern education in statistics must involve practical, computer-based data analysis but the question arises whether and how computational elements should be integrated into the canon of methodological education. Should the student see and study high-level programming code right at the beginning of his or her studies? Which technology can be presented during class and which computational elements can re-occur (at increasing level of complexity) during the different courses?
In this paper we address these questions and discuss wheree-techniques have their limits in statistics education.
Keywords electronic books, hypertext, e-supported teaching, statistical software
JEL codes I21, C19,
∗This research was supported by the Deutsche Forschungsgemeinschaft through the SFB 649 ”Economic Risk”.
1 Introduction
Since the entering of modern computing equipment into schools and universities there have been increased efforts to use computers not only for research and numerical computations but also for the education of students. While traditional textbooks on statistics are usually restricted to small examples, computers offer great opportunities to enrich the teaching of statistics by the means of explaining animations or on-the-fly computations of large real-world datasets.
But each new technology does not only hold opportunities and advantages there may also be hazards or risks. And a sentence stated by John Tukey in 1965 should be taken into consideration: ”Each new generation of computers offers us new possiblities, at a time when we are far from using most of the possibilities offered by those already obsolete.”
We will outline our thoughts about the integration of electronic and computational elements into statistics along the courses tought at the School for Business and Economics of Humboldt-Universit¨at zu Berlin.
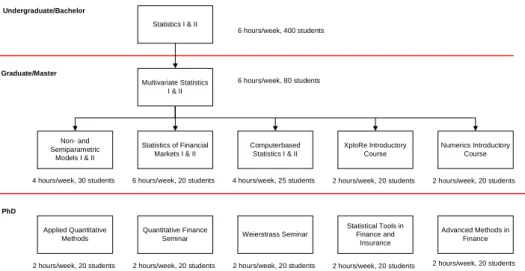
Students following different course programs are taught at the Institute for Statistics and Econometrics at Humboldt-Universit¨at zu Berlin, German Business Administration and Economics students as well as students from international bachelor or master classes or the math department.
After finishing the bachelor level, where statistics is taught in a two-term lecture three hours a week, the students who choose statistics as one main subject are required to take a course on multivariate data analysis, that enables them to understand the basics of probability theory and to analyze high-dimensional data by the means of cluster-, principal component- and factor analysis.
On the basis of this lecture the student has further options: While Non- and Semipara- metric Modelling focuses on nonparametric density estimation and regression the student learns in the computational statistics courses the applied data analysis with SPSS and real world data. Supplementary to theComputerbased Statistics courses are the XploRe Introductory Course and the Numerics Introductory Course focussing on the practical work with XploRe respectively the numerical details of selected algorithms.
Statistics of financial markets is the third specialisation taught at Humboldt-Universit¨at, covered are theoretical and practical aspects of option pricing, risk-management and time series modelling.
Statistics I & II
Multivariate Statistics I & II
Statistics of Financial Markets I & II Non- and
Semiparametric Models I & II
Computerbased Statistics I & II
Applied Quantitative Methods
Quantitative Finance Seminar
6 hours/week, 400 students
6 hours/week, 80 students
Weierstrass Seminar 4 hours/week, 30 students 6 hours/week, 20 students 4 hours/week, 25 students
2 hours/week, 20 students 2 hours/week, 20 students 2 hours/week, 20 students Undergraduate/Bachelor
Graduate/Master
PhD
XploRe Introductory Course
Statistical Tools in Finance and
Insurance
2 hours/week, 20 students
Advanced Methods in Finance
2 hours/week, 20 students Numerics Introductory
Course
2 hours/week, 20 students 2 hours/week, 20 students
Figure 1: Typical one year cycle of statistics courses in Berlin
At the master level there are currently five courses also aimed at PhD students: InApplied Quantitative Methods and theWeierstrass Seminar recent developments of mathematical statistics and data analysis are discussed,Advanced Methods in Finance, theQuantitative Finance Seminar andStatistical Tools in Finance and Insurance deal with the field of
financial mathematics.
2 Traditional and Modern Teaching Material
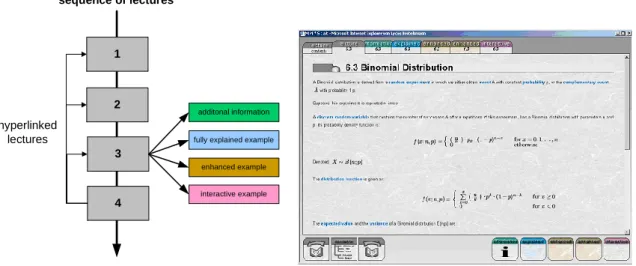
The main components of MM*Stat (M¨uller, M., R¨onz, B., Ziegenhagen, U., 2000), that was developed to support the undergraduate teaching of statistics, are lecture units, additional information and (non)interactive examples, presented in a style similar to fil- ing cards. This structure, calledMD*Booklet, has also been used forNumerical Methods in Statistics andFinance Introductory Course (http://www.quantlet.com/mdstat/products.html).
The lecture units contain common and well-known topics as basic concepts of statistics, basics of probability calculus and sampling theory.
Each ”lecture” filing card provides the basic concepts of the methods considered together with definitions, important formulas and graphics. ”Fully explained”, ”Enhanced” and
”Interactive” examples show how these formulas can be applied. The first explain standard classbook examples in detail while the latter discuss important aspects of more advanced examples. The interactive examples are one of the main features of MM*Stat.
By using a combination of embedded Java-based XploRe Quantlet Client (Borak, S.,
1
4 3
2 additonal information
fully explained example
enhanced example
interactive example
sequence of lectures
hyperlinked lectures
Figure 2: MM*Stat: Layer Architecture and Screenshot
H¨ardle, W., Lehmann, H., 2005) and a remote or locally installedXploRe Quantlet Server the student can compute distribution functions, histograms and test results. Compared with classical textbooks where effects of parameter changes can only be presented as sequence of graphics or tables, the user can experience the results of different settings in realtime.
The repetition of concepts and methods introduced earlier has been implemented in two different ways: To see or recall the definition of a used term, a glossary has been written and important words within the different lectures inside MM*Stat are linked to this glossary. Furthermore the student can complete multiple choice questions by selecting radio buttons, the results are given instantly.
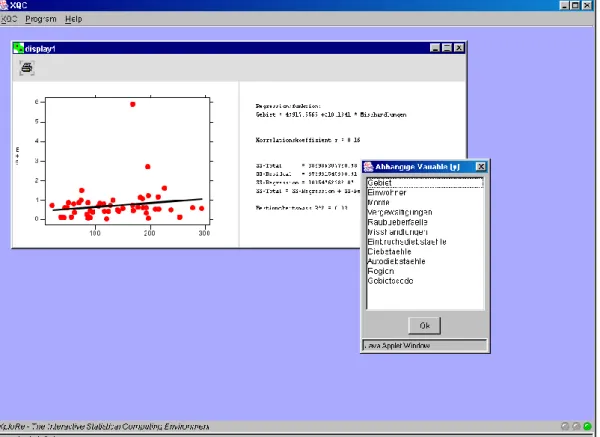
Figure 3: Example for linear regression in MM*Stat
The target group of MM*Stat, the undergraduate students, have different levels of literacy concerning computers, while some are firm in common office software tools others have little experience. So it was decided to hide the source code of the interactive examples from the user, to lower the inhibition threshold of using the software. Figure 3 shows a typical example for linear regression, which allows the user to choose the dependent and independent variable and returns the regression plot and the parameters of the model.
The combination of XploRe Quantlet Server and Client has not only been used in MM*Stat, furthermore it is used in the DoSS@d system (Mori, Y., Yamamoto, Y. and Yadohisa, H., 2003) and the books published by the members of the authors’ institute (http://www.xplore-stat.de/ebooks/ebooks.html) also use this framework, although in a different way.
As mentioned the source code for the interactive examples was hidden from the user in MM*Stat, from the target group of the advanced books, graduate and PhD students on the one, researchers and professional on the other hand, we assume a certain level of computational literacy. In each book respectively the corresponding slides selected pages contain links to HTML-pages that contain the source code of the example as well as links to two different implementations of this example.
These two implementations differ in that sense that the ’edit’ page calls the XploRe Quantlet Client in editor mode, which means that the user can manipulate the source
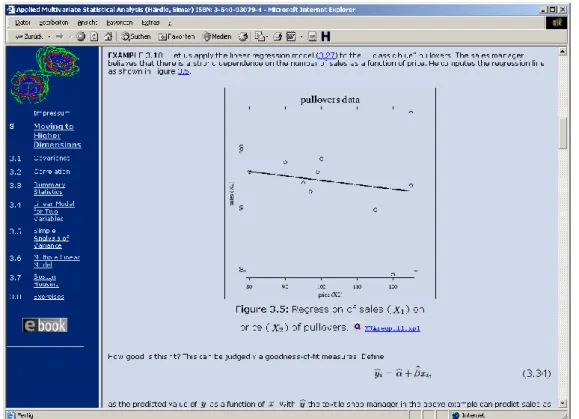
Figure 4: Applied Multivariate Statistics: HTML page with link to an example
code of the example. From MM*Stat they vary from the textual component. While at undergraduate level regression is taught using a notation with sums, the more abstract matrix-based approach is used for graduate students.
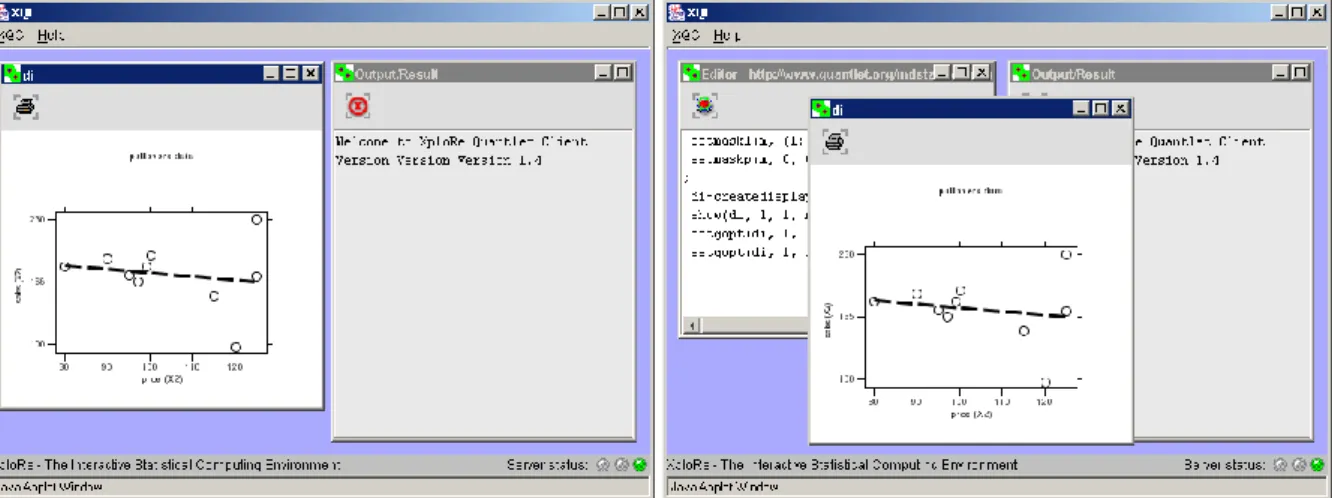
Figure 5 depicts two screenshort from the book Applied Multivariate Analysis by W.
H¨ardle and L. Simar, on the left hand side the ’run’ version of the quantlet, on the right the editable ’edit’ version.
3 XploRe, Xplore Quantlet Server and Yxilon
Besides SPSS which is used for the computational statistics courses the software package XploRe is used for educating students at Humboldt-Universit¨at. Developed in coop- eration with MD*Tech (http://www.mdtech.de), XploRe is a full-featured statistical programming language. Using a matrix-oriented approach in combination with a C-style syntax a great variety of diverse statistical problems can be handled conveniently.
Figure 5: Applied Multivariate Statistics: execute and edit versions of an example
The implementation of XploRe incorporates ideas from the requirements of statistical software mentioned by Chambers and Lang (1999): usage from multiple front-ends, extensibility on language and native core level, interactive graphics and the inclusion of existing code (C, Fortran).
With Yxilon (Guril, Y., Klinke, S., Ziegenhagen, U., 2005) MD*Tech and Humboldt- Universit¨at zu Berlin agreed on a new research project with the aim to supply a freely available statistical environment and to allow the implementation of recent developments in software technology while remaining fully compatible with XploRe.
The most dramatic change compared with XploRe or other packages as R or Jasp (Fujiwara, T., Ikunori K. et al. 2000) is the way the code is executed: Besides the interpretation by a so called runtime environment the idea is to compile directly to C++
and Java. Further changes are:
• published under Free-BSD license
• fully independent from machine architecture by using platform-independent proto- cols and software frameworks
• improved modularity to allow convenient exchange of single components
• integration of dynamic data sources as databases and webservices
• increased computing performance simplifying the language definitions
• improved integration into standard office and business software
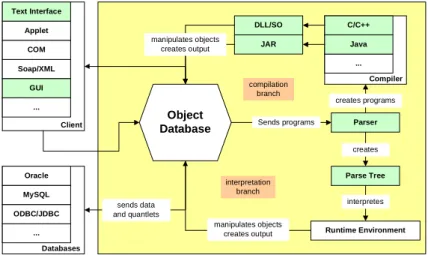
The software architecture of Yxilon is shown in Figure 9. Via a graphical or non-graphical user interface the user accesses the system. All objects and information are held in the object database, that communicates with the other parts as the parser or runtime
Moving to Higher Dimensions 3 - 49
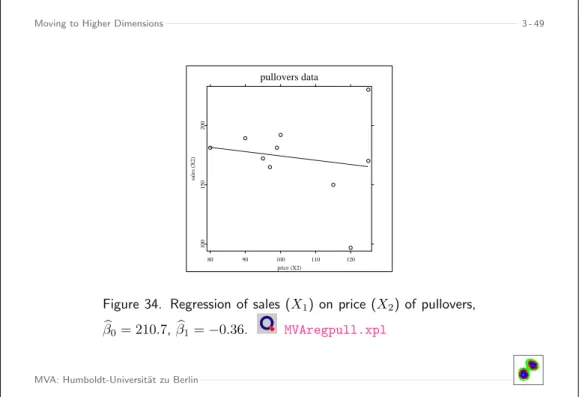
pullovers data
80 90 100 110 120
price (X2)
100150200
sales (X2)
Figure 34. Regression of sales (X1) on price (X2) of pullovers, βb0= 210.7,βb1=−0.36. MVAregpull.xpl
MVA: Humboldt-Universit¨at zu Berlin
Figure 6: Applied Multivariate Statistics: slide with link to an example
environment. The parser takes the sourcecode provided by the user and converts them to either Java/C++ code or a binary format directly readable by the runtime engine. The advantage of source conversion is that the high-level, interpreted XploRe code, which is slower than binary code, can be compiled by the Java or C++ compiler to fast running machine code. Especially for computing-intensive applications as bootstrapping and simulation we expect significant improvements concerning execution time.
Figure 7: Applied Multivariate Statistics: homepage of the linked example
Object
Database Parser
C/C++
...
Java
Compiler
Parse Tree
Runtime Environment JAR
DLL/SO
Oracle
...
ODBC/JDBC MySQL
Databases Text Interface
GUI Soap/XML
COM Applet
Client ...
Sends programs
sends data and quantlets
interpretes creates creates programs
manipulates objects creates output
interpretation branch
compilation branch manipulates objects
creates output
Figure 8: Architecture of the Yxilon Framework (green components in development)
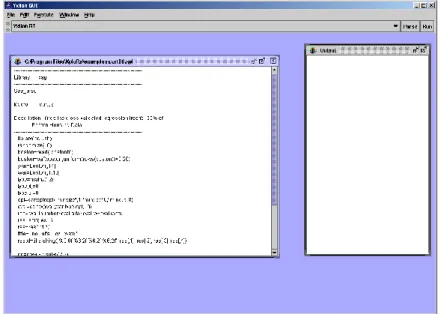
Figure 9: Screenshot of the Yxilon graphical user interface
4 Limits of e-lements in statistics education
Electronic and computational elements in education can be limited from a variety of different reasons as the technical implementation or the educational approach.
MM*Stat relies on a complex framework of HTML, Cascading Style Sheets, Java and JavaScript. While HTML and Java were already well-established standards, JavaScript and Cascading Style Sheets were implemented in different ways for each browser, so extensive work for each major webbrowser had to be invested.
From the educational point of view each use of electronic media should be questioned carefully. An analysis by Brandes, U. (2004) showed no significant improvements in the results of those students who used MM*Stat in comparison to those who used classical textbooks. The educational limits also lie in the way the information is presented. The classical way of using a textbook or blackboards also offers the opportunity to include on-the-fly notes from either the teacher or the student. Electronic teaching solutions either do not offer this capability at all or require significant technical ressources.
References
Borak, S., H¨ardle, W., Lehmann, H. (2005), Working with the XQC, IN: Statistical Tools for Finance and Insurance, editors: Cizek, P., H¨ardle, W., Weron, R., Springer Verlag
Brandes, U. (2004). Statistische Bewertung und Analyse der Klausurergebnisse Statistik
(Statistical analysis of exam results in statistics undergraduate courses), diploma thesis, Humboldt-Universit¨at zu Berlin
Chambers, J. and Lang, D. T. (1999). Omegahat – A Component-based Statistical Computing Environment, Proceedings of the 52nd Session of the ISI, Helsinki, Finland.
Fujiwara, T., Ikunori K., Nakano, J., Yoshikazu, Y. (2000). A Statistical Package Based on Pnuts, In: COMPSTAT. Proceedings in Computational Statistics, Physica Verlag
Guril, Y., Klinke, S., Ziegenhagen, U. (2005). Yxilon – a Modular Open-Source Statis- tical Programming Language, In: Proceedings of the 55th Session of the International Statistical Institute (ISI), Sydney, Australia
Mori, Y., Yamamoto, Y. and Yadohisa, H. (2003). Data-oriented Learning System of Statistics based on Analysis Scenario/Story (DoLStat). Bulletin of the International Statistical Institute (ISI).
M¨uller, M., R¨onz, B., Ziegenhagen, U.(2000). The Multimedia Project MM*Stat for Teaching Statistics, In: COMPSTAT. Proceedings in Computational Statistics, Physica Verlag