Rammcloo and Beunis: Evaluation of immunoglobulin assays on the ACA III 577 J. Clin. Chem. Clin. Biochem.
Vol. 21, 1983, pp. 577-582
An Evaluation of Immunoglobulin Assays on the ACA III
By T. Rammeloo and M. H. Beunis
Department of Clinical Chemistry, Stichting Samenwerking Delftse Ziekenhuizen, Delft, The Netherlands (Receivcd November 11, 1982/March 3, 1983)
Summary: We evaluated an immunoturbidimetric Du Pont ACA method for the determination of IgG, IgA and IgM in serurn. Between-day reproducibilities of the ACA assays were comparable to those of a radial immunodiffusion, a Hyland nephelometric and a turbidimetric assay on Centrifichem 400. Correlations be- tween results obtained by these methods were acceptable, but the results differed quantitatively. After simu- lated recalibration based on results of control sera or patient samples, the results for IgA and IgM became more interchangeable. IgM concentrations below 0.25 g/l, which^are important for the assessment of intra- uterine infections, could not be quantified with the ACA. Moderate levels of haemoglobin, bilirubin or lipids do not interfere with the ACA assays. The evaluated assays are fast and easy to use.
Prüfung von Immunoglobulin-Bestimmungen mit dem ACA III
Zusammenfassung: Eine immunturbidimetrische Methode für die Bestimmung von IgG, IgA und IgM im Serum mit dem DuPont ACA wurde geprüft.
Die Reproduzierbarkeit der Bestimmungen mit dem ACA von Tag zu Tag war vergleichbar mit der für die radiale Immundiffusion,'Nephelometrie (Hyland) und Turbidimetrie (Centrifichem 400). Die Korrelation der mit diesen Methoden erhaltenen Ergebnisse war annehmbar, die Ergebnisse unterschieden sich jedoch quantitativ. Nach simulierter Rekalibrierung anhand der Werte von Kontrollseren oder Patientenproben wurde für die Ergebnisse von IgA- und IgM-Bestimmungen eine bessere Übereinstimmung erzielt. IgM-Kon- zentrationen unter 0,25 g/l, wichtig für die Feststellung intrauteriner Infektionen, konnten mit dem ACA nicht bestimmt werden. Hämoglobin, Bilirubin oder Lipide stören — soweit untersucht — die Bestimmungen mit dem ACA nicht. Die geprüften Methoden sind schnell und einfach im Gebrauch.
Introduction
Several techniques such äs radial immunodiffusion turbidimetry (l, 2) and nephelometry (3, 4) can be used for the assessment of immunoglobulin concen- trations.
Radial immunodiffusion requires an incubation time of at least two days. Most nephelometric immunoas- says and turbidimetric immunoassays are rather ex- pensive, because a Standard curve is needed with each run.
Recently, Du Pont introdticed an ACA^assay for the assessment of immunoglobulins in serum. ACA-as- says, like most nephelometric and turbidimetric as-
says, are based on the reactions of antigens with spe- cific antibodies in a polyethylene glycol 6000 solu- tion. The light-scattering of the immunecomplexes is measured turbidimetrically äs the difference in ab- sorbance at 340 and 540 nm. In contrast to the methods mentioned above, the ACA-assay is advan- tageous in obtaining the result from a single sample within a few minutes. We therefore evaluated the ACA-assay and compared its reproducibility and ac- curacy with those of commonly used assays. Special attention was given to the determination of low IgA and IgM concentrations, because the diagnosis of se- lective IgA deficiency or a previous intra-uterine in- fection by newborns requires low detcction limits of
578 Rnmmcloo and Beunis: Evaluation of immunoglobulin assays on thc ACA III IgA and IgM. Furthermorc, we tcstcd haemoglobin,
bilirubin and lipids for possible interference in the ACA-assays.
We expected that different immunoglobulin concen- trations vvould be given by the four assays (5, 6, 7). It would be desirable, however, to obtain directly com- parable results when shifting from any bf the routine methods to the ACA method. We therefore simulat- ed a recalibration of the ACA, based on values from control sera and from patient samples.
Materials and Methods Methods
The ACA assays were performed on an ACA III Instrument (E. I.
Du Pont de Nemours & Co., Inc., Wilmington, U.S.A.).
Radial immunodiffusion (RIO) was performed with Partigen plates and Standards from Behringwerke (Marburg, F.R.G.) ac- cording to the supplief s instructions.
The nephelometric immunoassay (ΝΙΑ) was performed on a Hy- land PDQ nephelometer, automated with the disc 120 (Hyland Division, Travenol Laboratories, Costa Mesa, U.S.A.) accofding to the instructions of the manufacturer. Hyland reference serum A (lot no OA 03A001) was used s a Standard serum.
The turbidimetric immunoassay (TIA) was performed on a Cen- trifichem 400, s described by Boigne et al. (2) with some modifi- cations. We used antisera and buffered polyethylene glycol solu- tion from Orion (Orion Diagnostika, Helsinki, Finland). The Standard serum used was the same s that applied in the nephelo- metric assay.
P a t i e n t samples
Sera from patients were collected over a period of 4 months and immediately frozen at -70 °C.
For the comparative study, haemolytic, icteric and lipaemic sera were excluded.
For interference studies, five specimens with varying degree of haemolysis were prepared from clotted blood samples. The high- est haemoglobin level was 1.5 mmol/1. Five icteric serum samples with increasing bilirubin concentrations up to 324 μπιοΐ/ΐ were taken from the laboratory workload. Five serum samples with vis- ible lipaemia were selected.
For the determination of low IgM concentrations 10 cord citrate plasmas were collected.
Q u a l i t y control samples
Five control sera were used to determine the experimental Varia- tion of each immunoglobulin assay on the ACA: two selected pa- tient sera (one containing a low, the other a high concentration);
the ACA calibrator of middle-range concentration; a commercial control serum (Seronorm Protein, lot no 102, Nyegaard, Oslo, Norway) which was also used in the other methods; and reference serum A, the Standard of the nephelometric assay.
Statistical methods
The within-day imprecisions of the five control sera were calculat- ed from 20 duplicate results. The five within-day imprecisions, testcd on homogeneity (BarletCs test) were pooled to obtain an estimated within-day Standard deviation (df = degrees of free- dom = 95) (17).
During 20 days the five control sera, mcntioned beforc, were as- saycd cach day in duplicate. Thc bctwccn-day Standard deviation was estimated frorn thc duplicate results of 50 patient sera (dupli- catcs obtained on different days), and from the results of the 5 control sera. The between-day Standard deviation was tcsted against the within-day Standard deviation (Fw/ier-test). The linear functional relationship of the ACA assay with each of Ine three other assays was calculated by the rnethod of least squares, cor- rccted for experimental errors in both methods (8).
Results
The pooled within-day and between-day Standard deviations of the ACA-assays for IgG, IgA and IgM are given in table 1.
Tab. 1. Imprecision of the ACA immunoglobulin assays Standard deviation
Swithin-day ) Sbeiwccn-day )
IgG (g/l) 0.170.40
IgA (g/l) 0.050.10
IgM (g/D 0.030.06
*) swithin-day was estimated from Standard deviations of 20 dupli- cate determinations of calibrator 3. low and high serum pools, reference serum A and Seronorm Protein (df =95).
**) Shetwccn-day was estimated from duplicate results of 50 human sera assayed independent on different days (df = 50).
The between-day Standard deviation for the three assays appeared to be significantly (p < 0.05) larger than the within-day Standard deviation.
The between-day reproducibilities of the ACA and the three other rnethods, determined for the same control serum, are given in table 2. Table 2 shows that the reproducibilities for all methods were ac- ceptable.
A low and a high polyclonal serum sample (IgG 1.57 and 24.6 g/l respectively) were mixed in 4 known ratios. The expected concentrations were compared with the measured concentrations (average of 5 measurements). Linear yx-regression of the mea-
Tab. 2. Between day reproducibilities of 4 different methods for immunoglobulin assays applied to seronorm protein.
Mean ± Standard deviation
Method n IgG
(g/0
IgA (g/0
IgM (g/l) Aca 20 11.1 ±0.5 2.34 ±0.13 1.25 ±0.08 RIO 20 12.5 + 0.3 2.28 ± 0.06 1.18 ±0.07 ΝΙΑ
(Hyland) 20 11.7 ±0.8 2.18 ±0.10 1.28 ±0.11 TIA(Centrifichem) 20 11.6 ± 0.4 2.16 ± 0.04 l .24 ± 0.05
J. Clin. Chem. Clin. Biochem. / Vol. 21, 1983 / No. '9
Rammeloo and Beunis: Evaluation of immunoglobulin assays on the ACA III 579
sured on the expected concentrations gave a slope of
0.99 (s.d. 0.01) and an y-intercept of 0.05 (s.d.
0.09) g/l.
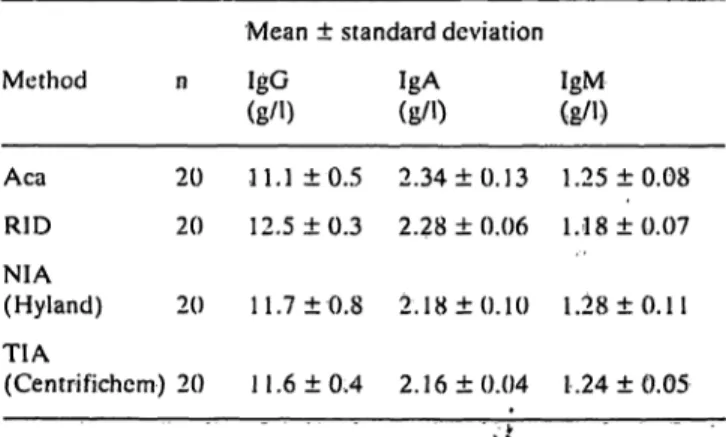
ACA-assays wcre compared with radial immunodif- fusion, turbidimctric and nephelometric assays by analysing 50 human scra in duplicate (on different days). The ACA results were plotted against the re- sults of the other methods (fig. 1).
In addition, the results from 10 sera with Iow IgA concentrations (0.1 to 0.8 g/l) were compared. The functional relationships were comparable to those shown in fig. 1:
y (ACA) = 0.13 + 1.09 χ (RIO),
y(ACA)
=0.05
4-1.14
χ(ΝΙΑ)
andy (ACA) = 0.03 + 1.17 χ (ΤΙΑ).
I '
2
\
0 1 2 5 * 5 6 7 8 9
IgA (radial immunoditfusion) [g/l]
3 4 S 6 7 IgA (Hyland) (g/1)
8 9 10 2 3 0 S 6
IgA (Centrifichem)l 8 9 10(g/ij
15
< 12 O <,σ> 9 6
3 6 9 12 15 18 21 24 27 30
IgG (radial immunodiffusion) [g/l] 6 9 12 15 18 2l 2l 27 30 IgG (Hyland) [g/l]
6 9 12 15 18 21 24 27 30 IgG (Centrifichem) fg/l]
7.2 6.4
I
5·
6^ 4.8
< 4.0 S 3.2
£»
1.6 0.8 0 ,
7.2 6.4 5.6 4.8 4.0 3.2 2.4 1.6
0.8 1.6 2.4 3,2 4.0 4.8 5.6 6.4 7.2 8 0 IgM (radial immunodiffusion) [g/l]
7.2 E.4 5.6 4.8 4.0 3.2 2.4 1.6 0.8 0 0.8 1.6 2.4 3.2 4.0 4.8 5.6 6.4 7.2 8.0
IgM (Hyland) [g/l]
1.6 2.4 3.2 4.0 4.8 5.6 6.4 7.2 8.0 IgM (Centrifichem) [g/l]
Fig. 1. Graphic fepresentatioris of functional relationships between serum immunoglobulin assay results s found with ACA III (y) and radial immunodiffusion, nephelometry (Hyland) and turbidimetry (Centrifichem) (x).
IgA (n = 50): radial immunodiffusion y = ^0.001 + 1.08x; syx = 0.18 Hyland y = -0.03 + 1.13x; syx = 0.17
Centrifichem y = -0.16 -f 1.17x; svx = 0.15
IgG (n = 50): radial immunodiffusion y = 0.17 +"θ.88χ; svx = 0.80 Hyland y = -0.67 + I.02x; syx = 0.80
Centrifichem y = 0.26 -l· 0.95x; syx = 0.64
IgM (n = 49): radial immunodiffusion y = 0.15 + 0.78x; syx = Ο.Ί6 Hyland y = 0.26 + 0.74x; syx = 0.26
Centrifichem y = 0.06 + 0.99x; svx = 0.17
• Mean of 20 results for Seronorm Protein with both methods.
* Mean of 20 results for reference serum A with both methods,
θ Mean of 20 results for ACA calibrator 3; mean of 2 results with Hyland or Centrifichem.
580 Rammeloo and Beunis: Evalu tion of immunoglobulin assays on thc ACA III
To determine IgM concentrations at the lower limit of the measurement r nge of the ACA method (0.25 g/l) and below, we increased the sensitivity by apply- ing a 5-fold predilution instead of the usual 20-fold dilution; the resulting IgM values showed a distinct positive bias of about 0.1 g/l.
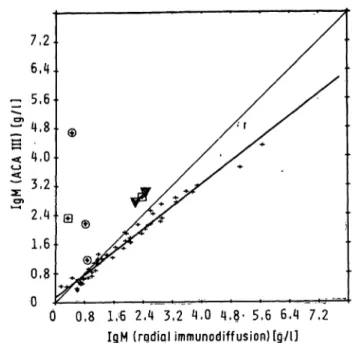
To test for interference by bilirubin, haemoglobin or lipids, immunoglobulins were determined in 5 hae- molytic, 5 icteric and 5 lipaemic sera. No significant interference was found for IgG. The IgA assay on the ACA was influenced only by large amounts of haemoglobin; haemoglobin of about 1.5 mmol/1 caused a positive interference equivalent to approxi- mately 3 g/l of IgA. The IgM assay on the ACA tended to show a positive interference by bilirubin and lipids, whereas haemoglobin of about 0.5 mmol/1 apparently increased the IgM concentration by l g/l (fig. 2).
Although the correlations between the methods were acceptable, -the results showed quantitative dif- ferences, which preclude the possibility of transfer- ring from one method to an other. Attempting to solve this problem, we simulated recalibration of the ACA. Reference serum used s a Standard in the ne- phelometric and turbidimetric assays was also as- sessed by the ACA and radial immunodiffusion.
Taking this reference serum s a general Standard, we multiplied the results of the ACA by the ratio of the reference and ACA value. Thereafter we recal- culated the functional relationships (tab. 3).
In the same way we simulated a recalibration of the ACA based on a control serum. The recalculated re- lationships are also shown in table 3.
Since the simulated recalibrations did not solve the whole problem, especially not for IgM, we also recal-
0,8 1,<6 2,4 3,2 4,Ό 4.8· 5,6 6,4 7,2 IgM (radial immunodiffusion) [g/l]
Fig. 2. Interference by haemoglobin, bilirubin and lipids in the ACA III immunoglobulin M assay.
Φ Results of 3 samples with haemoglobin concentrations of about 0.2, 0.5 and 1.5 mmol/1 c using increasing in- terference.
A Results of 2 samples with total bilirubin concentrations of 225 and 324 μπιοΙΛ
EB Results of 2 samples with gross lipaemia.
+ Results of non-haemolytic, non^icteric or non-lipaemic serum samples.
ibrated the ACA using the results obtained with pa- tient samples: we divided 50 samples into equal groups, then calculated the functional relationships between the ACA and the other methods for the re- sults obtained with the samples of the first group. We corrected the ACA results of the samples m the se- cond group for the calculated slope of the functional relationship. Thereafter we recalculated the func- tional relationships for the samples of the second group (tab. 3).
Tab. 3. The effect of the ACA calibration on the calculated functional relationships. In calculating the functional relationships, the values obtained with radial immunodiffusion, nephelometric (Hyland) or turbidimetric assay (Centrifichem) were kept constant, and the y-values obtained with the ACA assays were corrected by a factor derived from the results of reference serum, control serum or patient samples.
Method
X
IgG RIO ΝΙΑ TIA IgA ΝΙΑRID TIA IgM RID ΝΙΑTIA
ACA-calibrators
0.17 +0.88x -0.67 + 1.02x 0.26 +0.95x -0.001 + l.OSx -0.03 + 1.13x -0.16 + 1.17x 0.15 + 0.78x 0.26 + 0.74x 0.06 + 0.99x
Reference serum (Hyland)
0.05 + 1.05x -0.60+l.lOx 0.81 + 1.01x -0.02 + 1.02x -0.03 + 1.04x -0.02+ 1.08x 0.16 + 0.67x 0.31 + 0.73x 0.06+l.Olx
Control serum Seronorm Protein
0.05+ 1.04x -0.57+ 1.07x 0.78+ l.Olx -0.02+ l.OSx -0.03 + 1.06x -0.02+ l.OSx 0.17 + 0.79x 0.34 + O.SOx 0.09+ 1.06x
Patient samples
-0.39 + -1.44 + -0.44 + -0.03 + -0.02 + -0'02 + 0.36 + 0.03 + 0.26 +
.06x.llx .10x .04x.02x .02x .03x.OOx .05x
J. Clin. Chem. Clin. Biochem. / Vol. 21, 1983 / No. 9
Rammeloo and Bcunis: Evaluation of irramunoglobulin assays on thc ACA III 581
Discussion
The reproducibility of the ACA was comparable to those of the other methods (tab. 2). The experimen- tal error of a single measufement was almost entirely determined by the between-day Variation of the iri- strument. Variation due to predilution errors ap- peared to be relatively smalt.
Similarity between the ACA calibrators and human serum, tested in the IgG-assay, was quite satisfacto- ry. We did not test the similarity between the cali- brators and monoclonal immunoglobulins, since it can be anticipated from results obtained with the other methods that some of those would behave sim- ilarly and some would not (9, 10, 11).
The ränge of the ACA assay, from the lowest to the highest calibrator» was sufficient to meet general clinical requirements: for IgG from 1.0 to 60 g/l and for IgA and IgM from 0.25 to 15 g/l. In exceptional cases, a reliable determination of low IgA or IgM levels is clinically obligatory. In the low IgA ränge (0.1 to 0.8 g/l) the same relationships between the ACA and the other methods afe found, but none of the methods tested would be sensitive enough to de- tect IgA-deficieiicy. The same holds for the determi- nation of immunoglobülin concentrations in cere- brospinal fluid. In such cases more sensitive meth- ods, i.e. radioimmunoassay or haemagglutination should be applied (12). The üpper reference limit of the IgM concentration in serum of newborns is about 0.20 g/l. An IgM coneentration above this limit can be an indication of intra-uterine infection. Because the lower limit of the ACA method is 0.25 g/l, we increased the sensitivity of the IgM assay by applying a 5-fold predilution. This approach cannot be re- commended, however, because it resülted in a posi- tive biäs of 0.1 g/l.
Interference by haemoglobin, bilirubin or lipids in the ACA assays was related to the sample size re- quired: 320 for IgM, 100 for IgA and 80 for IgG. This effect might be explained from the bichro- matic measurement on the ACA. The turbidity was measured äs the difference in äbsorbances at 340 and 540 nm. As a haemoglobin'concentration of 0.5 mmol/1 also causes a different absorbance at these two wavelengths, apparently higher IgM results were obtained (fig. 2). Therefore we recommend that vis- ibly lipaemic, icteric or haemolytic samples should be excluded from determination of immunoglobul- ins, especially IgM on the ACA.
Although the correlations between the results of the different methods compared were acceptable, quan- titative differences in immunoglobülin coneentra-
tions were found. These differences are easily as- cribed to the Standards used (13). To test this as- sumption, we simulated recalibrations of the ACA on a general Standard and a commonly used control serum. From table 3 it is obvious that the recalculat- ed functional relationships were improved for IgG and IgA, but not for IgM. Thus the differences in the IgM results cannot be ascribed to the Standards alone. Other possible causes, mentioned in the liter- ature, are the use of different antisera, diluents con- taining various amounts of polyethylene glycol (14) or simply the different measuring principles of the methods (15, 16).
The reaction conditions, which can influence the re- sults, are inherent to the method applied in the indi- vidual laboratory. If a laboratory used several meth- ods, it might not be sufficient to use the same Stand- ard and antiserum. By doing this in the present study, we did not obtain the same results for IgM by the turbidimetric assay (Centrifichem) and the ne- phelometric assay (Hyland). Therefore, we strongly recommeYid calibration of the ACA (or any other method) with patient samples. Although functional relationships of IgA and IgG did not improve very fnuch or even became worse (almost certainly due to statistical Variation of the results), IgM results ob- tained in this way became interchangeable.
After calibration, the ACA assays of immunoglobul- ins are easy to perform over a wide clinical ränge, except for low IgA and IgM concentrations. We re- commend, however, that a filter balance be per- formed before determining the immunoglobülin concentrations on the ACA, because the immuno- globülin assay on the ACA appeared to be more sen- sitive to errors in the filter ränge of the Instrument than any of the other assays on the ACA.
The ACA assays present a good alternative for the assessment of the immunoglobulins in laboratories with a relatively small work load, and for emergency determinations.
Acknowledgements
We thank Mr. J. Jongeneel (Holy Ziekenhuis, Viaardingen, The Netherlands), Mr. J.A.P. Stroes, Ph. D and staff (Stichting Samenwerking Delftse Ziekenhuizcn, Delft, Thc Netherlands) for their CG-Operation,, Bernic Ceulen, Trudy van Leeuwen, Magda van Wissen and Chris van Poclje for their technical assistancc.
Herman Buis and Mr. K. Stinshoff* Ph. D. (Du Pont) are acknowl- edged for supplying us with reagents and financial support.
582 Rammeloo and Beunis: Evaluation of immunoglobulin assays on the ACA III
References
1. Blom, M. & Hjome, N. (1976) Clin. Chem. 22, 657-662.
2. Boigne, J. M., Boigne, N., Galacleros, F., Nalpas, B. & Phi- lippen, C (1977) Ann. Biol. Clin. 35, 237-254.
3. Whichcr, J.T., Perry, D. E. & Hobbs, J. R. (1978) Ann. Clin.
Biochem. 75, 77-85.
4. Whicher, J.T. & Blow, C. (1980) Ann. Clin. Biochem. 77, 170-177.
5. Shulman, G. (1980) Ann. Clin. Biochem. 77, 178-182.
6. Dito. W. R.,Tucker, E. S. & Nakamura, R. M. (1981) Am. J.
Clin. Pathol. 76. 753-759.
7. Landaas, S., Skrede, S. & Eldjarn. L. (1978) Scand. J. Clin.
Lab. Invest. 38, 295-299.
8. Deming. W.E. (1943) Statistical adjustment of data. John Wiley and Sons, New York, NJ.
9. Virella, G. & Fudenberg, H.H. (1977) Clin. Chem. 23, 1925-1928.
10. Cloppet, H.. Francina, A., Coquelin, H., Boucaud-Maitre, Y.. Hutinel. P. & Creyssel, R. (1982) Clin. Chem. 28, 180- 182.
11. Whicher, J.T. (1980) La Riccrca Clin. Lab. 10, 189-195.
12. Dionne, J. A. & Peoples, J, C. A. (1978) In Automated Im- munoanalysis, part l, (R. F. Ritchie, ed.) pp. 227-237, Mar- cel Dekker, New York.
13. Mitford Ward, A. (1980) La Ricerca Clin. Lab. 70,213-217.
14. Pesce, M. A. & Bodöurian, S. H. (1982) Clin. Chem. 28,
516-519. f |
15. Whicher, J.T., Hunt, J., Perry, D.E., Hobbs, J. E., Fifield, R., Keyser, J., Kohn, J., Riches, P., Smith, A. M., Thompson, R. A., Milforward, A. & White, P. (1978) Clin. Chem. 24, 531-535.
16. De Bruyn, A. M., Klein, F., Neumahn, H., Sandkuyl, L. A., Vermeeren, R. & Le Blansch, G. (1982) J. Irnmunol. Meth- ods 48, 339-348.
17. Dixon, W. J. & Massey, F. J. (1969) Introduction to Statistical analysis, 3rd ed. McGraw-Hill, London, pp. 112-113.
Ir. T. Rammeloo Stichting Samenwerkihg Delftse Ziekenhuizen
Klinisch Chemisch Laboratorium Postbus 5010
NL-2600 GA Delft
J, Clin. Chem. Clin. Biochem. / Vol. 21, 1983 / No. 9