Limitations of Superuid Helium Droplets as Host System Revealed by Electronic
Spectroscopy of Embedded Molecules Dissertation
zur Erlangung des Doktorgrades
der Naturwissenschaften (Dr. rer. nat.) an der Fakultät für Chemie und Pharmazie
der Universität Regensburg
vorgelegt von
Tobias Premke aus Passau
Regensburg, den 21. Dezember 2015
Tag der mündlichen Prüfung:
Prüfungsausschuss:
19.02.2016
PD Dr. Rainer Müller (Vorsitzender) Prof. Dr. Alkwin Slenczka
Prof. Dr. Bernhard Dick Prof. Dr. Alfons Penzkofer
Contents
1 Introduction 1
2 Basic Principles 5
2.1 Physical Properties of Superuid Helium . . . 5
2.2 Superuid Helium Nano Droplets . . . 9
2.2.1 Generation of Superuid Helium Droplets . . . 15
2.2.2 Doping - Pick-up Process . . . 22
2.3 Electronic Spectroscopy inside Helium Droplets . . . 26
2.3.1 Laser-Induced Fluorescence Spectroscopy . . . 26
2.3.2 Zero Phonon Line . . . 28
2.3.3 Phonon Wing . . . 30
2.4 Emission Spectroscopy inside Superuid Helium Droplets . . . 32
3 Experimental Setup and Methods 35 3.1 Construction of the Helium Droplet Apparatus . . . 35
3.1.1 Continuous Flow Helium Droplet Beam . . . 35
3.1.2 Pulsed Helium Droplet Beam . . . 40
3.2 Laser Setup and Detection Unit / Continuous Wave (cw) . . . 42
3.2.1 cw Laser Setup . . . 42
3.2.2 LIF and Dispersed Emission . . . 43
3.2.3 Bolometer Unit . . . 45
3.2.4 Quadrupol Mass Spectrometer . . . 51
3.3.2 Dispersed Emission . . . 52
3.3.3 Depletion Technique . . . 53
3.3.4 Stoichiometric Analysis . . . 55
3.3.5 Quadrupole Mass Spectrometer . . . 57
4 Phthalocyanine 59 4.1 Introduction . . . 59
4.2 Experimental Results . . . 60
4.2.1 Laser-Induced Fluorescence / ZPL and PW . . . 60
4.2.2 Saturation Behavior of Pc . . . 64
4.2.3 Dependence of ZPL and PW on the Mean Droplet Size . . . 72
4.2.4 Dispersed Emission . . . 77
4.2.5 Van der Waals Complexes of Phthalocyanine Argon . . . 83
4.2.6 O-resonant Excitation of Phthalocyanine . . . 88
4.2.7 Low Frequent Vibronic Excitation . . . 103
4.3 Conclusions . . . 106
5 Depletion Spectroscopy 110 5.1 Introduction . . . 110
5.2 Experimental Details . . . 111
5.2.1 Bolometer - Basic Experiments . . . 111
5.2.2 Pentacene . . . 116
5.3 LIF and Depletion . . . 118
6 Iodine in Superuid Helium Droplets 120 6.1 Motivation . . . 120
6.2 Introduction . . . 121
6.2.1 Spectroscopic Properties of Iodine . . . 122
6.3 Experimental Details . . . 128
6.3.1 Pick-up Conditions . . . 128
6.3.2 Mean Size of Helium Droplets / Depletion . . . 141
6.4 Results . . . 143
7 Discussion 146
Bibliography 151
1 Introduction
The rst spectroscopic measurements of molecules embedded in helium droplets were reported in the early 1990s [1, 2]. These rst experiments on SF6 assumed that the superuid helium droplets were a uniquely cold nanomatrix for molecules and molecular complexes, combining the benets of solid matrices as well as of the gas phase and avoiding some of the disadvantages of both techniques at the same time. By the usage of helium droplets it was possible to prepare very cold and isolated molecules inside a liquid "matrix" with negligible viscosity. This led to a considerable scientic interest and the technique became a serious alternative to the well-known methods of isolated atoms in the gas phase or in solid matrices.
Thus, the helium droplets became a frequently used cryogenic host system for nu- merous spectroscopic experiments on the behavior of dierent atoms, ions, neutral molecules, radicals, clusters as well as reactions in helium [310]. Since the rst mea- surements of SF6 in helium droplets the upcoming experimental observations have shown evidence for the superuidity of helium droplets. Many of these experiments on molecular spectroscopy within the frequency range from microwave up to the UV region have demonstrated the unique properties of helium droplets as cryogenic host at 0.37 K. Beside various experimental examinations, theoretical simulations have also been published describing the properties and the behavior of the droplets as well as the interactions between helium and the dopant species [1116].
Despite the superuidity of the helium droplets and their vanishing viscosity, there are weak interactions between helium and the dopant species. These interactions can cause characteristic spectral features. Such microsolvation eects of superuid
1
helium can be studied by means of high resolution spectroscopy and, if available, in comparison to corresponding experimental data from the gas phase. The experi- mentally observed, helium-induced features can be found in the form of multiplet splitting of molecular transitions [17], solvent shifts of electronic transition frequen- cies (zero phonon line ZPL), increased moment of inertia and phonon wings (PW) [4]. On the basis of the variety of experiments a model was set up which postulates a non-superuid helium solvation layer around the dopant. By means of this helium dopant solvation complex the experimental observations could be explained only empirically. Pure molecular signals (ZPL) in electronic spectra are accompanied by the phonon wing (PW) which is attributed to the spectroscopic signature of the superuid helium droplet. Additionally, the PW can also include the spectroscopic signature of the non-superuid solvation layer around the dopant such as van der Waals modes of the solvation complex. Despite numerous experimental results as well as theoretical improvements, a general quantitative explanation of the helium- induced spectral eects has not been found so far.
Since the quantitative understanding of helium-induced spectral features is essen- tial to interpret molecular spectra recorded in helium droplets, further experiments are needed. The aim of this study is to contribute further experimental details on microsolvation in superuid helium droplets by means of high resolution electronic spectroscopy of molecules in helium droplets. Beside a detailed examination of the ZPL as well as of the PW of phthalocyanine (Pc) by means of uorescence exci- tation and dispersed emission spectroscopy, the microsolvation of helium droplets will be examined over a wide range of the mean droplet size from 103 up to 107 atoms. For this purpose two major aspects shall receive attention; the chromophore shall be of simple molecular structure and it has to be chosen in a manner that the mean droplet size can be manipulated from small up to huge helium droplets. In this regard, iodine was selected for the purpose of this study. Its structure possi- bly avoids the presence of numerous variants of the solvation complex, its detailed spectroscopic data in the gas phase is very well documented to a high standard in
3 the literature [1820] and theoreticians have provided a high level helium to iodine interaction potential [21]. Moreover, it allows for a rotational resolution of electronic transitions, which is directly related to the moment of inertia and, thus, information about the solvation complex can be extracted from experiments. Finally, this study might be extended by a similar examination of the polar ICl molecule in helium droplets.
The electronic excitation of iodine is accompanied with a signicant increase of the equilibrium distance in the excited state. This leads to a broad Franck-Condon dis- tribution and the electronic excitation as well as the radiative decay of iodine end in higher vibrational levels of iodine. These vibrational modes can couple to the helium droplets and the energy dissipates. This leads to a decrease of the mean size of the doped helium droplets. Thus, only a small amount of the absorbed energy decays radiatively and the emission of iodine is shifted to infrared radiation in a frequency range between 745 nm and 762 nm (λgas phase ≈ 640nm). By this process one can prot by the sensitivity of the depletion spectroscopy using a bolometer. For this purpose a commercial bolometer had to be implemented to the experimental setup.
By the analysis of iodine and phthalocyanine two contrary systems are selected.
Electronic transitions in both molecules are accessible by the cw dye ring laser sys- tem. Phthalocyanine is a planar organic molecule oering a huge and planar surface to the helium atoms and thus, the non-superuid helium solvation layer can form dierent structures. In contrast, the diatomic iodine is of simple molecular shape.
That means that dierent complex structures of the non-superuid helium solvation layer and the dopant can be expected to be avoided. Moreover, the dopant to helium interaction of I2 should dier signicantly from Pc due to a dierent polarizability of the molecules and the higher electronegativity of iodine compared to carbon. Thus, both molecules should show clear dierences in their microsolvation behavior which can be examined by means of electronic spectroscopy. These experiments might end in a comparison of eects due to the non-superuid helium and the superuid helium droplets and shall provide a better understanding of the microsolvation in
helium droplets.
The work is structured as follows. First, the most important features of superuid helium and the helium droplets will be summarized. The second chapter describes briey the experimental setup followed by a description of the measurement tech- niques. Afterwards, it will be shown that the operation of the bolometer could be tested and veried by excitation measurements of pentacene in helium droplets.
Then, the next two chapters include the spectroscopic examination of phthalocya- nine and iodine inside superuid helium droplets. In the end the results are sum- marized and discussed and a conclusion on the microsolvation in superuid helium nano droplets is given.
2 Basic Principles
In the rst part of this chapter the most important features of superuid helium will be summarized. Afterwards it will be shown how the invention of dierent techniques of low temperature spectroscopy in the 20th century opened up a wide eld of interdisciplinary research and led to the development of the superuid he- lium droplet beam method. After that the main principles of the generation and the handling of this unique method will be discussed. Finally, the description of the special spectroscopic properties of superuid helium droplets will be presented.
This includes its benets as well as its disadvantages compared to other techniques.
2.1 Physical Properties of Superuid Helium
Helium is the only known element which remains liquid down to the absolute zero point at standard conditions for pressure. The reason for this phenomenon can be found in a weak polarizibility (α=0.21Å3[8]), low mass and a high zero point energy of helium [22]. The helium appears in two isotopic variants, namely the dominating bosonic species 4He and a minor fermionic component 3He (0.000137 %). Since all experiments in this work were performed inside4He droplets, the term "helium" shall refer from now to the bosonic helium isotope and only some phenomena of3He will be mentioned. At normal pressure the gas to liquid phase transition occurs at 4.21 K for 4He (3.19 K for 3He). A second phase transition indicated by discontinuities of
5
physical quantities such as viscosity [23, 24] ( η = 4⋅10−9 C.G.S. units1 [25, 26]), heat capacity [27], heat conductivity and speed of sound [22] is observed under normal pressure at 2.17 K for 4He (2.6 mK for 3He) whereby the systems stays liquid. Additionally, a fountain eect [28] as well as the Onnes eect [29] (Rollin- lm [22, 30, 31]) can be observed, and quantized vortices can be found [22, 32, 33] in liquid helium below 2.17 K. The change of the physical properties at this so-called lambda point (Tλ =2.17K at 1 bar) marks the phase transition between He I and He II. Above Tλ helium is called He I and can be treated like a normal liquid whereas below Tλ helium is called He II. This state has to be described as a quantum uid and its phenomena are dominated by quantum eects. The low polarizibility of the helium atom leads to attractive, very weak van der Waals forces between the helium atoms manifested in a helium-helium potential with a potential well of only 11.0 K at an equilibrium distance of 2.97 Å. Equation 2.1 allows the calculation of the thermal de Broglie wavelength:
Λ= h
√2πmkBT (2.1)
In this equation h is the Planck constant (6.62606957(29) ⋅10−34 Js), kB the Boltz- mann constant (1.38064852(79)⋅10−23J/K), m the mass of helium (4.002602(2)amu2) and T the temperature. At Tλ a value of Λ=5.923849Å can be calculated, which exceeds the equilibrium distance in the interaction potential by a factor of 2. In this situation the wave nature of the atoms has to be taken into account and therefore the helium is dened as a quantum uid. The system condenses in a single global state which describes the entire ensemble of the helium atoms. A macroscopic amount of helium below 2.17 K can be described by one global quantum state which can be written, equal to the Bose-Einstein condensation, as a single many-body wave function and the absolute square of this function is a measure of the number of he- lium atoms. The analogy to the Bose-Einstein condensation was already suggested
1The centimetergramsecond system of units; kinematic viscosity in cms2.
2Atomar mass units,1amu=1.660538782⋅10−27kg
2.1 Physical Properties of Superuid Helium 7
Fig. 2.1: Plot of the ratio of normal uid and superuid helium in He II below Tλ (left side) and the specic heat capacitycV of4He between1K≤T ≤3K (right side), both taken from [22].
in 1983 [34]. The energy of the He2 binding state is found to be close to its dis- sociation limit and the state is delocalized far beyond the helium-helium distance of the dimer. For the delocalization an expected value of the He-He distance of 52±4Å could be experimentally determined [35]. The unusual macroscopic phe- nomena can be described by the Two Fluid Model treating the thermodynamic and hydrodynamic properties of liquid helium, which was suggested by László Tisza in 1938 [36, 37]. The idea of this theory is that He II is a temperature-dependent mixture of two liquids. Thus, He II consists of normal uid and superuid He (as shown in Fig. 2.1 left panel). It can be seen that with decreasing temperature the fraction of normal uid decreases while the superuid fraction increases. This pro- cess starts at 2.17 K and is nished with 100 % superuid 4He at about 1 K. This system remains uid down to the absolute zero point of temperature for pressures below 25 bar. The vertical dashed line marks the transition temperature Tλ (at 1 bar). The transition point is called Lambda point which reects the shape of the the curve progression of the heat capacity cV (cf. right panel of Fig. 2.1) which
Fig. 2.2: Double logarithmic pressure-temperature phase diagram for 4He according to Buchenau et al. [38]: the bold lines mark phase transitions, the dotted lines show some isentropes for a helium expansion into a vacuum starting at dierent expansion conditions p0 and T0.
reminds of the Greek character lambda. The Two Fluid Model cannot explain the behavior of helium at temperatures near the absolute zero point, it only describes the macroscopic behavior below the Lambda point. The borderline which marks the transformation of the liquid helium in the phase diagram (see gure 2.2) is called λ-line. Below a pressure of 25 bar it is not possible to transform helium into its solid phase [22] by cooling. This unique property allows to keep helium down to temperatures close to the absolute zero point in its liquid form and determines the horizontally boundary curve between the liquid and the solid state in the p-T-phase diagram. A consequence of this missing solid state below a pressure of 25 bar is the
2.2 Superuid Helium Nano Droplets 9
Fig. 2.3: Viscosity of 4He [22].
lack of a triple point in the phase diagram of helium, a point where the three classical phases, namely liquid, solid and gas, are in equilibrium. The superuid state of helium exhibits some more special physical proper- ties. Figure 2.3 shows the viscosity of liquid helium as a function of temperature near the absolute zero point [22]. At tempera- tures belowTλ=2.17K, the transformation from the normal phase to the superuid one starts and the viscosity of the liquid van-
ishes abruptly. Vanishing viscosity means no energy exchange between superuid helium and within the helium. This feature is warranted as long as the relative velocity is below the Landau velocity. This critical velocity is named after Lew D.
Landau [22] and its value is dened as vLandau=58 ms ( [22, 39]). Below this speed limit He II cannot accept energy via inelastic collisions. Hence, any substance can move frictionless in this quantum uid as long as its velocity is below the Landau speed. Another extraordinary feature of the superuid state is its thermal conduc- tivity, which exceeds that of copper by a factor of 30. Combined with the very low temperature of this quantum uid it constitutes a highly ecient cryo cooler for a large variety of experiments performed at a molecular level. In addition, helium is transparent in a wide range of electromagnetic radiation from the ultraviolet up to the infrared where its refraction index is almost n=1. 40 years after the discovery of the superuid phase of4He Kapitza was awarded the Nobel Prize in 1978.
2.2 Superuid Helium Nano Droplets
In 1911 Dunnoyer was able to produce the rst atomic beam and he showed that atoms can move along a straight line in a vaccum [40]. With these experiments
he laid down the foundations for one of the most important research methods of physics and chemistry in the 20th century. One of the rst experiments was the Stern-Gerlach experiment [41]. The technique was further developed and improved and is now used as a powerful method which allows the examination of isolated cold molecules. With this technique it was possible to analyze e.g. isolated molecules, and any kind of intermolecular interaction under single collision conditions.
The beam is generated by an expansion of atoms or molecules under high pressure through an orice into the vaccum. The pressure has to be set in such a way that the mean free path λ¯ of the particles is smaller than the diameter d of the orice which leads to many collisions between the particles and thus, their thermic energy is cooled by this adiabatic expansion (JouleThomson eect [42]). Both, velocity and temperature of the beam are dependent on stagnation pressure and the temperature of the nozzle [43]. In case a sample cannot be provided at high pressure, the so-called seeded beam technique can be applied by mixing the sample as minority component to a carrier gas at high pressure. Beside ecient cooling, this technique allows to tune the velocity of the sample to that of the majority component which is large for light particles and small for heavy particles. The cooling eciency in a molecular beam is dependent on the density of the quantum states within the sample. Thus, the vibrational degree of freedom cannot be cooled as eciently as the rotational or translation3 degree of freedom. This leads to very complex spectral data that is dicult to interpret, since hot bands4 can be observed. Nevertheless, there is no doubt that particle beams are still of high value for fundamental research [4446] as well as technical applications such as molecular beam epitaxy [4749].
Another widely used method for the investigation of cold samples is the matrix isolation spectroscopy. This technique was rst described by E. Whittle, D.A. Dows und G.C. Pimentel [50] in 1954 and became a standard method in physics and
3Translation is relative to the molecular beam.
4Transitions from higher vibronic states v≥1
2.2 Superuid Helium Nano Droplets 11 chemistry to analyze atoms, molecules, ions as well as reactive intermediates at low temperatures (10 - 20 K). For this purpose the probe molecules are highly diluted (only 0.1 % or less) into an inert gas such as noble gas, nitrogen or other inert species similar in shape to the probe molecule. This mixture condensates on a transparent cold substrate in order to generate a crystal doped with molecules isolated from each other. In this environment the substrate is trapped and stabilized inside a crystal cage, which means that the rotation of the sample is frozen, diusion is suppressed and reaction kinetics is dramatically lowered [51] - by way of that even highly reac- tive or metastable species can be analyzed. However, this host system may modify physical and chemical properties of the guest species. The perturbative inuence can be minimized by an appropriate choice of the matrix substance. Another disadvan- tage of matrix isolation spectroscopy is the large variety of the structure of the solid matrix around the dopant species which are addressed as sites. Each of these sites exhibits its own shift of spectroscopic transitions of the dopant species which results in severe line broadening. As a consequence, the vibrational ne structure remains hidden and a reasonable analysis of the dopant species requires sophisticated spec- troscopic techniques to discriminate against this inhomogeneous line broadening.
Moreover, it is almost impossible to observe bimolecular reactions inside solid matri- ces. Thus, the bimolecular chemistry is generally not accessible and only unimolec- ular processes are observable by means of matrix isolation spectroscopy. Finally, noble gas matrices are notoriously poor heat sinks because only very low energy lattice phonons are available to accept molecular vibrational quanta and hence, thermalization is very slow compared to solution [52]. Nevertheless, by means of appropriate spectroscopic techniques even a homogeneous line width of individual vibronic transitions can be observed [53, 54] (line width of only 0.99 cm−1).
In general, both techniques have dierent advantages and disadvantages. By the usage of helium as matrix material in combination with the supersonic jet technique the advantages of both methods could be combined by avoiding simultaneously most
of the drawbacks. In 1992 the rst paper on molecular spectroscopy in combination with a helium cluster beam was reported. However, the laser system, which was a line tunable CO/NO gas laser, did not allow to record a reasonable spectrum.
This led to severe misinterpretations of the spectroscopic data [1]. Three years later another group in Göttingen succeeded to record the same spectrum with a contin- uously tunable diode laser. The IR spectrum of SF6 revealed rotational resolution [2]. The intensity of the rotational ne structure revealed a temperature of only 0.37(1) K which is far below the lambda point of bosonic helium. This experiment marks the beginning of the molecule spectroscopy combined with the helium droplet beam technique, which provides a lot of benets. The resolved rotational ne struc- ture with rather sharp resonances revealed two important pieces of information.
First, the dopant resides inside the droplet and not on the surface. Secondly, the host system exhibits negligible viscosity and, therefore, is possibly superuid as it can be expected from the temperature. That allows to observe even rotationally resolved spectra which were only known from the gas phase experiment. Another remarkable physical aspect of the droplets is their thermal behavior. The highly ecient thermal conductivity in combination with evaporative cooling serves for cooling times as short as 10 ns [55] within the droplet beam. Similarly ecient is the thermalization of hot dopant species after the pick-up. The internal and kinetic energy of the dopant dissipates into the helium droplet and is released by evapo- ration of helium atoms from the droplet surface within ns time scale [2]. Such an energy can be the internal energy of a dopant or the excess energy after electronic excitation of a dopant inside the droplets and even energy released by a molecu- lar reaction inside the droplets. Thus, single molecular species as well as molecular complexes generated by multiple particle doping followed by condensation inside the helium droplet are thermalized to 0.37 K with all degrees of freedom. With respect to the nal temperature helium droplets as a host system exceed the supersonic jet technique. A further aspect of the droplets is the possibility to control the stoi- chiometric composition of molecular complexes generated inside the droplets. As
2.2 Superuid Helium Nano Droplets 13 described in chapter 2.2.2, the pick-up process obeys Poisson statistics which al- lows for a non-destructive analysis of the number of dopant particles of the complex being responsible for an individual signal in an IR or UV/VIS spectrum. By the usage of more than one pick-up unit, dierent particles can be doped selectively in a given order into the helium droplets, and, thereby, not only the stoichiometry is controlled but in addition the cluster conguration can be inuenced. Single atoms, molecules, ions or radicals can be examined as well as weakly bound van der Waals clusters and many metastable complex congurations which are not accessible in the gas phase. Moreover, electron or proton transfer pathways can be analyzed and even chemical reactions can be studied inside the helium droplets. One of the rst chemical reactions prepared in helium droplets was the redox reaction of nitrous oxide and barium [56]. Since the vibrational energy of the hot BaO* product mol- ecule dissipates eciently, the dispersed emission of the electronically excited BaO revealed a very sharp vibrational progression of the electronic ground state. Finally, the helium droplets are optically transparent over a wide range from ultraviolet up to the infrared light. Due to all these unique properties, superuid helium droplets are an ideal host system with an exceptional cryogenic capability for spectroscopic investigations of cold molecular systems. Since the particle density of the helium droplet beam is considerably smaller than that of a supersonic jet, highly intensive light sources (e.g. lasers, FEL, synchrotron radiation) are used for such examina- tions. In some cases this can cause saturation of individual transitions leading to line broadening. Such dominant saturation line broadening can be avoided by the attenuation of the intensity of the laser beam to reach high spectral resolution.
Spectroscopy of molecules in superuid helium droplets has two dierent aspects.
On the one hand, atoms, molecules, ions, radicals, clusters or van der Waals com- plexes are investigated spectroscopically at very low temperatures. On the other hand, the spectroscopic data of a dopant species is examined in order to extract information about the helium environment or, more precisely, about microsolvation in superuid helium. These experiments help to understand dierent eects (cf.
chapter 2.3) occurring inside the helium droplets. In both cases it is often useful to compare the results with the outcome of experiments conducted in a supersonic jet or other rare gas matrixes.
Various experimental observations provide strong evidence for the superuidity of helium nanodroplets. The rst one was the rotationally resolved infrared spectrum of the SF6 [2], showing a ne structure which is usually only detectable in gas phase experiments. It was clear evidence for the free rotation of the molecule inside the droplets without any friction. By tting the experimental data a temperature of only 0.38±0.01K [2] could be determined. This temperature is far below the λ-point.
All rotationally resolved spectra taken for molecules in helium droplets conrmed the temperature of 0.38 K and are consistent with theoretical predictions [11]. Ad- ditionally, for SF6 a red shift of the ν3 vibrational frequency could be found. This shift is in the order of 1 % of the value observed in the gas phase and the moment of inertia obtained from the spectrum in helium droplets is nearly increased by the factor 3 compared to the gas phase. This increase could be explained by 8 helium atoms being attached to each of the eight faces of SF6 octahedron [2] even though the rst solvation layer of SF6 takes more than only 8 helium atoms [3].
Another rotationally resolved infrared spectrum recorded for OCS in helium droplets also revealed a temperature of 0.37±0.02K as well as an increase of the moment of inertia by the factor 2.8. A simple model predicted a ring of six helium atoms located around the waist of the OCS molecule [57]. It was experimentally determined that this equatorial helium "donut" around the OCS molecule consists of only ve 4He atoms [58]. By the examination of the IR spectrum of OCS in 3He droplets it was found that the rotational ne structure had vanished. This is not astounding for a normal uid since the temperature of 3He droplets of 0.15 K [11, 59] is too warm for
3He to be superuid. By adding a small amount of4He to the expanding helium gas it could be shown that about 604He atoms suce to recover rotational resolution in the IR spectrum of OCS [60]. The experimental observation strongly indicates that
2.2 Superuid Helium Nano Droplets 15 60 helium atoms is the minimum number needed for superuidity. This microscopic Andronikashvili experiment proposed that the appearance of sharp rotational spec- tra of a single molecule is a microscopic indication of superuidity [60]. The number of 60 is consistent with path integral Monte Carlo calculations which provided evi- dence for superuid behavior of pure4He clusters with only 64 atoms [61].
Furthermore, an important experimental observation could be found in the elec- tronic spectrum of glyoxal in helium droplets. Apart from the sharp zero phonon line (ZPL cf. chapter 2.3.2) glyoxal also shows a broad signal called phonon wing (PW cf. chapter 2.3.3) [62]. The phonon wing exhibits a very characteristic spectral shape which resembles the spectrum of elementary excitations of superuid helium.
This was extracted from neutron scattering on bulk superuid helium [63, 64]. The matching of the experimental data of glyoxal and the simulation provide experimen- tal evidence for superuidity of4He droplets.
2.2.1 Generation of Superuid Helium Droplets
The helium droplet technique is based on an adiabatic expansion of highly puried (99.99990 % helium), precooled helium under high stagnation pressure (5 bar <p0
< 80 bar) through a small (5 µm ≤ dnozzle ≤ 10 µm) cold (5 K <T0<25K) orice into a vaccum chamber. Under these conditions the helium expands either from the gas phase or from the liquid phase. In the rst case adiabatic expansion and many-body collisions cause condensation of droplets. In the second case a liquid expands into the vacuum chamber which defragments into droplets due to the sur- face tension. This expansion proceeds isentropically [65]. A series of isentropes are shown in the phase diagram in Fig. 2.2 as dotted lines. The isentropes dier in the starting conditions given by the nozzle temperatureT0 and the stagnation pressure p0. These are divided into three sections addressed as I, II, and III. Those in section I start from the gas phase, while those in section III expand from the liquid phase.
The section II addresses the singularity of an expansion which directly approaches the critical point (Tc, pc) and proceeds along the critical isentrope. Accordingly,
expansion from section I is called sub-critical whereas expansion from section III is called super-critical [38]. The droplets generated under super-critical conditions are profoundly bigger than the droplets generated under sub-critical conditions. The isentrope, which contains the critical point (Tc=5.2K and pc=2.26bar) and hence separates area I from III, is called critical isentrope. As referred in [38], this isen- trope and the isentropes located nearby the critical one form area II. At the critical point it is not possible to distinguish between the gaseous state and the liquid state.
They are coupled with each other. Above Tc the helium can be found in its gaseous state. In contrast to the equation existing for area I, analytical equations for the isentropes in area II and III cannot be derived [38]. The resulting mean droplet size and its distribution as well as the speed distribution and the mean velocity v¯ depend on the stagnation pressure p0 and the nozzle temperature T0 and thus, on the expansion mechanism (sub-critical / super-critical) [38, 6671]. Experiments revealed that the mean velocity v¯ of the helium droplets ranges from 200 ms up to 400 ms at higher nozzle temperatures. The velocity distribution is found to be very sharp (δvv ≈ 0.01−0.03) [4, 38]. For sub-critical expansion the droplet size distri- bution could be determined by deection experiments of the droplet beam by a secondary beam of heavy molecules such as SF6, crypton or argon [67, 68] as well as by attenuating the droplets by the electrons of a mass spectrometer ionizer [72].
It was shown that this droplet size distribution follows a log-normal distribution [68]:
f(N) = 1 N σ√
2π ⋅exp(−
(lnN−µ)2
2σ2 ). (2.2)
This function corresponds to a Gaussian function, however, with the square of the logarithm of the variable in the exponent. It is the probability distribution for the droplet size given by the number N of helium atoms in a droplet. The parameters µand σ are dependent on the source conditions and can be calculated by the equa- tions 2.9 and 2.10 [65]. In gure 2.4 the log-normal function is plotted for dierent
2.2 Superuid Helium Nano Droplets 17
Fig. 2.4: Plot of the size distribution of the helium droplets (sub-critical) for dierent nozzle temperaturesT0 and a stagnation pressurep0 of 20 bar. The curves were calculated with data obtained by Schilling [65] and the equation 2.2. The higher T0, the more pointed the distribution. Its mean value also shifts to smaller droplet sizes simultaneously.
nozzle temperatures T0 and at a stagnation pressure of p0 =20bar. An increase of the width of this distribution can be recognized for a decreasing temperature T0 of the nozzle. The full width at half maximum (FWHM)∆N1
2 was determined experi- mentally and it was found that helium clusters between1⋅103 and1.5⋅104 follow the equation∆N1
2 = (0.88±0.06) ⋅N¯ [65]. The theoretical equation 2.3 of∆N1
2 depends onµand σ:
∆N1
2
=exp(µ−σ2+σ
√
2ln2) −exp(µ−σ2−σ
√
2ln2). (2.3) The maximum of the droplet size distribution can be calculated with the equation
2.5
df
dN =0! (2.4)
Nm=exp(µ−σ2). (2.5)
In this equation Nm represents the most probable droplet size with its probability
fmax= 1 σ√
2πexp( σ2
2−µ). (2.6)
The mean droplet size N¯ can be calculated by the expectation value of the log- normal distribution following equation 2.7
N¯ =exp(µ+ 1
2σ2) (2.7)
with a standard deviation sN¯
sN¯ =N¯
√
eσ2−1. (2.8)
By means of N¯ and sN¯ the parameters µ and σ can be calculated by following equations [65]:
µ=ln⎛
⎜
⎝
N¯2
√
s2N¯ +N¯2
⎞
⎟
⎠
(2.9)
σ2 =ln( s2N¯
N¯2 +1). (2.10)
The parameters N¯ and sN¯ were determined experimentally [65] under dierent source conditions. For a given stagnation pressure p0 the mean droplet size N¯ can be calculated in relation to the nozzle temperatureT0. In Fig. 2.5 the mean droplet size (left ordinate) and the corresponding droplet radius (right ordinate) are plotted as function of the nozzle temperature for a stagnation pressure of p0=20bar. The radius was computed by the equationr=r0⋅
√3
N¯ under the assumption of spherical droplets consisting ofN¯ helium atoms [11]. The van der Waals radiusrvdW=220 pm of a free helium atom was suggested for r0. It shows that the mean droplet size of
2.2 Superuid Helium Nano Droplets 19
Fig. 2.5: Mean number N¯ helium atoms and the calculated mean radius r¯of a droplet dependent on the source temperatureT0 for a stagnation pressure p0 of 20 bar, based on the experimental data obtained by B. Schilling [65].
the helium beam can be varied between 103 and 104 atoms by choosing the nozzle temperature accordingly. For super-critical expansion the huge droplet size does not allow for measurable deection by momentum transfer from a secondary molecular beam. Instead a deection of charged helium droplets by an external electric eld could be analyzed in various scattering experiments [69, 70]. In these experiments an exponential function with negative exponent was found for the size distribution [70]:
PN = 1
N¯ ⋅exp(−
N
N¯). (2.11)
With this equation it was possible to determine the mean droplet size for the super- critical helium expansion. The nozzle temperature dependence of the average droplet size as determined experimentally for various stagnation pressures is plotted in Fig.
Fig. 2.6: A comparison of the mean droplet sizeN¯ and radiusr¯for sub-critical and super- critical helium formation [4]. Sub-critical expansion leads to signicantly smaller clusters.
2.6. Recently, these results were conrmed by experiments measuring the attenu- ation of the droplet beam through collisions with argon and helium gases at room temperature [73]. It was reported that the average droplet size was identied by the attenuation of a continuous helium droplet beam through collisions with argon and helium at room temperature. By the Rayleigh breakup of the liquid of helium jets [74] the generation of micron-sized droplets (N ≥ 109 atoms) is possible. In this case a liquid jet is induced to fragment into a sequence of large monodisperse droplets by Rayleigh oscillations.
The discussed values of the mean droplet size distribution were only valid for the continuous ow helium beam. The droplet size distribution of a pulsed droplet beam was carefully examined for an Even Lavie type pulsed valve modied for the gen- eration of helium droplets [76] by means of Rayleigh scattering and laser-induced
2.2 Superuid Helium Nano Droplets 21
Fig. 2.7: Calculated time evolution of the atom number and temperature of a 3He and a4He droplet containing 1000 atoms and an initial excitation energy of 1000 K taken from [75].
uorescence [77]. These results clearly indicate a bimodal droplet size distribution with the smaller fraction in the leading part and very large droplets in the second half of the gas pulse. Upon doping via the pick-up procedure only the leading part with the smaller droplets could be loaded while the back section never revealed a contribution to the laser-induced uorescence of the dopant. It could be estimated that a size distribution of the smaller helium clusters has to be signicantly narrower than a log-normal distribution at an average size which can be varied between 104 and 106 helium atoms.
Figure 2.7 shows the calculated decrease of a helium droplet (upper pattern) and of
the droplet temperature (lower pattern) during the thermalization of the droplet for both isomers, 3He and 4He [75]. It shows that 4He reaches its nal temperature in a time scale of nano seconds (10−8 to 10−7 s [11]). Every single evaporating helium atom is able to cool the droplet by approx. 4 cm−1 to 5 cm−1 (≈7K) [8, 78, 79]. 4He reaches its steady state faster than 3He. This can be attributed to the higher zero point energy of 3He and thus, to a lower binding energy (Eb =2.7K) [4]. Although
3He droplets reach lower temperatures than 4He, they do not cool below the corre- sponding Tλ (3 mK) and therefore do not reach their superuid state. The cooling process of any particles inside superuid helium droplets is accomplished by a very fast dissipation (in the time scale of at least nano seconds [55]) of excess energy (translation, vibrational or rotational energy) into the helium droplet body followed by evaporative cooling. Thus, the cryogenic capability of helium droplets applied to the internal degrees of freedom of foreign particles exceed the corresponding capa- bility of supersonic jet expansion or matrix isolation signicantly.
2.2.2 Doping - Pick-up Process
The droplets are doped by a pick-up technique. The helium droplet beam passes a pick-up cell which is lled with a dopant species at a well dened vapor pressure.
On its way through the cell, single particles (molecules or atoms) can be captured by the droplets due to inelastic collisions. This method has previously been applied to attaching for example SF6 molecules to the surface of solid Arn clusters [80]. Since the mass of the helium droplets exceeds the mass of the dopant, the deection of the helium droplets due to the inelastic collisions with the particles is negligible.
The pick-up process is dependent on the path length l of the droplets through the pick-up cell and the vapor pressure ps and thus, the gas phase particle densityns of the sample inside the cell. This density is essential to control the average number of molecules doped into the helium droplets. Two constraints have to be considered when simulating the pick-up procedure by Poisson statistics [55, 65]. First, the real droplet size distribution is replaced by the value of the average droplet size and,
2.2 Superuid Helium Nano Droplets 23 secondly, the eect of evaporative cooling upon the pick-up of every single dopant particle is neglected by using a constant value for the capture cross section. Under these constraints the relation between particle density ns of the substance and the number k of doped molecules inside one single helium cluster can be calculated by the poisson distribution shown in equation 2.12 [55, 65, 81].
Pk(l) = (σcap⋅ns⋅l)k
k! ⋅exp(−σcap⋅ns⋅l). (2.12)
In the equation 2.12Pk(l) represents the probability of a droplet to capture k mol- ecules crossing the distance l. Here ns is the particle density of the probe in the cell andσcap the scattering cross section of the droplets5. For l equal to the length L of the cell, Pk(L) represents the probability that the droplets are doped with k dopants after the pick-up cell. The cross sectionσcap is estimated to be equal to the geometric cross section of the helium droplets [4]. Thus, it can be calculated by the equation 2.13 [65].
σcap(N) =σ0⋅N23 (2.13)
with
σ0 = (3 4
√πm ρ)
2 3
. (2.14)
In this equation ρ is equal to the density of the cluster and m is the mass of a helium atom. In case of liquid heliumσcap equals to15.4Å2⋅N2/3 [65]. By changing the particle density ns inside the pick-up cell, not only the mean number of k but also the relative probability of droplets doped with a certain number of k dopant particles can be controlled. As a rule of thumb, the partial pressure of the dopant species in the pick-up cell for single particle doping is in the range from 10−5 to 10−6 mbar [4]. For many substances this range of the partial pressure is reached at
5Because of the much higher cross section of the helium droplets in the order of nm2, the cross section of the dopant can be neglected.
Fig. 2.8: Probability for a single droplet to pick up k dopants while crossing the pick-up cell of the dimensionLand the particle densityσcap. The curves were calculated with the equation 2.12. The maxima of each function, shifted by k⋅σcap⋅ns⋅L, are marked by the red dotted lines.
modest temperatures which is fortunate for the class of biomolecules which decom- pose or denaturate at higher temperatures. Moreover, only negligible amounts of the dopant species are needed compared to a supersonic jet experiment. Finally, the partial pressure needed for single particle doping can be further reduced by extend- ing the length Lof the droplet beam path through the pick-up cell. As a plot of the Poisson curves as a function of the partial pressure or particle density reveals, the result of the passage of the droplets through the pick-up cell ends with a distribution of the numberk of incorporated particles. This can be seen in gure 2.8 which illus- trates the Poisson distribution given in equation 2.12 as a function of the product of the cross section σcap, the particle density ns and the length L of the pick-up cell. At the value of σcap⋅ns⋅L=1, for example, one obtains P0(L) =P1(L) =0.37, P2(L) = 0.18, P3(L) = 0.06 and P4(L) =0.01. As a result, 37 % of all droplets re-
2.2 Superuid Helium Nano Droplets 25 main empty and 25 % carry more than one dopant species. The chemical potential between the dopant and the helium traps the molecule inside the droplet. As men- tioned above the energy (internal and kinetic) of the captured particles dissipates into the helium droplets. This energy intake reactivates evaporative cooling so that an energy of approximately 7 K per 4He atom is released [8]. Thus, an energy of 1 eV causes the loss of approximately 1600 helium atoms [4]. The pick-up of a sin- gle SF6 molecule provided under conditions as applied in Ref. [55], for example, is responsible for a loss of about 600 helium atoms [55]. This process denes a mini- mum size for droplets to be used for single particle doping. One kind of evaporation spectroscopy, which relies on the complete evaporation of the droplets following the excitation of the dissolved molecule and the subsequent detection of the remaining unsolvated molecule by mass spectrometry, demonstrated for benzene, showed that it is considerably more sensitive than the standard beam depletion method [82].
For multiple particle doping the binding energy released by complexation inside the droplet has also to be considered in addition to the cooling of each individual parti- cle. Upon multiple particle doping, clusters are formed inside the droplets because of the free mobility and the attractive, long-range intermolecular forces inside which exceed those from the dopant to the helium environment. Whether one nds clusters surrounded by a solvation layer or with a cluster consisting of molecules individually surrounded by a solvation layer is subject of ongoing research on microsolvation in helium droplets. Another interesting point in the interaction between helium and dopant is worth mentioning. There are two types of dopants, namely heliophobic and heliophilic particles [3, 83]. For the rst case, which includes the alkali metals and most of the alkali earth metals, the species remains on the surface of the helium droplets, whereas for the latter one, which includes almost all other elements as well as molecules, the species resides inside the helium droplets. The molecules examined in this work qualify for heliophilic behavior and thus, it can be assumed that they are located inside the droplets.
2.3 Electronic Spectroscopy inside Helium Droplets
2.3.1 Laser-Induced Fluorescence Spectroscopy
Since the dopant to helium interaction is of electrostatic origin, the electronic struc- ture and thus, the valence electrons of the dopant play a key role in the corresponding spectroscopy. Because of that, the electronic degree of freedom of the dopant is of major importance beside vibration and rotation. Due to a comparison of an energy scheme of two electronic states occurring in the gas phase and the energy diagram of these two states in helium droplets, some special eects in the spectroscopic be- havior inside helium can be recognized. In gure 2.9 two dierent electronic states, the ground stateS0 and the rst excited one (S1) of a molecule in the gas phase (left side), are contrasted with the same system when doped into a helium droplet (right side). For the following discussion vibronic or rotational states are neglected. Inside helium droplets both electronic states of a heliophilic dopant species are stabilized, which means exhibiting a reduced energy compared to the gas phase condition. This leads to a change in the transition frequency of the purely electronic transition, the so-called 000-transition which starts in the vibronic ground state (v′′=0) of S0 into v′ =0 of the excited state S1. This transition is called zero phonon line (ZPL, see chapter 2.3.2). Depending on which electronic state is aected more strongly by the helium atoms, the ZPL can be shifted to the red as well as to the blue6 and is found to be in the order of±1 %of the000-transition frequency in the gas phase experiment.
This value is much smaller than the typical shift found in other rare gas matrices.
In addition to pure molecular transitions, which also include vibronic transitions (sometimes even with rotational resolution), electronic spectra show phonon wings
6Red-shifted transitions, characteristic for large organic molecules attached to rare gases [84]
appear at a lower frequency, blue-shifted ones at a higher frequency.
2.3 Electronic Spectroscopy inside Helium Droplets 27
Fig. 2.9: Comparison of an electronic transition between two statesS1 and S0 of an or- ganic chromophore inside a matrix in contrast to the gas phase [85].
(see chapter 2.3.3) which constitute excitations of the helium environment coupled to the molecular transition. As a result of the low temperature of the superuid he- lium droplets phonons are frozen out [86]. Therefore, in excitation the PW appears exclusively on the blue side of the corresponding ZPL. The gap between the ZPL and the rst intense peak of the accompanying PW is about 6−1 (8 K) [87]. This value corresponds to the energy for elementary excitations of superuid helium and relates directly to the energy of the roton excitation in bulk liquid helium [4].
2.3.2 Zero Phonon Line
Depending on which electronic state is aected more strongly by the helium atoms, the ZPL can be shifted toward the red or toward the blue compared to the gas phase transition frequency. As it is well known from cluster spectroscopy, the solvent shift increases with the number of attached solvent species in the present case helium atoms. Finally, the solvent shift converges to a maximum value which is reached for droplets at a size where the dopant does not recognize the nite size of the droplet anymore. Inside helium droplets this shift is usually in the order of ±1 %of the 000-transition frequency found in the gas phase measurement [3] and hence, its value is at least an order of magnitude smaller than shifts observed in solid rare gas matrices. Many substances examined so far in helium droplets show extremely sharp zero phonon lines with a line width below 1 cm−1. In general, the inhomogeneous line broadening caused mostly by the droplet size distribution appears to be less dominant compared to other solid rare gas matrixes. The observation of rather small inhomogeneity in combination with small solvent shifts reects what is expected from an ideal and extremely gentle host system. Compared to other rare gas matrices with a line broadening of hundreds of wavenumbers the corresponding eect in helium droplets is negligible. For some molecules e.g. pentacene or phthalocyanine [88]
only one peak can be found in the ZPL. In contrast, other chromophores such as anthracene [77], indole [89], tetracene [9092], magnesium- and zincphthalocyanine [93] or phorphine and TPC7 [94] show multiplet splitting of the ZPL. The reason for this splitting is still controversially discussed and has not been solved. One possible explanation could be the existence of dierent conformations of the helium solvation layer consisting of helium atoms localized on the surface of the dopant molecule.
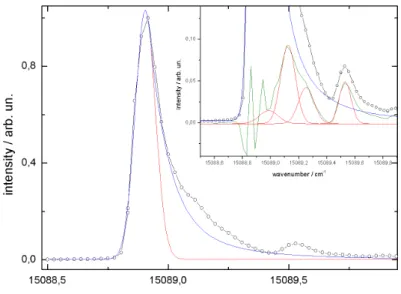
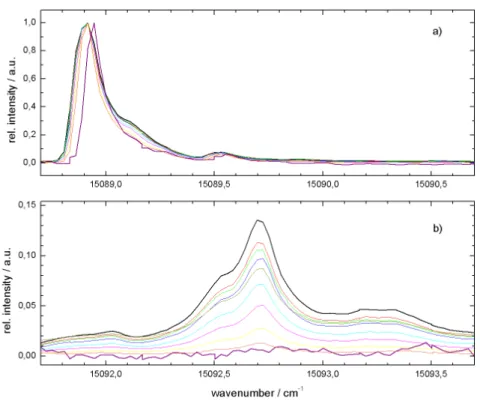
Finally, there are some interesting results with respect to the examination of the line shape and frequency of the ZPL of phthalocyanine inside helium droplets [13, 95].
It could be shown that the inhomogeneously broadened asymmetric line shape of the electronic origin of Pc reects the droplet size distribution quantitatively (cf.
7Tetraphenylchlorine
2.3 Electronic Spectroscopy inside Helium Droplets 29
Fig. 2.10: LIF spectrum of phthalocyanine in helium droplets recorded for dierent ex- pansion conditions. Top panel: continuous source at 20 bar and 11 K. Pulsed source at 80 bar and 25 K. Bottom panel: continuous source at 20 bar and 9.5 K. Pulsed source at 80 bar and 15 K.ν0=15088.92cm−1 [76].
gure 2.10 top panel). This is coherent to the excluded volume model which predicts the solvent shifts induced by a polarizable environment [84]. According to [13, 95]
the maximum of the band can be shifted slightly by the experimental conditions.
The model presented in Ref. [13] calculates the line shape of the dopant species by considering the actual droplet size distribution and the corresponding probability for single molecule doping. Vice versa, this model can be applied to extract the droplet size distribution from the particular line shape of the electronic origin of Pc in helium droplets. Under super-critical conditions (more than 105 atoms per droplet) the inhomogeneity has vanished entirely and the envelope of a rotational ne structure can be resolved for the Pc molecule (cf. dotted line in the lower panel of gure 2.10). These observations reect the approach to the bulk limit (> 106 helium atoms) [76, 77]. Surprisingly, these experiments revealed another eect to the transition frequency of the ZPL. Whereas there is a continuous rising red shift, already predicted by the excluded volume model for huge clusters>105 atoms [84],
the red shift reaches a maximum at a certain average droplet size and for a further increasing droplet size it starts to decrease. Figure 2.10 shows the maximal red shift (top panel) as well as the slightly blue-shifted signals (bottom panel) measured in the pulsed as well as in the continuous helium beam. Up to now there is no explanation of this turn around the solvent shift which was also reported for tetrazene [92, 96].
2.3.3 Phonon Wing
In addition to the ZPL most molecules also show the blue-shifted phonon wing in electronic spectra. This phenomenon, which originates from excitation of the helium environment coupled to molecular excitations, exhibits a dierent saturation behavior than the corresponding ZPL. At low laser uence (≈1µJ per 10 ns pulse) the ratio of the ZPL and PW intensities is typically found to be less than 0.1 [4]. In general, the intensity of the PW rises linearly with the intensity of the laser, whereas the intensity of the ZPL can already be saturated. Consequently, by choosing an appropriate laser intensity, electronic spectra of molecules in helium droplets can be measured with or without the PW. The rst electronic spectrum was published in 1996 [62] and can be found in gure 2.11. In this experiment the electronic origin of glyoxal in helium droplets was recorded. The upper panel shows the spectrum recorded in 4He, the lower panel recorded in 3He. In both spectra a sharp ZPL at dierent transition frequencies can be found and only the ZPL in the upper panel reveals rotational splitting. Both ZPL are followed by a broad, blue-shifted signal which can be identied as the PW. In case of the PW recorded in 4He there is a gap of about 5 cm−1 between ZPL and PW. The spectral structure of the PW could be simulated by using the density of states of the phonons convoluted with a Lorentzian function (thin line, top panel). In contrast, the PW accompanying the ZPL of glyoxal in 3He reects what is expected from a normal uid at a temperature way above the corresponding λ-point. The density of states of 4He could be determined from neutron scattering experiments [63, 64]. The agreement of experimental result and simulation provides strong evidence for the superuidity of4He droplets. Up to now,
2.3 Electronic Spectroscopy inside Helium Droplets 31
Fig. 2.11: Electronic spectra of glyoxal recorded in 4He (a) and in 3He (b) [97]: The thin line in the upper spectrum shows the simulation of the phonon wing by Hartmann [62].
glyoxal is the only example showing a PW with the spectral shape of the density of states of elementary excitations of superuid helium. For other dopant species all the characteristic quantities such as phonon gap, maxon and roton maxima are found to be strongly modied or even entirely absent. The spectral shape of the numerous PW reported so far include rich ne structures with line widths identical to the ZPL and / or entirely unstructured signals of some broad undulations extending over several 100 cm−1 [94, 98101]. Up to now these results are not explained comprehensively.
There is no theory for quantitative simulation of any PW, not even for that of glyoxal.
The simulation presented in Fig. 2.11 given in Ref. [62] was carried out without the glyoxal dopant. Instead, most authors refer to the generally accepted model of a helium solvation complex where the non-superuid helium solvation layer on the surface covering the dopant molecule warrants for any spectral shape of a PW. This
solvation layer may exhibit van der Waals modes coupled to the electronic excitation of the dopant molecule which may appear as sharp lines and have to be counted to the PW of the helium environment [88]. There are some computer simulations for individual PW giving an indication of the validity of this theory, but it has never been extended to a model for predicting the PW of a certain class or even any dopant species [14, 15, 102, 103].
2.4 Emission Spectroscopy inside Superuid Helium Droplets
The radiative decay of vibronically excited organic closed shell molecules in helium droplets is preceeded by the dissipation of that part of the excitation energy which exceeds the pure electronic excitation to S1. Thus, radiation originates exclusively from the ground level of the S1 state. Similar to the ZPL and PW in the exci- tation spectra, dispersed emission spectra may also show a ZPL accompanied by a PW now on the red side [104]. Since dispersed emission relies on spontaneous emission in contrast to the stimulated one, neither the ZPL nor the PW are ever saturated. They show the natural relation of the transition probability as function of the frequency. In our laboratory, the line widths of the sharp ZPL transitions in the emission spectra are limited by the apparatus function.
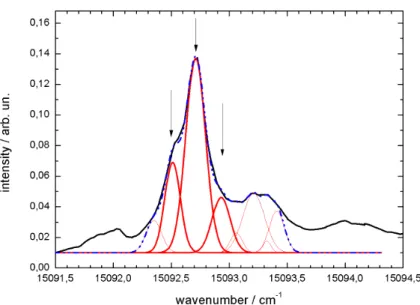
Only dispersed emission spectra revealed a doubling eect of the entire emis- sion spectrum of Pc which could be explained by the presence of two variants of a Pc-helium solvation complex. After excitation two independent, dispersed emis- sion spectra, the rst emission spectrum (FES) and the second emission spectrum (SES), were found shifted by 10.2 cm−1 with respect to each other [105107]. The two spectra exhibit identical vibrational ne structures and identical Franck-Condon factors. The intensity ratio of both spectra can be varied by the amount of excess excitation energy put into the dopant molecule. With increasing excitation energy the red-shifted emission increases on expense of the blue one. The experimental
2.4 Emission Spectroscopy inside Superuid Helium Droplets 33
Fig. 2.12: Chart explaining the second emission spectrum which can be assigned to or- ganic molecules i.e. phthalocyanines [104]. It shows the electronic ground stateS0 and the rst excited oneS1, each of them with two energetic minima.
They represent dierent arrangements of the helium atoms directly attached to the chromophore. The continuous arrow shows absorption, the dashed ar- rows give the two dierent emission spectra and the dotted arrow indicates the rearrangement of the solvation layer.
details recorded in the dispersed emission spectra of Pc could be explained by a model for the Pc-helium solvation complex which is depicted in Fig. 2.12. Starting in the exclusively populated global minimum conguration of the electronic ground state of the solvation complex, electronic excitation creates a metastable congura- tion which either decays radiatively or relaxes into a global minimum conguration prior to radiative decay. The latter decay path leads to a metastable conguration in the ground state which relaxes into the global minimum with a decay rate of roughly 0.2 MHz [99]. Mg-Pc and one particular van der Waals complex of phthalo- cyanine with one Ar atom show a similar splitting in the emission [86, 107]. These observations t to the same model used for explaining the doubling in the emission
of Pc in helium droplets [105]. Path integral Monte Carlo simulations revealed a metastable conguration in addition to the global minimum conguration of the helium solvation layer covering the Pc molecule in the electronic ground state. [15].
3 Experimental Setup and Methods
The setup of two dierent droplet beam apparatus will be summarized at the be- ginning of this chapter followed by a description of the laser system, detector units and measuring techniques which were used for the purpose of this study.
3.1 Construction of the Helium Droplet Apparatus
There are two dierent vaccum machines, one is capable of producing a continuous ow helium droplet beam, the other one is equipped with a pulsed valve generating a pulsed droplet beam.
3.1.1 Continuous Flow Helium Droplet Beam
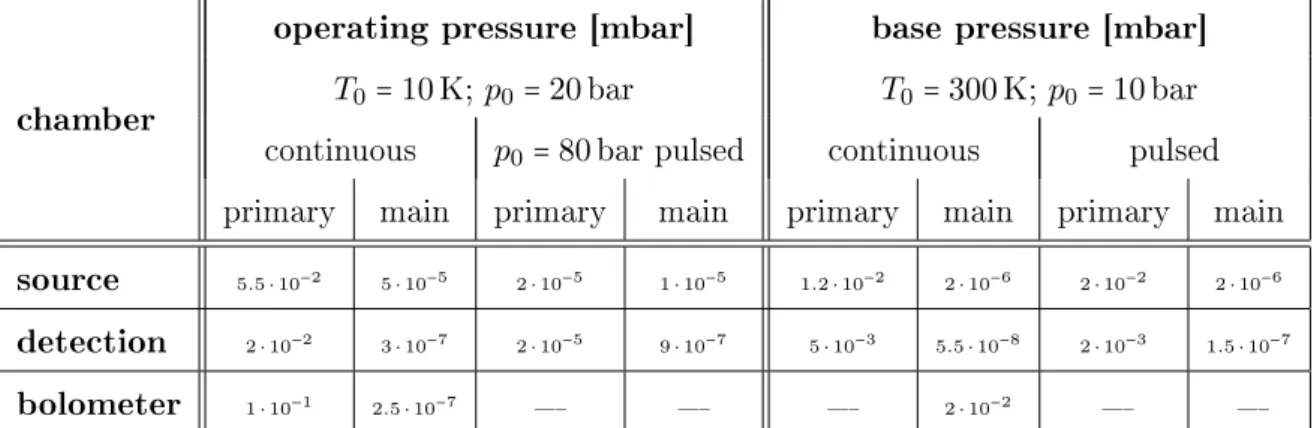
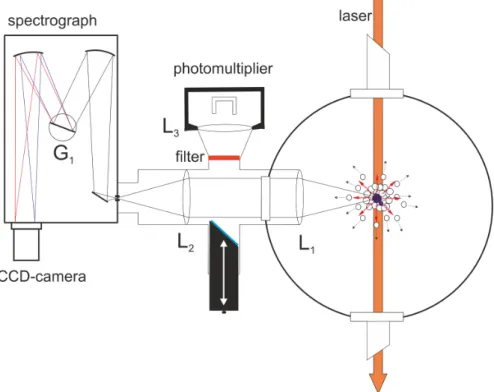
The basic setup of the apparatus used for the purpose of this study is in general equal to the apparatus described in [2, 108]. Figure 3.1 shows the continuous ow apparatus which is built up from three dierentially pumped vacuum chambers.
The rst one, the so-called source or nozzle chamber, is pumped by an oil diusion pump Leybold DI 6000 E with a pumping speed of 6000 sl which is supported by a combination of a mechanical two-stage oil-sealed rotary vane vacuum pump Leybold Trivac D65B (pumping speed: 65 mh3) connected to a roots blower Leybold Ruvac WAU 251 (pumping speed: 253 mh3). Inside this chamber the continuous ow nozzle consisting of a copper holder, a gold gasket and a platinum disk with a pinhole of
35
Fig. 3.1: Schematic setup of the continuous ow helium droplet apparatus used for the generation of the helium beam and the spectroscopic experiments.
5µm is located. This setup is equal to the nozzle described in [2, 38, 108]. The copper holder is attached to the cold head RDK-408 via a copper cylinder. The cold head is connected to the closed cycle cryostat FH-50Hw (both Sumitomo Heavy In- dustries). By shielding the copper adapter and the orice with an aluminium cover a contamination with pumping oil is prevented and thus, a plugging of the pinhole is obviated. The cryostat unit and therefore the nozzle can be shifted linearly in all three dimensions during operation. At the second stage of the cryostate (in a distance of about 2 cm) a temperature sensor (Pt100 (2 x 2 mm)) is xed to mea- sure the so-called nozzle temperature1 T0. 1.5 cm further away a heating resistor is in thermal contact with the copper adapter. It is mounted between the adapter and the copper cylinder. With this setup it is possible to tune the temperature T0 between 7 K and 30 K. The helium inlet tube which is connected to the orice is wound around the rst stage of the cold head to achieve an ecient pre-cooling
1The actual temperature of the Pt nozzle cannot be measured; thus, T0 means the measured value of the Pt100.
3.1 Construction of the Helium Droplet Apparatus 37 of the gaseous helium. The helium droplet beam is generated by the expansion of the precooled gaseous helium through the nozzle into the vacuum inside the rst chamber (see chapter 2.2.1). For this purpose a high purity of the helium is re- quired (helium 6.0, purity 99.9999 %, Linde AG). Thus, freezing-out of nitrogen or oxygen can be prevented and the contamination of the helium droplets by impu- rities can be avoided. Approximately 2 cm behind the nozzle the droplets have to pass a skimmer2 to access the second chamber. It provides better vacuum condi- tions in the second chamber and leads to a supersonic free jet of helium droplets propagating along a well-dened axis through the second chamber. This so-called detection chamber is pumped by a pumping unit composed of an oil diusion pump Distak 160 (pumping speed: 700 Ls) connected to a second mechanical oil-sealed rotary vane vacuum pump Edwards RV12 (pumping speed: 14.2 mh3). Above the oil pump a plane copper bae is positioned and linked to a reservoir lled up with liquid nitrogen to reduce the oil from the Distak 160 in the background gas of the detection chamber. About 2 cm behind the skimmer the droplet beam can be blocked by a mechanical shutter. Further 13 cm behind the skimmer the droplet beam enters the rst pick-up unit. The pick-up cell is designed for solid samples which sublimate into the gas phase controlled by temperature tuning. According to the requirements two dierent cells can be implemented. The rst one, an oven, can be heated resistively up to 400°C for the thermal sublimation of the substance. The substance is provided as a pellet and placed at a removable top cover of the oven which is the coldest point of the cell. The second pick-up cell, a cryo cell, can be cooled down to -100°C to reduce the vapor pressure of the substance inside the cell.
Both are made of a stainless steel hollow cylinder, which has got two opposite aper- tures with a diameter of 4 mm. Inside the chamber the pick-up cell is surrounded by a cylindrical copper shield, which also has got two opposite apertures. It functions as a cooling trap for background gas, especially water and any other molecule inside the detection chamber. Therefore this shield is in thermal contact with a reservoir
2Conical component containing an aperture with a diameter of 0.7 mm.
![Fig. 2.1: Plot of the ratio of normal uid and superuid helium in He II below T λ (left side) and the specic heat capacity c V of 4 He between 1 K ≤ T ≤ 3 K (right side), both taken from [22].](https://thumb-eu.123doks.com/thumbv2/1library_info/5555677.1689180/13.892.155.805.105.416/plot-ratio-normal-superuid-helium-specic-capacity-right.webp)
![Fig. 2.7: Calculated time evolution of the atom number and temperature of a 3 He and a 4 He droplet containing 1000 atoms and an initial excitation energy of 1000 K taken from [75].](https://thumb-eu.123doks.com/thumbv2/1library_info/5555677.1689180/27.892.243.691.104.638/calculated-evolution-number-temperature-droplet-containing-initial-excitation.webp)
![Fig. 3.5: Schematic circuit diagram of the LN6-C #3266 preamplier [109] and the dewar internal components.](https://thumb-eu.123doks.com/thumbv2/1library_info/5555677.1689180/52.892.188.711.107.443/fig-schematic-circuit-diagram-preamplier-dewar-internal-components.webp)
![Tab. 3.3: Coecients A , B and C of 4 He in the equation 3.1 according to ITS-90 [110].](https://thumb-eu.123doks.com/thumbv2/1library_info/5555677.1689180/55.892.226.716.281.535/tab-coecients-b-c-equation-according.webp)
![Fig. 4.2: LIF spectrum of phthalocyanine embedded inside superuid helium droplets (mean droplet size N¯ ≈ 20000) [86].](https://thumb-eu.123doks.com/thumbv2/1library_info/5555677.1689180/67.892.155.771.97.380/spectrum-phthalocyanine-embedded-inside-superuid-helium-droplets-droplet.webp)