Research Collection
Doctoral Thesis
Stochastic sources of uncertainty in urban energy systems:
occupancy and microclimate
Author(s):
Mosteiro Romero, Martín Publication Date:
2020
Permanent Link:
https://doi.org/10.3929/ethz-b-000438893
Rights / License:
In Copyright - Non-Commercial Use Permitted
This page was generated automatically upon download from the ETH Zurich Research Collection. For more information please consult the Terms of use.
ETH Library
E N E R G Y S Y S T E M S : O C C U PA N C Y A N D M I C R O C L I M AT E
S T O C H A S T I C S O U R C E S O F U N C E R TA I N T Y I N U R B A N E N E R G Y S Y S T E M S : O C C U PA N C Y A N D
M I C R O C L I M AT E
A dissertation submitted to attain the degree of doctor of sciences of eth zurich
(Dr. sc. ETH Zurich)
presented by
martín mosteiro romero MSc. ETH Zürich
born on 12 December 1987 citizen of Argentina and Spain
accepted on the recommendation of Prof. Dr. A. Schlueter, examiner
Dr. J. Kämpf, co-examiner
2020
doi:10.3929/ethz-b-000438893
Urban building energy modeling (UBEM) can be a powerful tool to assess the current and projected demands of urban areas in order to support the planning of interventions at a variety of scales, such as building retrofits, urban form modifications and district energy system implementation. One of the main obstacles currently faced by the UBEM field is the increasing uncertainty in model inputs as the scope of analysis is expanded from the building to the district scale. There are two main types of uncertainty in UBEM. Epistemic uncertainty arises as a result of lack of knowledge about specific input parameters such as the thermal properties of the building envelope, whereas stochastic uncertainty is caused by the inherently random nature of parts of the system under analysis. With the increased availability of sensor data in cities, the contribution of epistemic uncertainty will continue to be reduced. Stochastic uncertainty, on the other hand, can be better characterized but not reduced by measurement campaigns. Thus, methods to analyze and quantify the role of stochastic sources of uncertainty on the urban scale need to be developed.
This thesis aims to answer the overarching research questionswhichare the main sources of uncertainty at this scale,howcan these be accounted for in UBEM, andto what extentdo these sources of uncertainty affect the planning of urban energy systems. In order to answer these research ques- tions, a framework was developed to investigate two of the main sources of stochastic uncertainty, namely building occupants and urban microcli- mate, at the district scale. The methods developed were implemented in the UBEM City Energy Analyst (CEA) and tested in a case study in central Zurich, Switzerland.
In order to put the influence of these stochastic sources of uncertainty into perspective, a preliminary sensitivity analysis of the CEA energy demand model was carried out, which revealed the biggest sources of epistemic uncertainty in the model. The most influential parameters were found to be the cooling set-point temperature, the infiltration rate and the thermal properties of the building envelope. The uncertainty arising from these parameters was subsequently compared to the deviations caused by the choice of occupancy model, which were comparatively much smaller. Model calibration thus continues to be a crucial first step in order to minimize uncertainty in the predicted demands of buildings.
vii
model was compared to established deterministic and stochastic methods found in the literature to provide insight into the effects of occupants on the energy demands of different building functions at various temporal scales. The peak occupancy of the district appeared to be overpredicted by up to33% for the standard-based methods. The normalized mean abso- lute deviation between the demands for space heating, space cooling and electricity for lighting and appliances predicted by each model was used as a metric for comparison. These deviations were relatively small on a yearly basis, however on an hourly timescale they approached20% for the demands for electricity and cooling. Hence, standard assumptions proved to be particularly inappropriate for supply system sizing, which requires a detailed assessment of demand peaks throughout the year. Furthermore, the deviation between the stochastic and the deterministic methods was smaller than their deviation with respect to the population-based approach. These results confirm previous findings that pointed to the relative importance of using accurate input data over merely randomizing occupant schedules.
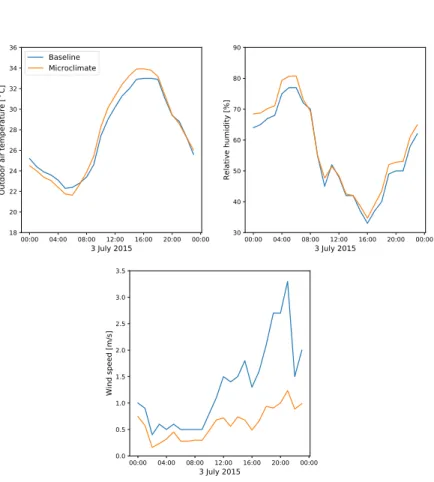
Furthermore, an integration method was developed to couple CEA with a state-of-the-art climate microsimulation tool to assess the effects of urban climate during extreme weather events. The coupling method involved passing hourly results of outdoor air temperature, wind speed and relative humidity around each individual building to the energy demand simulation.
The analysis was carried out during a hot summer day during a heat wave in order to analyze the effects on the space cooling demand during extreme weather events. The results showed that the consideration of local climate led to a5% increase in the cooling demand on this day, as well as an8%
increase in the peak cooling power in the district. While the cooling demand was dominated by sensible cooling, the increase was mainly caused by an increase in the latent cooling demands in the microclimate case.
Having quantified the effects on demand, the implication of these sources of uncertainty on the planning of energy systems was further analyzed.
The sizing and economic feasibility of centralized and decentralized tech- nologies to provide heating, cooling and electricity was analyzed under different development scenarios, occupancy modeling approaches and cli- matic boundary conditions. The choice of occupant modeling approach was found to affect the costs of space heating and cooling by±5%, whereas for the costs of electricity the variation was ±8%. The main driver for these variations was however not the dynamics of demand, but rather the overall viii
even more realistic depictions of the demands in the area, and hence of the cost of supplying them. The effects of urban climate on system sizing were studied through the use of measured air temperature data from a sensor in a building in the district. The effects on the heating demands proved be largely negligible, however the cooling loads and in particular the cooling demand peaks for individual buildings were strongly affected. While the costs of the cooling alternatives were found to vary by about4% at the district scale due to the effect of urban climate, for individual buildings this deviation was as high as40%.
Given that the choice of occupancy model was found to have an effect large enough to affect the choice of energy systems at the district scale, an increasingly detailed analysis of building occupants at the district scale appears to be justified. By using new data sources in urban building energy demand models coupled with mobility simulations, we expect the approach presented here could represent a variety of users and their displacements throughout districts. From a climatic perspective, however, the computa- tional expense of the modeling endeavor appears to make the application of urban microclimate simulations in the planning of district energy systems infeasible at the time of publication. In the absence of measured weather data, thus, the use of simplified mesocale models as found in the urban energy modeling literature appears to be an appropriate compromise for the planning of district energy systems given the current computational limitations.
ix
Urbane Gebäudeenergiemodellierung (Urban Building Energy Modeling, UBEM) kann ein wirkungsvolles Werkzeug sein, um den heutigen und den zukünftigen Energiebedarf von Stadtgebieten zu analysieren. Durch den Einsatz von UBEM kann die Planung von energetischen Massnahmen wie Gebäudesanierungen, Änderungen zur Stadtgestaltung und die Imple- mentierung von städtischen Energiesystemen unterstützt werden. Eine der grössten Schwierigkeiten bei der Anwendung von UBEM ist die zunehmen- de Unsicherheit bei der Dateneingabe, wenn der Umfang der Analyse von einzelnen Gebäuden zu Stadtquartieren erweitert wird. Die Unsicherhei- ten in UBEM können in zwei Kategorien eingeteilt werden. Epistemische Unsicherheit entsteht aus mangelnden Informationen zu gewissen Eingabe- parametern des Modelles, wie zum Beispiel die thermischen Eigenschaften der Gebäudehülle, während stochastische Unsicherheitsquellen von der zu- fälligen Natur der Komponenten des zu analysierenden Systems verursacht werden. Durch die zunehmende Verfügbarkeit von Sensordaten in Städten wird der Anteil der epistemischen Unsicherheiten immer niedriger. Im Gegensatz dazu können stochastische Unsicherheiten durch Messkampa- gnen besser verstanden werden, sie werden dadurch aber nicht vermindert.
Aus diesen Gründen sind Methoden nötig, um die Einflüsse stochastischer Unsicherheitsquellen in UBEM zu analysieren und quantifizieren.
Das Hauptziel dieser Dissertation ist, die folgenden Forschungsfragen zu beantworten:Wassind die wichtigsten Unsicherheitsquellen auf städti- scher Ebene,wiekönnen UBEM diese Unsicherheiten berücksichtigen, und inwieweitbeeinflussen diese Unsicherheiten die Planung von städtischen Energiesystemen? Zu diesem Zweck wurde ein Forschungsprogramm ent- wickelt, um die zwei wichtigsten Quellen der stochastischen Unsicherheit auf städtischer Ebene zu untersuchen, nämlich das Verhalten von Gebäu- denutzern und das städtische Mikroklima. Die entwickelten Methoden wurden im UBEM City Energy Analyst (CEA) implementiert und in einer Fallstudie in Zürich getestet.
Als erster Schritt wurden die epistemischen Unsicherheitsquellen von CEA durch eine Sensitivitätsanalyse quantifiziert, um sie als Vergleichsgrös- sen für den Einfluss der stochastischen Unsicherheitsquellen zu benutzen.
Der Temperatursollwert für die Kühlung, die Infiltrationsrate und die ther- mischen Eigenschaften der Gebäudehülle wurden als wichtigste Parameter xi
denen Gebäudebelegungsmodelle verglichen. Wegen der relativ kleineren Einflüsse der Gebäudenutzer auf den jährlichen Wärme- und Kältebedarf der Gebäude wird die Kalibrierung von Energiemodellen weiterhin ein wesentlicher erster Schritt der Energiebedarfsprognosen von Stadtgebieten sein.
Die Analyse der verfügbaren Gebäudebelegungsmodelle führte zur Ent- wicklung vom Population-based Approach(PopAp), ein neuartiger Ansatz zur Modellierung von Gebäudenutzern inspiriert von agentenbasierten Verkehrssimulationen. Diese Methode wurde mit zwei üblichen Ansätzen aus der Literatur verglichen. Die Gegenüberstellung der drei Gebäudebele- gungsmodelle gab einen Einblick auf die Einflüsse von Gebäudenutzern auf den Energiebedarf verschiedener Gebäudenutzungstypen auf verschie- denen zeitlichen Skalen. Die Spitzenbelegung der auf Standards basierten Ansätze war bis zu33% höher als die Ergebnisse der auf lokalen Daten basierten PopAp-Methode. Die normalisierte mittlere absolute Abweichung des Wärme-, Kälte- und Strombedarfs gemäss jedem Simulationsverfahren wurde als Messgrösse zum Vergleich verwendet. Bei jährlicher Auflösung waren die Abweichungen relativ klein. Aber bei stündlicher Auflösung näherten sich die Abweichungen des Bedarfs an Kühlung und Strom für Beleuchtung und Geräte20% an. Daraus wurde abgeleitet, dass die auf Standards basierten Gebäudebelegungsmodelle für die Dimensionierung von Versorgungssystemen besonders ungeeignet sind, da dies eine detail- lierte Prognose des stündlichen Energiebedarfs benötigt. Die Ergebnisse bestätigten auch, dass die Verwendung genauerer Eingangsdaten in den Energieprognosen wichtiger sind als der Einsatz von stochastischen Simu- lationsmethoden, was bereits in der Literatur aufgezeigt werden konnte.
Des Weiteren wurde ein Integrationsverfahren zur Kopplung von CEA mit einem Mikroklimasimulationstool entwickelt, um die Auswirkungen von extremen Wetterereignissen auf den Energiebedarf eines Quartiers zu untersuchen. Die Integrationsmethode bestand darin, dem Energiebe- darfsmodell stündliche Werte der Aussentemperatur, Windgeschwindigkeit und Luftfeuchtigkeit um jedes einzelne Gebäude zu übergeben. Um die Wirkungen des Mikroklimas auf den Kältebedarf während extremen Wette- rereignissen zu untersuchen wurde ein heisser Sommertag während einer Hitzewelle analysiert. Die Ergebnisse zeigten, dass die Berücksichtigung des lokalen Mikroklimas in einem5% höheren Kältebedarf an diesem Tag resultierten, während der Spitzenbedarf an diesem Tag8% war.
xii
giesystemen weiter analysiert. Die Dimensionierung und Wirtschaftlichkeit verschiedener zentraler und dezentraler Technologien zur Erzeugung des Heiz-, Kälte- und Strombedarfes des Quartiers unter der Annahme diver- ser Entwicklungsszenarien, verschiedener Gebäudebelegungsmodelle, und klimatischer Randbedingungen wurde analysiert. Die Wahl des Gebäudebe- legungsmodells beeinflusste die Heizungs- und Kühlungskosten um±5%, während die Variation der Stromkosten±8% war. Hauptgrund dieser Ab- weichungen waren aber nicht die Dynamik der Energienachfrage, sondern der Gesamtbedarf der Gebäude. Durch einen höheren Detaillierungsgrad der Aktivitäten der Gebäudenutzer (die hier nur “arbeiten” oder “lernen”
konnten) könnte eine realistischere Darstellung des Energiebedarfs der Fallstudie, und somit auch der Kosten, erreicht werden. Die Wirkungen des städtischen Klimas wurden durch Messdaten eines Temperatursensors im Areal analysiert. Der Heizbedarf änderte sich durch die Berücksichtigung des lokalen Klimas kaum, jedoch waren der Kältebedarf und besonders die Kältespitzen stark beeinflusst. Obwohl die Kosten der Fernkälte wegen der Wirkungen des Mikroklimas nur um4% variierten, wurden die Kosten für einzelne Gebäude der dezentralen Variante bis zu40% höher.
Angesichts dessen, dass die Wirkungen der Gebäudebelegungsmodelle gross genug sein könnten, um die Wahl zwischen einer zentralen oder dezentralen Wärmeerzeugung im Quartier zu beeinflussen, wird eine de- tailliertere Analyse der Gebäudenutzer in Stadtquartieren als sinnvoll einge- schätzt. Durch die Nutzung neuer Datenquellen für UBEMs und die Kopp- lung mit Transportmodellen erwarten wir, dass unser Ansatz eine Vielzahl verschiedener Nutzer und deren ortsbezogene Aktivitäten repräsentieren könnte. Wegen des hohen Berechnungsaufwandes der Mikroklimasimula- tionen wird deren Einsatz in der Planung von städtischen Energiesystemen zurzeit als nicht praktikabel beurteilt. Mangels Messdaten aus Wetterstatio- nen in Quartieren scheint zurzeit die Nutzung vereinfachter Modelle auf der Mesoskala (wie sie in der Literatur zu finden sind) ein angemessener Kompromiss zwischen Genauigkeit und Berechnungsaufwand.
xiii
I would like to thank Prof. Arno Schlüter for giving me the opportunity to join the Architecture and Building Systems team as well as for helping guide the research I am presenting in this thesis. I would furthermore like to thank Dr. Jérôme Kämpf for being my co-examiner, as well as for our friendly, fruitful discussions about my research. I would also like to extend my gratitude to Dr. Illias Hischier, who as senior researcher provided guidance and many productive discussions.
My warmest thanks go to the CEA team, both in Singapore and Zürich, past and present: Jimeno Fonseca, Gabriel Happle, Hsieh Shanshan, Fazel Khayatian, Reynold Mok, Shi Zhongming, Bhargava Krishna Sreepathi, and Daren Thomas. It was inspiring to work along such a dedicated group of talented researchers, as well as to share so many sprints and fun memories.
In theA/Sgroup, I was fortunate to be part of a fantastic team in Zürich with whom I shared insights, some frustrations, and many great moments over the past four years: Marco Baur, Moritz Begle, Krishna Bharathi, Chirag Deb, Amr Elesawy, Mario Frei, Valerie Gass, Uta Gelbke, Danielle Griego, Johannes Hofer, Prageeth Jayathissa, Balaji Kalluri, Gearóid Lydon, Clay- ton Miller, Zoltán Nagy, Peng Yuzhen, Adam Rysanek, Bharath Seshadri, Bratislav Svetozarevi´c, Christoph Waibel, Linus Walker, Wang Danhong, Anja Willmann, and Zhao Hu.
I would furthermore like to extend my gratitude to my collaborators in the SPACERGY project. To Daniela Maiullari, Prof. Marjolein Pijpers-van Esch and Prof. Arjan van Timmeren for hosting my stay at TU Delft and for our joint work presented in this thesis. Thank you also to Remco de Koning and Prof. Akkelies van Nes at HVL Bergen for hosting our workshops there and for our collaboration on the SPACERGY book. Finally, I would also like to thank Henrik Becker for providing the data from the transportation model used in the occupancy modeling approach presented in this thesis.
Teaching has been an interest of mine for many years, and I was happy to partake in teaching the Integrated Design Project from the Master’s in Integrated Building Systems. I would like to thank my students for their hard work and dedication, as well as inspiring final projects. I am particularly grateful to the masters’ students who contributed to work that directly or indirectly made it into this thesis: Fiona Collins, Mahshid Motie, Emanuel Riegelbauer, and Jakub Szcz ˛e´sniak.
xv
specialgrazieandПачибаto Matteo Facchini and Nick Drofiak, with whom I shared not only a passion for playing music, but also very fruitful, long coffee breaks at the beginning of my PhD where we discussed academia, life, and languages. I am also very thankful to my friend Diego Sandoval for fruitful conversations about our research field that helped me define my research topic in those early days.
I would also like to thank Lina Arboleda, with whom I had a number of insightful discussions that helped me pursue some of my goals in this project.
Last but certainly not least, I would like to thank my family. My par- ents, Miguel and Silvia, without whom I probably would have never even considered doing a PhD and whose encouragement and support helped keeping me motivated throughout. My brother, Pablo, a patient listener who provided lots of insight and advice on life and research. And to my wife, Nicole, whose love and support have accompanied me throughout this experience and helped me keep perspective.
Finally, as I write this, it is April 2020 and I am sitting home in self- isolation. There is a pandemic going on, and while as of now I am safe and sound, I cannot help but think of the many people who are suffering.
Therefore, I would also like to thank all the unsung heroes who are working to help the sick.
Gracias a todos.
xvi
1 introduction 1 1.1 Motivation 1
1.2 Problem statement 5
1.3 Research goals and methods 5 1.4 Context and Scope 6
1.5 Thesis organization 7
2 seasonal effects of input parameters in urban-scale building energy simulation 9
2.1 Introduction 10 2.2 Method 11 2.3 Results 13
2.4 Discussion and conclusion 16
3 a novel population-based occupancy modeling ap- proach for district-scale simulations compared to standard-based methods 19
3.1 Introduction 20
3.2 Materials and methods 28 3.3 Case study description 37 3.4 Results and discussion 39 3.5 Limitations 54
3.6 Conclusions 56 3.7 Outlook 57
4 an integrated microclimate–energy demand simula- tion method for the assessment of urban districts 59 4.1 Introduction 60
4.2 Background and state of the art 62 4.3 Methodology 63
4.4 Case study description 71 4.5 Results 79
4.6 Limitations 89 4.7 Conclusions 90
5 district-scale lake water free cooling in zurich, switzerland: system performance simulation and techno-economic feasibility 93
5.1 Introduction 94
xvii
5.2 Network performance simulation and assessment criteria 94 5.3 Case study and system boundaries 100
5.4 Results and discussion 101 5.5 Conclusions 106
6 district-scale energy systems and stochastic sources of uncertainty 109
6.1 Introduction 109
6.2 Solar photovoltaic systems and electricity costs 110 6.3 District heating and cooling 119
6.4 Conclusions 141
7 final conclusions and remarks 143 7.1 Summary 143
7.2 Conclusions and future work 145
a assumptions in the occupancy modeling approaches in chapter 3 147
a.1 Pseudocode for each of the occupancy models 147 a.2 Building properties 155
b assumptions in the district cooling network com- parison in chpater 5 161
b.1 Piping catalog 161 bibliography 163
I N T R O D U C T I O N
1
1.1 motivation
Cities are social, cultural and economic hubs that continue to attract people due to the opportunities they offer. The majority of the global population is already urban, and its share will continue to increase, as the United Nations estimates that90% of population growth in the21stcentury will occur in cities [1]. Due to their central role, however, cities are also a major source of resource and energy consumption, with more than70% of global energy demand and up to50% of greenhouse gas emissions attributed to urban areas [2]. Within cities, the building sector is the largest source of greenhouse gas emissions [3]. In particular, heating and electricity consumption have been estimated to account for36% of global CO2emissions [4].
The development of sustainable urban areas will therefore be key to meeting global greenhouse gas emission reduction targets. According to the United Nations Environment Programme, the development of energy- efficient, climate-resilient and affordable district energy systems is one of the least-cost and most-efficient solutions for reducing greenhouse gas emissions and primary energy demand, and could contribute as much as 58% of the required CO2emission reductions required in the energy sector by2050[5]. Interconnecting buildings through district-scale energy systems provides opportunities to exploit synergies between buildings with different uses and demand profiles, as well as allowing the integration of distributed energy producers. Achieving these benefits, however, requires a detailed understanding of the types and dynamics of energy demand in buildings at high spatial and temporal resolution.
Urban building energy modeling (UBEM) can be a powerful tool to assess the current and projected demands of urban areas in order to support the planning of interventions at a variety of scales, such as building retrofits, urban form modifications and district energy system implementation. Build- ing energy modeling is a well-studied field, with a number of software tools that have become an integral part of the planning process. Due to the large amounts of data required to create a bottom-up model of a single building, simply using building-scale tools to create individual building energy models for each building in an urban area would make data col-
1
lection impractically onerous [6]. Furthermore, when scaling up from the building to the urban level, complex interactions between the components of the urban system arise, such that urban areas cannot be simply analyzed as an aggregation of single buildings by implementing traditional building energy modeling methods [7].
Currently, the two major obstacles UBEM must tackle are input data availability and input uncertainty [8]. In order to reduce the amount of data required to create a model, UBEM typically use archetypes to rep- resent a number of buildings with similar properties [6]. However, these simplifications in input parameters inherently increase the uncertainty of the simulated results.
Uncertainty in building energy demand models can be classified as epis- temic or aleatory uncertainty [9]. The former arises as a result of lack of knowledge about specific input parameters, such as the thermal proper- ties of the building envelope, lighting and appliance power densities, or supply system efficiencies. With the increased availability of sensor data in cities, the contribution of epistemic uncertainty can be better quanti- fied through measurement campaigns. Optimization-based methods [10], pattern-based methods [11], and Bayesian calibration methods [12] com- bined with meta-modeling [13] can then be used to reduce the error in building energy predictions. Such methods have been implemented at the urban scale, in particular in the calibration of archetypes through Bayesian calibration [14] or the use of surrogate modeling to estimate unknown building properties [15].
Aleatory uncertainty, on the other hand, arises as a result of the inherently stochastic nature of parts of the system under analysis. Due to their random nature, it is impossible to predict future variations in stochastic sources of uncertainty, and hence it can be better characterized but not reduced by measurement campaigns [9]. Thus, methods to analyze and quantify the role of these sources of uncertainty on the urban scale need to be developed. The primary drivers of stochasticity in building energy simulation are building occupants and climate [16]. The roles of these sources of uncertainty are analyzed further in the following sections.
1.1.1 Occupants
Occupant behavior is one of the key drivers of the so-called performance gapin building energy model predictions compared to measured consump- tion data. For example, previous research found that the energy demands
of identical buildings can vary by 100% due to occupant behavior [17].
Thus, modeling occupants is crucial for predicting the energy demands in buildings as well as in order to analyze the effects of changes in an area’s activities on the corresponding energy infrastructure required.
Occupant activities have traditionally been modeled based on determin- istic schedules that indicate typical patterns of occupant presence and appliance use at each time of the day for different building functions. The use of the same profiles for all spaces of a given function, however, can lead to homogeneous load profiles that misrepresent the true peak loads in a district. In order to account for the inherent uncertainty in building users’
actions, a number of stochastic methods for occupant modeling have been proposed. At the district scale, however, the majority of the works in the literature show a reliance on deterministic schedules of occupant presence and appliance use. There are only a few stochastic models in the literature, and each of those approaches covers only one building use type [18].
Urban building energy simulation should consider the effects of occu- pants’ location-based activities as well as the interactive effects of building energy consumption and mobility [19]. Existing methods to model occu- pant presence and behavior at the building scale have increasingly added complexity to the simulation effort. However, previous research found that simulation results depended primarily on the availability of reliable estima- tions of occupant presence rather than whether occupancy patterns were represented deterministically or stochastically [20]. The difficulty of data collection on individual occupants is only exacerbated when scaling up to the district scale, as the number of people to be monitored is multiplied.
The widespread availability of data from location-based services might provide a useful source for the development of data-centric approaches [21], however such approaches remain as of yet restricted to the prediction of occupancy for a limited number of building functions. New methods for occupant modeling at the district scale are required that can cover a larger number of occupancy types as well as the movement of users throughout urban areas. With the increased availability of transportation models that can simulate people’s activities based on their personal characteristics, these could serve as a source for modeling individual occupants’ activities in order to improve energy demand predictions in districts. Such new sources of occupancy data might help reduce the uncertainty in the prediction of occupant presence.
1.1.2 Climate
Climate data is a fundamental input into any building energy simulation.
In order to avoid the biases caused by yearly variations in weather data, these inputs usually take the form of a Typical Meteorological Year (TMY).
TMY data is based on long-term observations from local weather stations, which are typically smoothed and averaged through a number of years [22].
This allows equipment sizing to be carried out in order to be able to meet energy demand under “normal” operating conditions. However, the unpredictability of actual weather adds uncertainty to the simulation results.
Increasing concern is being shown that a single data file cannot contain sufficient information on plausible weather conditions [9].
Furthermore, variations in wind speed, solar radiation, and air temper- ature patterns in the local context and their impact on building energy demand are generally overlooked. In urban areas, a number of physical processes take place that can directly affect climatic conditions in them.
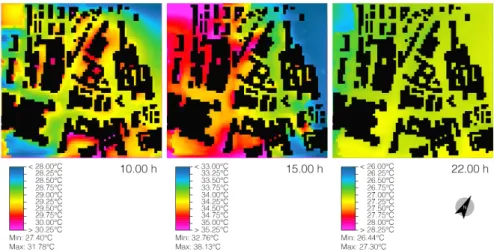
These include increased absorption of the shortwave radiation due to the reduced solar reflectance of urban surfaces, increased sensible heat storage in urban structures, anthropogenic heat emissions from air-conditioning systems and motorized vehicles, reduced evapotranspiration due to lack of vegetation, and reduced sensible heat losses due to lower wind speeds in urban canyons [10]. These processes can lead to temperature differences between urban and rural areas, a phenomenon known as the Urban Heat Island (UHI) effect. Compounded by global warming, the UHI can lead to a significant increase in cooling demand in urban areas [23,24].
Coupling energy demand models with urban microclimate simulation tools can thus help to quantify the effects of local environmental condi- tions on energy consumption. Previous studies on this interaction have however largely focused on the individual building scale [24]. Indeed, most currently available UBEM do not account for the effect of heat emissions from buildings heating up the local microclimate which further influences the building energy demand [19]. Attempts to couple district-scale energy demand simulations to urban climate models usually rely on simplified models [25]. These are typically at the mesoscale, which means they can predict climate phenomena in the100km order,i.e., at the city scale [26]. In order to accurately account for the distribution of cooling loads in urban districts, it is necessary to explicitly simulate each building and their sur- rounding urban climate at the micro scale, however the coupling at such a scale has as of yet not been carried out [27].
1.2 problem statement
The literature shows an increasing level of detail in urban building energy modeling as computational capabilities and data sources have grown. Re- cent advances in data collection and district-scale model calibration will help reduce epistemic uncertainty sources by providing more accurate esti- mates of the measurable input parameters in UBEM. Aleatory uncertainty, however, continues to be a major contributor to the performance gap. In order to assess the effects of these stochastic sources of uncertainty on the predicted demands of urban areas, new methods need to be developed to model occupants and microclimate within UBEM in order to quantify their effect on building energy demand.
1.3 research goals and methods
The aim of this thesis is to develop a framework to investigate two of the main sources of stochastic uncertainty, namely building occupants and urban microclimate, and their effects on energy demands and supply system sizing at the district scale. Given that no existing tool can model all of the various aspects that make up an urban energy system [28], the present work uses model integration as a way to bridge the gap between models created for distinct purposes and unique audiences.
In order to analyze the effects of occupant modeling on the predicted demands of urban areas, a novel population-based approach (PopAp) was developed and compared to established deterministic and stochastic meth- ods found in the literature. The new method is inspired by agent-based transportation models and can be expanded in order to model a variety of occupants and their movements within a district. The models were imple- mented in the UBEM City Energy Analyst (CEA) [29] in order to obtain the energy demands of a case study area based on these different occupant modeling assumptions. Furthermore, an integration method was developed to couple CEA with a state-of-the-art climate microsimulation to assess the effects of urban climate during extreme weather events.
The methods developed were tested in a case study in central Zurich, Switzerland, in order to quantify the effects of these stochastic sources of uncertainty on the energy demands of the area. In a subsequent step, the predicted demands are used in order to assess the sizing and economic viability of district-scale and decentralized energy systems for the case study area.
The goals of this thesis can be summarized in the following research questions:
1. What are the main sources of epistemic uncertainty in a district-scale building energy demand model?
2. How can occupant presence be modeled at the district scale using data from an agent-based transportation model and how do these results compare to standard occupant modeling methods?
3. Which are the main urban microclimate factors that affect energy demand and how can district-scale building energy demand modeling be coupled to urban microclimate simulations?
4. How do occupant behavior and local microclimate affect a district’s energy demand and how do these effects compare to epistemic uncer- tainty sources?
5. How do the uncertainties caused by occupant modeling and local microclimate affect the sizing and costs of a district’s energy infras- tructure?
1.4 context and scope
The work presented in this thesis was carried out within the context of the JPI Urban Europe project SPACERGY, which comprised four PhD theses in Switzerland, the Netherlands and Norway. The project aimed to develop new toolsets and guidelines to advance the implementation of energy- efficient urban districts. In addition to the case study explored in this thesis, the methods developed within SPACERGY were further tested in case studies in Almere (Netherlands) and Bergen (Norway). These results are out of the scope of this thesis but can be found in the final report of the project [30].
The work presented in this thesis corresponds to the Swiss contribution to this project, which was supported by the Bundesamt für Energie. The work carried out on the integration of urban energy demand and micro- climate simulations led to two further conference contributions, which are also beyond the scope of this thesis, focusing on the development of the methodology in the Zurich context [31] and its application on the case study in Almere [32,33].
1.5 thesis organization
This thesis comprises two peer-reviewed journal papers, two peer-reviewed conference papers, and an additional chapter providing further analysis of the implications of these papers. Chapter2presents a sensitivity analysis of the epistemic uncertainties associated with the deterministic input parame- ters in the CEA demand model in order to discover the parameters to which the selected aleatory uncertainties are to be compared. Chapter3presents a comparison between a novel occupancy model and two reference models in the literature in order to assess the effects these sources of uncertainty have on the predicted demand compared to other input parameters. Chapter4 presents a method for the integration between microclimate modeling and district-scale energy demand simulations, which is then used to analyze the impact of urban microclimate on space cooling demand during an extreme weather event. Chapter 5presents a thermal network simulation model, which is then tested by modeling a proposed district cooling network in the case study area. Finally, the effects of occupancy modeling approaches and urban microclimate on thermal network sizing and costs, as well as on the performance and economic feasibility of photovoltaic panel placement in the area, are presented in Chapter6. A discussion of the main conclusions extracted from this research along with a discussion of the limitations and aspects for future work are presented in the closing chapter.
S E A S O N A L E F F E C T S O F I N P U T PA R A M E T E R S I N
2
U R B A N - S C A L E B U I L D I N G E N E R G Y S I M U L AT I O N
abstract
Urban Building Energy Models are powerful tools for estimating future states of energy consumption and energy generation in buildings. Due to the complexity of these systems, large amounts of data are required, which are often incomplete or unavailable. Through the implementation of building archetypes, models such as the City Energy Analyst minimize the amount of input data. However, these simplifications inherently increase the uncertainty of the expected results.
This paper presents a sensitivity analysis of architectural properties (window-to-wall ratio, occupant density and envelope leakiness), thermal properties (U-values, g-values, thermal mass and emissivity of building surfaces), operating parameters (set point temperatures and ventilation rates) and internal loads (heat gains due to occupancy, appliance use and lighting). For this, the study combines a two-step process of sensitivity analysis with Saltelli’s extension of the Sobol method and the City Energy Analyst. The methodology is applied to a case study area in central Zurich, Switzerland, comprising284buildings with predominantly educational, hospital and residential uses.
The results showed that the cooling demand in the area was very strongly influenced by the set point temperature, with other variables having a relatively minor influence. For the heating case a larger number of variables were needed in order to explain variations in demand, primarily the thermal properties of the envelope and air exchange rates of the buildings. This was generally true for all occupancy types, shapes, sizes and locations, showing the importance of accurate estimates of these parameters in urban building energy modeling. On a broader sense, the results contribute to the development of urban energy simulations that are both practical and accurate.
Mosteiro-Romero, M., Fonseca, J., & Schlueter A. Seasonal effects of input param- eters in urban-scale building energy simulation. Energy Procedia 122, 433–438. doi:
10.1016/j.egypro.2017.07.459(2017).
9
2.1 introduction
Urban Building Energy Models (UBEM) are expected to become a key planning tool for public utilities, municipalities, urban planners and ar- chitects. Currently, the two major obstacles UBEM must tackle are input data availability and input uncertainty [6]. Input data uncertainty is a key aspect of UBEM and as such, UBEM inputs hold a fundamental role for accurate model predictions. Computational models such as the City Energy Analyst (CEA) [34,35] are powerful tools to estimate future states of en- ergy consumption and energy generation in districts accounting for hourly exchanges of energy among buildings, users and the environment. Such a level of detail requires a vast number of user inputs, including informa- tion about3D geometry, materials, occupancy and HVAC components of buildings. However, these input data are often incomplete or unavailable.
Through a wide database of building properties or archetypes, UBEM such as the CEA aim to minimize these inputs. However, these simplifications in input parameters inherently increase the uncertainty of the expected results.
Sensitivity analysis studies how the uncertainty of input parameters is assigned to different output parameters. Sensitivity methods are classified into local and global methods. While local methods evaluate the effect of one input on one output, global sensitivity methods sample the complete input space and are therefore able to calculate overarching sensitivities [36].
Global sensitivity analysis is a generic term referring to various sensitivity methods. The Morris method is a one-at-a-time method widely used to rank a set of input variables according to their qualitative influence on the output of a computational model [37,38]. In contrast to the Morris method, the Sobol method is a variance-based method that furthermore estimates the percentage of variance caused by the variability of a certain input [39, 40]. It is useful to determine, in a quantitative way, the effects of an input variable on the output of a computational model.
The objective of this paper is to analyze the seasonal effects (heating and cooling season) of architectural properties (window-to-wall ratio, occupant density, envelope leakiness), thermal properties (U-values, G-values, ther- mal mass and emissivity of building surfaces), operating parameters (set point temperatures and ventilation rates) and internal loads (heat gains due to occupancy, appliance use and lighting) on the demand for heating and cooling of urban areas. For this, the study combines a two-step process of sensitivity analysis using the Sobol method and the UBEM City Energy
Analyst [41]. The method is applied to an area in central Zurich, known as the Hochschulquartier. The area hosts284buildings in the residential, educational, services and healthcare sectors.
2.2 method 2.2.1 Data collection
The CEA demand is based on a resistance-capacitance model of the build- ings in a district and on the application of construction archetypes to minimize the amount of input data required. The necessary information about3D geometry, materials, occupancy and mechanical components was obtained from GIS data, owner information and the archetype database.
Data on energy-relevant retrofits for the main building components was scarce and thus estimated.
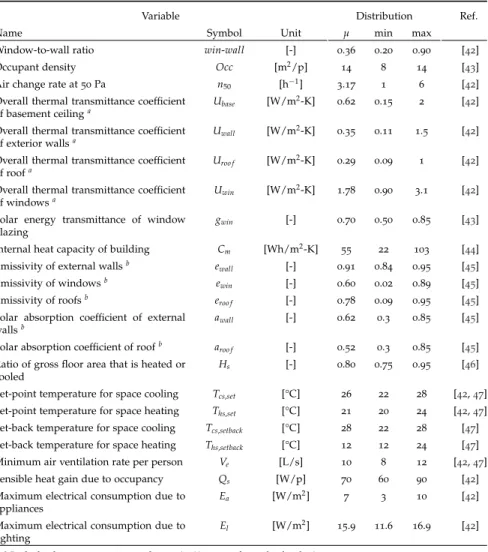
Table2.1presents the probability density functions of input variables and their references. Twenty-three different variables and their corresponding probability density functions were selected to cover different sources in uncertainty, including the effects of buildings’ architectural and thermal properties, operating parameters and internal loads. The means and stan- dard deviations shown in the table were calculated assuming a triangular distribution from published minimum and maximum values.
2.2.2 Sensitivity analysis
The Saltelli series [39] was used to create stratified samples out of the probability distributions in Table2.1with a sample size Nof 1000. CEA was executed on every sample to determine yearly heating and cooling needs for each building. The Sobol method was applied on the data with the computational implementation of SALib [48].
The number of simulations needed for this methodology depends strongly on the number of variables sampled, however, with N·(2k+2) simulations required forkvariables and a sample size N. Thus, in order to reduce the computational time required, pre-screening was used to se- lect the most sensitive variables to the yearly consumption of heating and cooling in buildings. First, a reduced case study was created that consisted of ten representative buildings covering the main usage types in the area, construction years and building sizes. CEA was then executed on48’000 samples to determine yearly heating and cooling needs of these ten rep-
Table 2.1: Probability density function parameters for key input variables.
Variable Distribution Ref.
Name Symbol Unit µ min max
Window-to-wall ratio win-wall [-] 0.36 0.20 0.90 [42]
Occupant density Occ [m2/p] 14 8 14 [43]
Air change rate at50Pa n50 [h 1] 3.17 1 6 [42]
Overall thermal transmittance coefficient
of basement ceilinga Ubase [W/m2-K] 0.62 0.15 2 [42]
Overall thermal transmittance coefficient
of exterior wallsa Uwall [W/m2-K] 0.35 0.11 1.5 [42]
Overall thermal transmittance coefficient
of roofa Uroo f [W/m2-K] 0.29 0.09 1 [42]
Overall thermal transmittance coefficient
of windowsa Uwin [W/m2-K] 1.78 0.90 3.1 [42]
Solar energy transmittance of window
glazing gwin [-] 0.70 0.50 0.85 [43]
Internal heat capacity of building Cm [Wh/m2-K] 55 22 103 [44]
Emissivity of external wallsb ewall [-] 0.91 0.84 0.95 [45]
Emissivity of windowsb ewin [-] 0.60 0.02 0.89 [45]
Emissivity of roofsb eroo f [-] 0.78 0.09 0.95 [45]
Solar absorption coefficient of external
wallsb awall [-] 0.62 0.3 0.85 [45]
Solar absorption coefficient of roofb aroo f [-] 0.52 0.3 0.85 [45]
Ratio of gross floor area that is heated or
cooled Hs [-] 0.80 0.75 0.95 [46]
Set-point temperature for space cooling Tcs,set [°C] 26 22 28 [42,47]
Set-point temperature for space heating Ths,set [°C] 21 20 24 [42,47]
Set-back temperature for space cooling Tcs,setback [°C] 28 22 28 [47]
Set-back temperature for space heating Ths,setback [°C] 12 12 24 [47]
Minimum air ventilation rate per person Ve [L/s] 10 8 12 [42,47]
Sensible heat gain due to occupancy Qs [W/p] 70 60 90 [42]
Maximum electrical consumption due to
appliances Ea [W/m2] 7 3 10 [42]
Maximum electrical consumption due to
lighting El [W/m2] 15.9 11.6 16.9 [42]
aIncludes linear transmittance losses (10% more of standard value).
bCalculated for different typical building materials.
resentative buildings. The parameters that caused 90% of the observed effects on the demand were selected. Through pre-screening, the number of variables to be sampled was reduced from23parameters to11. The Saltelli series was then used again to create24,000samples out of the probability
distributions of these variables and CEA was again executed for the284 buildings in the area.
For each variablei, the Sobol method generates an associated sensitivity measureSi(first order sensitivity coefficient) and a total effect index STi, which measures the total (i.e., first and higher order) effects. In order to analyze not only the direct effects of a variable on the model results but also indirect interactions, in the following results section the total effect indexSTi is used to quantify the primary and secondary effects of each of these variables on the demand of each building in the area.
2.3 results
2.3.1 Effect of occupancy
Building archetypes such as the ones used by CEA assume different thermal and architectural properties, system set points and controls, and internal gains for different occupancy types. Thus, the sensitivity of each of these parameters was analyzed for the various occupancy types found in the case study. For this, the following generalized building occupancy types were defined: educational (including classrooms, libraries and laboratories), hospital (including hospital laboratories), office (including both private and university office spaces) and residential (including multi-dwelling units and hotels). Other usages found in the area, such as exhibition and retail spaces, were scarce and thus not included in this analysis. Figures 2.1and 2.2 present a comparison of seasonal effects (winter and summer) on heating and cooling consumption for the area of study. The results are categorized by the type of occupancy.
For the heating case, the building envelope’s thermal properties are responsible for more than half of the variation, while the air exchange rate is responsible for about a quarter and the rest of the parameters have a much smaller influence. Hospital buildings were found to be particularly sensitive to the air exchange rate, whereas window U-values had a much greater influence on residential buildings. Set point temperatures were generally less influential, while setback temperatures only had an effect in educational and office buildings.
For the cooling case, the set point temperature was responsible for the vast majority of the variation, especially in hospital buildings. The window- to-wall ratio and window U-values showed a relatively high effect, in
Total Education Hospital Office Residential
Ubase Uwall Uwin gwin win wall n50 Ths,set Ths,setback
Figure 2.1: Sensitivity effects on yearly space heating demand (MWh/yr) for the total area and per occupancy type.
Total Education Hospital Office
Ubase Uwall Uwin gwin win wall n50 Tcs,set Tcs,setback
Figure 2.2: Sensitivity effects on yearly space cooling demand (MWh/yr) for the total area and per occupancy type. (Note: residential buildings typically do not have cooling in Zurich.)
particular in educational and office buildings. All other variables had a rather small impact.
2.3.2 Effect of building shape
The case study area also presented a variety of building scales and ty- pologies. Thus, the correlations to building shape were also analyzed. The buildings were then categorized by their envelope factor [49] as compact (envelope factor less than0.8), medium (0.8–1.4) and non-compact (greater than 1.4). Of all the heated buildings in the area, 15% are compact, 48%
medium, and36% arenon-compact.
The results in Figures2.3and2.4show a strong correlation of seasonal effects to building compactness, with less compact buildings showing a greater effect of building envelope parameters such as U-values and window-to-wall ratios. Compact buildings, on the other hand, showed a greater influence of the set point temperatures and air exchange rates. For the cooling season, however, the set point temperature was again most influential in all cases.
Compact Medium Non-compact
Ubase Uwall Uwin gwin win wall n50 Ths,set Ths,setback
Figure 2.3: Sensitivity effects on yearly space heating demand (MWh/yr) per level of compactness.
Compact Medium Non-compact
Ubase Uwall Uwin gwin win wall n50 Tcs,set Tcs,setback
Figure 2.4: Sensitivity effects on yearly space cooling demand (MWh/yr) per level of compactness.
A similar effect was seen when analyzing the correlation of building heating and cooling energy demand to buildings’ heated floor area. In particular, building envelope properties had a stronger effect on smaller buildings than larger ones due to their higher surface to volume ratio.
2.3.3 Spatial effects
The spatial distribution on the sensitivity results are represented in Fig- ure 2.5. For the heating case, the top variable for each building is repre- sented. Large buildings tend to have a stronger influence from air exchange rate in the heating case, while buildings with a higher exposure to sunshine such as those on the top left and in the center of the area show a stronger influence from the window U-values. For the cooling case, since the set point temperature had the greatest effect on all buildings, the second most impactful variable is represented, with the majority of the remaining effects relating to the window properties.
Heating (MWh/yr)
Ubase Uwin n50
Cooling (MWh/yr)
Tcs,setback Ubase Uwin n50 win wall
Figure 2.5: Spatial distribution of the variables with the highest effect on each building for the heating case (left). Since the set point temperature had the highest effect for every building in the cooling season, the map on the right shows the variables with the second highest effect.
2.4 discussion and conclusion
Sensitivity analysis using Saltelli’s extension of the Sobol method was carried out on an urban area comprising284buildings in central Zurich, Switzerland, using the City Energy Analyst urban building energy model.
The analysis considered variations in seasons, occupancy type, building shape and size, and spatial distribution.
The results showed that the cooling demand in the area was very strongly influenced by the set point temperature, with other variables having a relatively minor influence. For the heating case a larger number of variables were needed in order to explain variations in demand, with an especially strong influence of the thermal properties of the building envelope and air exchange rates. This was generally the case for all occupancy types, even though variations could be observed for different activities, stressing the importance of these input parameters on the models capability to provide more accurate predictions. It is worth noting that due to the very different of use types within hospital buildings (e.g. operating room, laboratory, bedroom), the sensitivity results presented here might not be representative of each of these uses. In terms of shape and size, small and non-compact buildings generally showed a greater influence of the thermal envelope due to their relatively larger exposed surfaces, while compact and large
buildings showed a stronger influence of air exchange rates and set point temperatures. The effects due to spatial distribution were relatively minor.
The methodology shown in this paper provides insight into the parame- ters most relevant for CEA models with different building typologies and occupancy types. The results show which parameters are most sensitive in this scale and thus provide key variables that need to be calibrated in order to accurately predict the demands of urban areas. Further work will be carried out on calibrating these parameters using measured energy demand data for the case study area.
acknowledgments
We would like to thank to the CEA developer team for assistance. Spe- cial regards to Daren L. Thomas for enhancing connectivity to the High- Performance Computing cluster at ETH Zurich. This research is financed by the EU ERA-NET Cofund Smart Cities and Communities and the Na- tional Research Foundation of Singapore under the program Future Cities Laboratory II.
A N O V E L P O P U L AT I O N - B A S E D O C C U PA N C Y
3
M O D E L I N G A P P R O A C H F O R D I S T R I C T- S C A L E S I M U L AT I O N S C O M PA R E D T O S TA N D A R D - B A S E D M E T H O D S
abstract
District-scale building energy models can be a powerful tool for the in- tegration of renewable energy sources and efficiency measures in urban areas. One key limitation of these models, however, has been their rather simplified treatment of building occupants. Since it is their activities which create the needs for energy in an area, an improved analysis of the effects of occupants on demand at the district scale is needed.
This paper presents a novel population-based approach (PopAp) inspired by agent-based transportation models, in which a population of occupants was defined based on class and employee registers and each was given an individual daily schedule. This approach was then used to assess the effect of occupant presence modeling on district-scale energy demand simulations by comparing the data-centric PopAp method to standard- based deterministic and stochastic approaches.
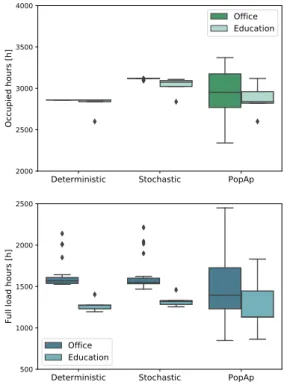
The maximum number of occupants in the area was found to be33%
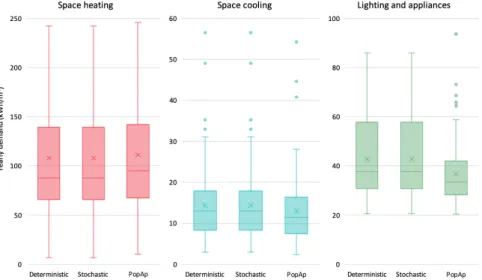
higher for the deterministic model compared to the data-centric PopAp results, a deviation that was especially pronounced in education build- ings. The results for space heating, space cooling and electricity demand for lighting and appliances show that while the mean deviation between models on a yearly basis is within10% for all demands, on an hourly scale the deviation for space cooling and electricity exceeded15%. Given the importance of the hourly scale for peak demand prediction for technology sizing, more detailed occupant modeling approaches should be considered when planning energy systems.
Mosteiro-Romero, M., Hischier, I., Fonseca, J., & Schlueter A. A novel population-based occupancy modeling approach for district-scale simulations compared to standard-based methods.Building and Environment181,107084. doi:10.1016/j.buildenv.2020.107084(2020).
19
3.1 introduction
Cities are the largest hubs of energy consumption in the world, with more than 70% of global energy demand and 40 to 50% of greenhouse gas emissions attributed to urban areas [2]. Furthermore, more than half of the global population currently lives in cities, a figure that is expected to keep growing as two-thirds of the world’s population is expected to be urban by 2050[50]. Thus, the development of sustainable urban areas will be a major challenge on the road to drastically reducing global CO2emissions.
Within cities, the building sector is a major contributor, with heating and electricity consumption accounting for 36% of global CO2 emissions [4].
From an energy planning standpoint, the district scale is particularly inter- esting, as solutions in this size are large enough to have a major impact while also being small enough to allow the development of realistic plans [42].
Furthermore, interconnecting buildings through district energy systems can provide significant advantages and opportunities to optimize build- ings’ operation through the exploitation of synergies between buildings with different uses and demand profiles. High-resolution urban data may facilitate the roll-out of energy conservation measures, integration of renew- able energy technologies and creation of benchmarking tools capable of targeting different energy users [51]. Due to this, the past decade has seen the development of various models and tools specifically designed for the assessment of building energy demand and supply at the district to urban scale [7,8,25].
A common shortcoming in these models, however, is their simplified treatment of building occupants. In their review on urban building energy modeling, Reinhart and Cerezo Davila [6] pointed out occupant behavior as one of the key areas of development needed in the field, as detailed occupancy models had only been proposed for one of the tools they an- alyzed. Occupant behavior can account for up to30% of the variation in building energy performance [9]. Furthermore, a review of works in the literature [17] showed that the energy demands of identical buildings can vary by100% due to occupant behavior. Failure to account for realistic user behavior can thus lead to considerable errors in prediction of the peak demand of a building, which in turn strongly influences the choice and sizing of building technology [52].
3.1.1 Occupant modeling in building energy demand simulation
Generally speaking, the simplest form of occupant modeling are determin- istic schedules used to define the probability of a space being occupied at each time of the day and throughout the year for different building uses.
Such an approach can be obtained, for example, from national building codes and standards (e.g., [43,53]) and provides a simple input for simu- lations. However, standard-based assumptions typically overestimate the actual occupancy in buildings, resulting in higher cooling loads and lower heating loads [54]. Furthermore, such schedules are limited in that they assume every building of a certain type will be occupied in the same way regardless of their actual occupants and context. These limitations have lead to the development of increasingly complex methodologies to generate more realistic occupancy patterns.
In order to address the inherent randomness of building occupants’ ac- tions, a number of stochastic approaches have been proposed to model occupant presence and behavior. There are three major forms of stochas- tic occupancy models, namely Bernoulli processes, survival analysis and discrete-time Markov chains [55], though the latter is most commonly found in the literature [56]. These models are based on calculating tran- sition probabilities for users moving from one state to another, such that an occupant’s state in the following time step depends only on its current state and the probability of transition from one state to another. Page et al. [52] developed a two-state (i.e.“present” vs. “absent”) inhomogeneous Markov chain model of occupant presence in offices and calibrated it to measured occupant presence data for four offices in Switzerland. In order to model occupants in residential buildings, Richardson et al. [57] introduced the concept of “active” occupants (i.e., occupants who are present and not asleep) and proposed a similar two-state model for residential buildings based on time use survey (TUS) data, which provide information on the activities of a large number of people collected through diaries. These two works proved to be highly influential, forming the basis for a number of two- and three-state models in the literature (e.g., [58–61]). Similar stochas- tic approaches have been developed to model the demand for electricity for appliances [62] as well as for window opening and closing actions [17].
Authors have also related occupant presence and indoor illuminance to estimate occupants’ demand for lighting [58,63], while other works in the literature [62,64] have proposed the use of pre-existing stochastic tools such as Lightswitch-2002[65].
Activity chain models such as Wilke et al.’s [66] expand the number of states available to each occupant to include not only presence but also activ- ities such as cooking or watching television. The probabilities of performing such actions at different times of the day are again based on large TUS data to provide a typical, randomly-generated set of activities an occupant might perform throughout a day. By assigning demands to each of these activities, authors have developed bottom-up energy demand models based on individual occupants’ daily schedules [67,68].
Agent-based modeling approaches have also been proposed to further analyze how individual occupants’ behavior and beliefs affect their actions in buildings. Such models assign each individual in the building personal attributes and behavioral possibilities [69] to simulate not only user behavior but also how occupants react and adapt to their environment and other occupants [70]. These approaches have been used to model occupants’
movement in buildings [71,72], their thermally-adaptive behavior in the built environment [69,70,73], their interaction with lighting and shading devices [73,74], as well as the change in occupants’ energy characteristics through their peers’ influence [75]. Attributes are typically assigned based on data collected from questionnaires and surveys [74], making it possible to accurately represent the heterogeneity of real building occupants. However, the huge amount of data required about individual occupants (e.g., the role of agents, the relationships between agents, etc.) may not always be available [54]. Thus, data collection can be cumbersome for scales larger than single rooms [72].
3.1.2 Occupant modeling in district-scale building energy demand simulation At the district scale, Happle et al. [18] classified the available occupant behavior modeling methods in the literature as either deterministic or stochastic, and either person-based or space-based. The vast majority of the works reviewed fell into the space-based deterministic category, i.e., the use of simple schedules that depend only on the type of space being modeled. These include the occupancy models in tools such as CitySim [76], the Urban Modeling Interface (UMI) [77] and the City Energy Analyst (CEA) [34], which use standard schedules such as the ones mentioned in the previous section to generate occupancy patterns of individual buildings in a district.
Recent years have seen the development of a number of stochastic ap- proaches, generally based on the aforementioned space-based occupant
behavior models by Richardson et al. [57, 63, 67]. A few person-based stochastic approaches were encountered for commercial [78], residential [79–
81], and office buildings [64]. These models were however found to require access to large time-use surveys and behavior questionnaire survey data, and the reviewers did not find any stochastic approaches that could cover more than a single occupancy type [18]. Indeed, Delzendeh et al. [82] found that75% of occupancy studies analyzed either residential or office buildings, with limited studies on other building uses.
As a way to account for occupant diversity and individuals’ activities, the developers of CitySim proposed replacing their occupant presence model with data from an agent-based transportation model [83], although no further work on this topic could be found in the literature. Agent- based transportation models have been successfully implemented to model people’s transportation behavior and how they adapt to their context in the urban scale. These are activity-based models, in which the unit of study are the individuals’ plans throughout a day. UBEM should consider the effects of occupants’ location-based activities that influence patterns in energy supply and demand [19]. Connecting mobility and building energy models through their common users could provide insight into the connection between activities and their location while helping bridge the gap between these two domains.
The idea of using transportation models as the basis for activity-based models of energy demand and emissions at the urban scale has been pursued in some other works in the literature [84, 85]. Authors in the fields of land use and transport modeling have previously coupled activity- based models with simple regression models to predict energy demand at the urban scale [86]. The use of regression models for energy predictions however limits the potential applications of such simulations in practice.
The connection between transportation and building occupancy was further explored by Barbour et al. [87], who used simulation results from agent-based transportation model TimeGeo (which in turn was based on pre-existent mobile phone data) to probabilistically assign occupancy sched- ules to individual buildings in Boston, USA. Their results showed typical occupancy rates were five times lower than predicted by reference data, leading to changes in building energy consumption of 15 to +1% for residential buildings and 4 to 21% for commercial buildings.
Following an agent-based approach, Azar et al. [88] modeled the oc- cupants in a university campus consisting of ten buildings comprising dormitories, classroom and office buildings. Their method comprised sub-