Time-Domain Interferometry of Surface Plasmons at Nonlinear Continuum Hot Spots in Films of Silver Nanoparticles
Philippe Klemm, Tobias Haug, Sebastian Bange,* and John M. Lupton Institut für Experimentelle und Angewandte Physik, Universität Regensburg,
Universitätsstrasse 31, 93053 Regensburg, Germany (Received 18 June 2014; published 30 December 2014)
Nonlinear continuum generation from diffraction-limited hot spots in rough silver films exhibits striking narrow-band intensity resonances in excitation wavelength. Time-domain Fourier spectroscopy uncovers how these resonances arise due to the formation of a“plasmon staircase”, a discreteness in the fundamental oscillation of the plasmon excitations responsible for generating the white-light continuum. Whereas multiple scattering from discrete antennas can be invoked to explain hot spot formation in random assemblies of isolated particles, hot spots in films of fused nanoparticles are excited by interfering propagating surface plasmons, launched by scattering from individual nanoparticle antennas. For closed films, discrete propagating plasmons interact coherently over distances of tens of microns to pump the hot spot.
DOI:10.1103/PhysRevLett.113.266805 PACS numbers: 73.20.Mf, 78.67.Bf, 78.47.N-, 78.30.-j
The interaction of light with metallic structures can give rise to the excitation of stationary or propagating plasmons, or admixtures of both[1]. Advances in the understanding of plasmonic excitations stem largely from the fact that the characteristics of collective electronic excitations are mostly classical in nature, as described by Maxwell’s equations [2]. But while agreement between simulation and experiment may be spectacular, it can overshadow more intriguing optical phenomena which are not accom- modated in contemporary models of plasmonic excitations.
One of these effects is the generation of a broad continuum emission from diffraction-limited hot spots in disordered films of silver nanoparticles [3,4]. A silver mirror can appear uniform under illumination with continuous-wave radiation, but exhibit structure from nonlinear optical conversion processes under irradiation with short pulses [5,6]. Similar phenomena occur in a range of metals, in particular, rough gold films and individual gold nano- particles[7,8], where they have been tentatively attributed to luminescence arising from transitions between or within higher-lying electronic bands of the metal, or radiative decay of individual nanoparticle plasmons[9–15]. There is little understanding of how plasmonic excitations in the metal actually give rise to visible light emission, particu- larly when the emission is higher in energy than the excitation. However, uncertainty in the origin of the light generation does not inhibit investigation of the underlying excitation process, which we elucidate here.
Studies of plasmon propagation and localization are usually carried out by either near-field scanning micros- copy[16,17], by placing an emitting species at a specific position [18], or by photoelectron emission microscopy [19,20]. We recently demonstrated [13] that superresolu- tion optical microscopy of continuum hot spots yields
surprisingly narrow (<13meV) plasmon excitation resonances, with multiple resonance peaks associated with a single hot spot localized to within 10 nm. Here, using Fourier-transform hot spot-excitation spectroscopy, detected in optical continuum emission, we reveal that hot spot excitation can occur by interference of propagating surface plasmons, giving rise to a discrete“plasmon stair- case”structure in the two-dimensional excitation spectrum of single hot spots which provides a unique spectral fingerprint of the individual hot spot.
The Tollens silver mirror reaction[21]allows reproduc- ible wet-chemical growth of silver nanoparticle films by simply controlling reaction time, which determines particle size and spacing, without modifying the optical emission characteristics (see Ref. [13] for characteristic electron micrographs). We compare both extremes, dispersed and fused particles, using time-domain Fourier transform spec- troscopy. Figure 1(a) shows a microscope image of up- converted radiation from a silver nanoparticle film, excited at 830 nm with 86 fs pulses of 80 MHz repetition rate. The dynamics of hot spot excitation can be resolved in a double- pulse autocorrelation experiment, where two pulses with stable phase relationship impinge on the sample, separated by a delayΔt[22–25]. Illumination occurs under 70° angle of incidence over a wide area of the silver film (>80μm diameter), mounted under vacuum. For autocorrelation measurements, the emission is detected by an avalanche photodiode in the image plane of the microscope, resulting in a spatial resolution sufficient to isolate single hot spots. The emission is detected in the spectral range of
∼400−650nm. The delay Δt oscillates between 300fs at a repetition rate of 1 Hz with a piezo stage in one arm of a Michelson interferometer. A photon counting module is used to correlate photon arrival times
with piezo stage position. The observed signal intensityI relates to the time-dependent local electric field strength EðtÞ at the hot spot as
IðΔtÞ∝ Z∞
−∞
jEðtÞ þEðtþΔtÞj2pdt; ð1Þ
where p is the power exponent in the nonlinear hot spot emission intensity [5]. This exponent does not depend on excitation wavelength but was found to vary between 1.2 and 2.1 for individual hot spots. It is determined from the peak-to-baseline ratio of the autocorrelation traces, since
Ið0Þ=IðΔt→∞Þ ¼4p=2. ð2Þ Figure 1(b) shows a typical hot spot autocorrelation in a low-coverage Tollens-reaction silver film (30 s growth time) with nonaggregated nanoparticles. The trace is symmetric and effectively limited in width by the laser pulse. As the phase of the light field is tuned by displacing the interferometer arm, the individual oscillations in hot spot intensity are clearly visible in the close-up for Δt between7fs, plotted beneath. The oscillation period of 2.8 fs corresponds to the laser wavelength of 830 nm.
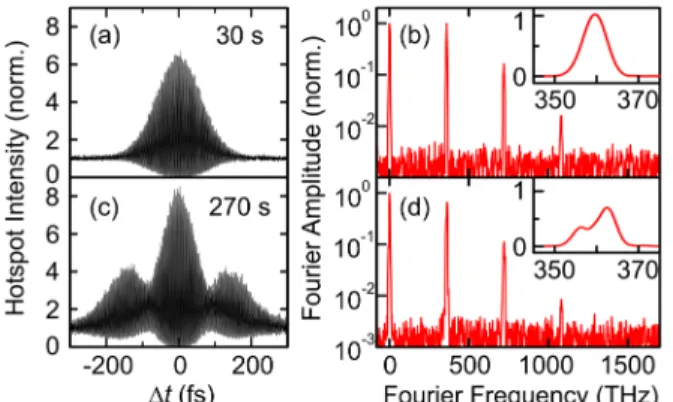
Whereas the direct observable in the time domain is the envelope of the hot spot emission intensity, the Fourier transform of the autocorrelation yields information on the field amplitude EðtÞ responsible for excitation. Figure 2 compares time-domain interferograms and the correspond- ing Fourier transforms for single hot spots in silver films with low [Tollens reaction time of 30 s, panel (a)] and high coverage [270 s reaction time, panel (c)]. At high coverage, interferograms exhibit substantial broadening and nodes [panel (c)]: the lifetime of the plasmonic excitation respon- sible for generating the continuum emission apparently increases significantly. A detailed analysis of the evolu- tion of the autocorrelation with surface coverage and
silver sheet resistance, and the strong variation between individual single-hot spot interferograms, is given in the Supplemental Material, Fig. S2[26]. The onset of nodes in the interferograms with increasing surface coverage does not coincide with the percolation threshold of the film (Fig. S2), but occurs for much greater coverage. We argue that this onset around 200 s growth time corresponds to a minimal film thickness of order the skin depth of silver, the prerequisite for the formation of propagating surface plasmon polaritons (SPPs), keeping in mind the inherent surface roughness of these fused-nanoparticle films.
The Fourier transforms of the autocorrelation interfero- grams for both low [panel (b)] and high [panel (d)] coverage follow the behavior for an almost quadratic nonlinear optical process. Sharp spectral features occur at multiples of the fundamental laser frequency of 360 THz (830 nm), with a weak third-order component being well resolved. The zero-frequency component arises due to the finite band- width of the laser pulse and effectively describes the pulse intensity envelope function. It does not contain relevant phase information. Although higher-order Fourier compo- nents are difficult to interpret fully without a detailed model of the nonlinear light generation mechanism, the component at the laser frequency closely relates to the field spectrum, as is well-known in Fourier spectroscopy. Information on the hot spot excitation process is thus available by considering solely the details of the fundamental frequency response.
For high-coverage films, modifications to this fundamental frequency spectrum [inset in panel (d)] relate directly to changes of combined laser and plasmon-driven electric field oscillations at the hot spot site.
We argue that the emergence of nodes in the autocorre- lation provides a signature of interference of propagating SPPs. As sketched in Fig.3(a), plasmon excitations can be launched by individual scattering nanoparticles which serve as antennas[19,28]. Given that excitation takes place FIG. 2 (color online). Time domain interferograms and corre- sponding Fourier transform spectra for single hot spots in a low- coverage silver film with isolated particles [(a),(b), 30 s growth time] and a high-coverage film with fused particles [(c),(d), 270 s growth time]. The insets show a close-up of the fundamental Fourier component around the pumping laser frequency. Fourier spectra are normalized to the zero-frequency component.
FIG. 1 (color online). Interferometric autocorrelation excitation spectroscopy of a single nonlinear continuum hot spot in a silver nanoparticle film grown by the Tollens reaction. (a) Microscope image of the sample under excitation at 830 nm with pulses of 86 fs duration at 80 MHz repetition rate. (b) Autocorrelation of the single hot spot intensity as a function of interpulse delay time Δt. The lower plot is a close-up of the data around zero interpulse delay.
below the nanoparticle plasmon frequency, we can assume that, within the laser frequency range probed, the response of the antennas is flat: all incident wavelengths are scattered equally. Each antenna can launch a propagating circular surface plasmon wave that decays in field amplitude asr−½ with distance r from the source, a process that can be modeled solely with a coupling phase and a wave ampli- tude without having to take into account the size or shape of the particle. Upon convergence on the hot spot site, the superposition of the individual plasmon waves and the incident laser field results in interference, with character- istic periodicity in the Fourier domain due to the mutual wave propagation delays.
To test this model, we consider the change of the hot spot interferogram upon displacement of the laser beam. Under oblique excitation and with a laser spot of limited exten- sion, sketched in the inset of Fig. 3(b), a fundamental asymmetry arises in autocorrelation double-pulse experi- ments. With the emitter site positioned off center, on the side of the illumination spot that is farthest away along the beam path, a SPP excited by the first laser pulse essentially copropagates with the second laser pulse. The accumulated time differences are therefore small (situationA). With the emitter located on the opposite side of the illumination spot, SPPs created by the first pulse and the laser field of the second pulse counterpropagate, and oscillations can be
observed at significantly longer time delaysΔt(situation B). In the experiment shown, the laser beam is displaced in lateral direction by 50μm between A and B. This displacement is sufficient to remove the nodal pattern in the interferogram, implying that the occurrence of nodes arises due to wave propagation assuming that a similar number of randomly placed antennas are addressed in either situation. A detailed discussion of this effect, along with statistics for 81 individual hot spots, which all show the same effect, is given in Fig. S3. Note that instead of displacing the laser beam, the beam diameter can also be shrunk. When excitation occurs with a diffraction-limited laser spot, interference effects are not observed [6]. In practice, however, it is easier to maintain a constant flux and effective angle of incidence if the spot diameter is kept fixed and the position is shifted.
Besides the spatiotemporal dependence on excitation, plasmon interference is also controlled by excitation FIG. 3 (color online). Interference of propagating SPPs in fused
silver nanoparticle films. (a) Schematic of plasmon interference.
Two identical laser pulses (red) excite circular SPP wave packets (electric field amplitude depicted in blue and red) at random scattering particles, which serve as antennas. The waves propa- gate along the metal-vacuum interface and may interfere at the emitter site. The emission (orange) depends on both the spatial distribution of antennas and the interpulse delayΔt. (b) Effect on the autocorrelation of displacement of the pump beam (50μm diameter) with respect to the single emitting hot spot. The sample plane is shifted horizontally by50μm between configurationsA andBso that the hot spot is situated either to the right (A) or left (B) of the laser spot.
FIG. 4 (color online). Fourier spectra of single hot spots obtained by sweeping excitation frequency. The normalized amplitude of the fundamental Fourier component is shown as a density plot for each individual setting of central pump-laser frequency. (a) For a film of isolated particles (30 s growth time), the Fourier frequency observed in hot spot emission follows the excitation frequency. The hot spot intensity is virtually indepen- dent of laser frequency (top panel), but the Fourier amplitude, integrated over excitation frequency, shows some substructure (right panel). (b) Appearance of a plasmon staircase in the hot spot Fourier excitation spectrum of a fused-particle film (330 s growth time). Model simulations shown in red are determined by the number of individual antennas and the plasmon propagation delays between them. The simulation parameters are described in the Supplemental Material[26].
frequency. Figure 4(a)shows the Fourier spectrum of the fundamental system response (i.e., at the laser frequency) as a function of excitation frequency for a single hot spot (p¼1.2) on a surface of nonaggregated nanoparticles. Red lines indicate the results of simulations discussed below. The integrated hot spot intensity under single-pulse illumination (i.e., forΔt¼0) is plotted along the top horizontal axis. The Fourier amplitude integrated over the range of laser excita- tion frequencies is given on the right vertical axis. As expected, the autocorrelation frequency of the plasmon excitation directly follows the excitation frequency, giving rise to the dominant diagonal, the width of which corre- sponds to the laser bandwidth. The integrated Fourier amplitude displays some subtle structure, which can be shown to originate from the limits imposed on the scan range as well as the nonequidistant data spacing along the laser- frequency axis (a consequence of the laser control mecha- nism). The hot spot excitation spectrum (top) is almost flat within the range under consideration (855–915 nm).
In contrast, for fused particles, distinct resonances have been reported in single hot spot excitation spectra under illumination with pulses of 140 fs duration [13]. In the present case, the pulses are 86 fs long, reducing resolution in the excitation spectrum. Nevertheless, the excitation spectrum [top of Fig.4(b)] for a hot spot (p¼1.4) shows distinct substructure, which is only found in fused films.
The Fourier spectrum uncovers the plasmon modes respon- sible for hot spot excitation. These modes appear to vary discretely with excitation frequency, giving rise to a pronounced “plasmon staircase”. Correspondingly, the Fourier amplitude, integrated over all excitation frequen- cies, reveals remarkably sharp substructure (right panel), which is not limited by laser bandwidth. The hot spot excitation mechanisms for isolated and fused particles differ fundamentally although emission characteristics are identical[5].
We can model the hot spot excitation spectrum and the autocorrelation Fourier amplitude integrated over excita- tion frequencies by interference of propagating SPPs, as illustrated in Fig. 3(a). Note that, since there is no information on the size (scattering cross section) and positioning of nanoparticle scattering antennas, it is only meaningful to interpret the data in the time domain and not geometrically. The time delay determined from node formation in the autocorrelation trace [Fig. 2(c)] implies a minimal spacing between SPP wave sources, given by SPP velocity. Excitation and Fourier spectra contain dis- tinct information: the excitation spectrum reports on resonances occurring due to pumping by single pulses.
The shorter the pulse, the fewer antennas deliver interfering plasmon waves to the hot spot since the coupling range between plasmons and the laser field is limited by the speed of light and the excitation pulse duration. In contrast, the Fourier spectrum reports on the correlation between two pulses, the spectrum being dominated by high frequency
oscillations due to antennas with the longest propagation delays. In this case, the earlier laser pulse drives the antennas that are most distant from the hot spot. Using these simple model assumptions, we reproduce the observed spectral characteristics, as described in the Supplemental Material [26] and plotted in red in Fig. 4.
In panel (a), a single antenna is sufficient—the individual antennas in isolated diffractively coupled[13]particles are too close in space to give rise to distinct spectral features in the limited frequency range of the laser (inset cartoon). In contrast, the data in panel (b) are described by five antennas, which launch radial plasmon waves into the silver film. The model necessitates no further field-enhanc- ing plasmonic effect: the hot spot simply reports on the temporal interference of the propagating waves. The dominant oscillation observed in the integrated Fourier spectrum (right panel) is due to two waves of 180 fs mutual delay, corresponding to an effective separation between antennas of order 25μm. Effectively, dark propagating SPPs lend oscillator strength to the hot spot emitter[29]:
excitation becomes delocalized whereas emission is local- ized[1,30].
While the nature of continuum generation remains intriguing, single-hot spot Fourier spectroscopy reveals surprisingly long-range excitation. Whereas multiple scat- tering localizes nanoparticle coupling at low surface cover- age, hot spots on high-coverage films are remotely excited by a discrete number of propagating SPPs, each launched by individual antenna nanoparticles that collect the incident field. Hot spot radiation offers an alternative to photo- electron emission microscopy[19,29]to study interference of surface plasmons, since light detection can be carried out under ambient conditions with an order-of-magnitude higher spatial resolution[13,31]. Besides serving as nano- scale apertures to plasmonic excitations, white-light nanobeacons also probe transmission on subdiffraction length scales [32]. The time and phase control arising from interference promises nanoscale pump-probe spec- troscopy, where the probe is spatially compressed to the hot spot.
We thank N. Borys for many helpful discussions. This work was inspired by a Scialog Fellowship of the Research Corporation for the Advancement of Science. Financial support by the Deutsche Forschungsgemeinschaft (DFG) within the program GRK1570 is gratefully acknowledged.
*Corresponding author.
sebastian.bange@ur.de
[1] M. I. Stockman, S. V. Faleev, and D. J. Bergman,Phys. Rev.
Lett.87, 167401 (2001).
[2] C. E. Talley, J. B. Jackson, C. Oubre, N. K. Grady, C. W.
Hollars, S. M. Lane, T. R. Huser, P. Nordlander, and N. J.
Halas,Nano Lett.5, 1569 (2005).
[3] C. K. Chen, A. R. B. de Castro, and Y. R. Shen,Phys. Rev.
Lett.46, 145 (1981).
[4] S. Ducourtieuxet al.,J. Nonlinear Opt. Phys. Mater.9, 105 (2000).
[5] N. J. Borys and J. M. Lupton,J. Phys. Chem. C115, 13645 (2011).
[6] J. M. Gunn, S. H. High, V. V. Lozovoy, and M. Dantus, J.
Phys. Chem. C114, 12375 (2010).
[7] G. T. Boyd, Z. H. Yu, and Y. R. Shen,Phys. Rev. B33, 7923 (1986).
[8] M. R. Beversluis, A. Bouhelier, and L. Novotny,Phys. Rev.
B68, 115433 (2003).
[9] A. Bouhelier, R. Bachelot, G. Lerondel, S. Kostcheev, P.
Royer, and G. P. Wiederrecht,Phys. Rev. Lett.95, 267405 (2005).
[10] M. J. Walter, N. J. Borys, G. Gaefke, S. Höger, and J. M.
Lupton,J. Am. Chem. Soc.130, 16830 (2008).
[11] J. M. Dudley, G. Genty, and S. Coen,Rev. Mod. Phys.78, 1135 (2006).
[12] N. J. Borys, M. J. Walter, and J. M. Lupton,Phys. Rev. B80, 161407 (2009).
[13] N. J. Borys, E. Shafran, and J. M. Lupton,Sci. Rep.3, 2090 (2013).
[14] S. Gresillon, L. Aigouy, A. Boccara, J. Rivoal, X. Quelin, C.
Desmarest, P. Gadenne, V. Shubin, A. Sarychev, and V.
Shalaev,Phys. Rev. Lett.82, 4520 (1999).
[15] A. Losquin, S. Camelio, D. Rossouw, M. Besbes, F.
Pailloux, D. Babonneau, G. A. Botton, J.-J. Greffet, O.
Stéphan, and M. Kociak,Phys. Rev. B88, 115427 (2013).
[16] B. Hecht, H. Bielefeldt, L. Novotny, Y. Inouye, and D. W.
Pohl,Phys. Rev. Lett.77, 1889 (1996).
[17] P. Dvorak, T. Neuman, L. Břínek, T.Šamořil, R. Kalousek, P. Dub, P. Varga, and T. Šikola, Nano Lett. 13, 2558 (2013).
[18] H. Wei, Z. Li, X. Tian, Z. Wang, F. Cong, N. Liu, S. Zhang, P. Nordlander, N. J. Halas, and H. Xu,Nano Lett.11, 471 (2011).
[19] A. Kubo, K. Onda, H. Petek, Z. Sun, Y. S. Jung, and H. K.
Kim,Nano Lett.5, 1123 (2005).
[20] J. Lehmann, M. Merschdorf, W. Pfeiffer, A. Thon, S. Voll, and G. Gerber, Phys. Rev. Lett.85, 2921 (2000).
[21] Z. J. Wang, S. Pan, T. D. Krauss, H. Du, and L. J. Rothberg, Proc. Natl. Acad. Sci. U. S. A.100, 8638 (2003).
[22] A. Anderson, K. S. Deryckx, X. G. Xu, G. Steinmeyer, and M. B. Raschke,Nano Lett.10, 2519 (2010).
[23] B. Lamprecht, A. Leitner, and F. R. Aussenegg,Appl. Phys.
B 68, 419 (1999).
[24] T. Zentgraf, A. Christ, J. Kuhl, and H. Giessen,Phys. Rev.
Lett.93, 243901 (2004).
[25] M. Mascheck, S. Schmidt, M. Silies, T. Yatsui, K. Kitamura, M. Ohtsu, D. Leipold, E. Runge, and C. Lienau, Nat.
Photonics6, 293 (2012).
[26] See Supplemental Material at http://link.aps.org/
supplemental/10.1103/PhysRevLett.113.266805 for a de- tailed explanation of the model calculation, an analysis of autocorrelation data as a function of surface coverage, and an in-depth discussion of the effect of excitation spot displacement on the autocorrelation. The Supplemental Material additionally includes Ref. [27].
[27] P. B. Johnson and R. W. Christy, Phys. Rev. B 6, 4370 (1972).
[28] M. W. Knight, N. K. Grady, R. Bardhan, F. Hao, P.
Nordlander, and N. J. Halas,Nano Lett.7, 2346, (2007).
[29] M. Aeschlimann, T. Brixner, A. Fischer, C. Kramer, P.
Melchior, W. Pfeiffer, C. Schneider, C. Struber, P. Tuchscherer, and D. V. Voronine,Science333, 1723 (2011).
[30] K. Seal, D. Genov, A. Sarychev, H. Noh, V. Shalaev, Z.
Ying, X. Zhang, and H. Cao,Phys. Rev. Lett.97, 206103 (2006).
[31] A. McLeod, A. Weber-Bargioni, Z. Zhang, S. Dhuey, B.
Harteneck, J. B. Neaton, S. Cabrini, and P. J. Schuck,Phys.
Rev. Lett.106, 037402 (2011).
[32] D. Chaudhuri, J. W. Galusha, M. J. Walter, N. J. Borys, M. H. Bartl, and J. M. Lupton,Nano Lett.9, 952 (2009).