Surface plasmon delocalization in silver nanoparticle aggregates revealed by subdiffraction supercontinuum hot spots
Nicholas J. Borys1, Eyal Shafran1& John M. Lupton1,2
1Department of Physics & Astronomy, The University of Utah, Salt Lake City, UT 84112, USA,2Institut fu¨r Experimentelle und Angewandte Physik, Universita¨t Regensburg, 93053 Regensburg, Germany.
The plasmonic resonances of nanostructured silver films produce exceptional surface enhancement, enabling reproducible single-molecule Raman scattering measurements. Supporting a broad range of plasmonic resonances, these disordered systems are difficult to investigate with conventional far-field spectroscopy. Here, we use nonlinear excitation spectroscopy and polarization anisotropy of single optical hot spots of supercontinuum generation to track the transformation of these plasmon modes as the mesoscopic structure is tuned from a film of discrete nanoparticles to a semicontinuous layer of aggregated particles. We demonstrate how hot spot formation from diffractively-coupled nanoparticles with broad spectral resonances transitions to that from spatially delocalized surface plasmon excitations, exhibiting multiple excitation resonances as narrow as 13 meV. Photon-localization microscopy reveals that the delocalized plasmons are capable of focusing multiple narrow radiation bands over a broadband range to the same spatial region within 6 nm, underscoring the existence of novel plasmonic nanoresonators embedded in highly disordered systems.
L
ocalized surface plasmon resonances (LSPRs), the resonant oscillations of conduction electrons of nano- structured metallic systems, enable access to experiments involving macroscopic electronic coherence1,2. Since this resonance is often found at visible and infrared frequencies, plasmonic nanostructures provide an attractive optoelectronic platform that enables the near-field control of light on dimensions that fall far below the diffraction limit3–5. For example, metallic nanostructures are capable of focusing incident electromagnetic radi- ation to minute, nanoscale regions, termed ‘‘hot spots,’’ where the electric field can be enhanced by several orders of magnitude over that of the incident field. Within the hot spots, the interaction between light and matter can be significantly amplified giving rise to surface-enhanced optical phenomena6. One of the foremost exploitations of this effect is surface-enhanced Raman scattering (SERS) where the interactions between light and the vibrational modes of matter within the hot spot can be magnified, enabling Raman scattering measurements of asingle molecule. Such a feat necessitates overall enhancement factors approaching 12 orders of magnitude7–10. Beyond SERS, plasmonic systems have also been employed in a wide range of nanophotonic applications such as near- field imaging11and transmission spectroscopy12using highly localized nonlinear light sources; nanoscale lasers13; and ultra-sensitive analysis of dielectric environments14.Significant effort is placed in designing metallic nanostructures, and because of their electrodynamic nature, the parameter space that is available for engineering their plasmonic resonances is expansive and permits a wide range of possibilities14,15. For a single metallic nanoparticle, shape, size and composition are the primary toolset, and by utilizing the near-field and far-field coupling5,16, the parameter space is greatly expanded for multi-particle arrangements. In contrast to carefully designed structures, one of the most attractive and fascinating multi- particle systems consists of random metal-dielectric films17–20. The naturally arising structural intricacy of these films yields plasmonic resonances that result from a complex hybridization between spatially localized modes and delocalized modes that extend over mesoscopic dimensions of the film1,4,17,19,21–26. Remarkably large enhancement factors are found within the resulting hot spots, and it is with these structures that numerous single molecule SERS studies have been performed9,10,27. Further illustrating the advantageous nature of these plasmon resonances, evolutionary computational algorithms that are designed to optimize electromagnetic enhancement of a metal nanostructure have been shown to generate a disordered structure as opposed to an ideal dipolar antenna18. A thorough understanding of electronic coherence and plasmon resonances in these disordered systems has potential to provide novel approaches to the design of highly optimized nanostructures and motivates theoretical SUBJECT AREAS:
NANOPHOTONICS AND PLASMONICS NANOSCIENCE AND TECHNOLOGY OPTICAL MATERIALS AND STRUCTURES NANOSCALE MATERIALS
Received 26 April 2013 Accepted 10 June 2013 Published 28 June 2013
Correspondence and requests for materials should be addressed to N.J.B. (nborys@
physics.utah.edu)
and experimental studies of the electronic structure-property rela- tionships that govern the behaviour of these modes.
In this work, we use the nonlinearly excited supercontinuum emis- sion to reveal the plasmonic modes of nanostructured silver films produced with the Tollens reaction27as the morphology is varied from discrete nanoparticles to a rough, semicontinuous metal layer, using different growth times28. The nearly background-free emission originates from discrete diffraction-limited regions, and its exact nature and origin remain poorly understood. However, since the emission results from plasmonic hot spots20,28, theexcitationprocess provides a facile, noninvasive probe to study the intricate plasmon resonances of the disordered silver nanoparticle system. The spectral characteristics of the plasmon modes are determined from nonlinear excitation spectroscopy of single hot spots and exhibit a remarkable change from single-peaked, broad resonances in the low-coverage films to narrow, multi-peaked resonances in high-coverage films.
Through measurements of excitation polarization anisotropy of sin- gle hot spots, we can discern signatures of delocalized modes result- ing from the diffractive (dipolar) coupling in the low-coverage films as opposed to the (non-diffractive) delocalization of the plasmon modes in the extended metal structures of the high-coverage films.
The surface coverage at which significant plasmon delocalization is expected is marked by a drop in the number of nonlinear hot spots that are excitable with an electric field orientedparallelto the sample surface, suggesting a conceptual connection to propagating surface plasmons in a smooth metal film29. At the highest surface coverage where the modes are expected to be maximally delocalized, the films
consist of multi-resonant hot spots that can only be excited with electric fields that arenormalto the sample surface. Using photon- localization microscopy30, we provide evidence that these multi- peaked resonances in the semicontinuous films belong to one and the same hot spot.
Results
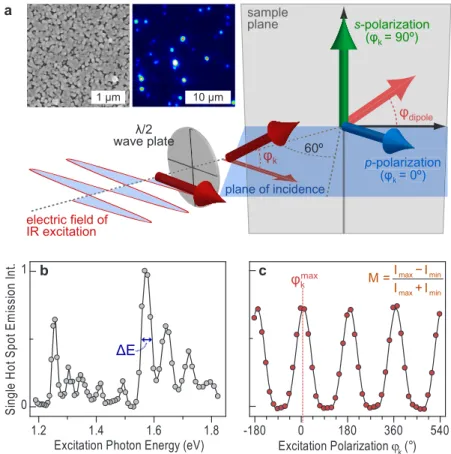
Polarization anisotropy and excitation spectroscopy of single hot spots.The nonlinear optical excitation measurements are illustrated in Fig. 1 for a high-coverage, semicontinuous silver film (growth time 255 s). Figure 1(a) shows the illumination scheme used for the nonlinear optical microscopy where linearly polarized, pulsed, infrared (IR) radiation illuminated the sample at an oblique angle of incidence. The polarization of the nonlinear excitation is described byQk, the angle that is formed between the horizontal direction and the electric field vector of the optical excitation. Underp-polarization (Qk50u, 180u), the electric field lies in the plane of incidence and consists of one component that is parallel to the sample plane and an orthogonal component that is normal to the sample plane. Fors- polarization (Qk590u, 270u) the electric field is entirely parallel to the sample plane (see theSupplementary Informationfor a complete discussion of the polarization). Inset in Fig. 1(a) is a representative SEM micrograph of the semicontinuous film showing that the structure is marked by a dense distribution of nanoscale voids and protrusions. Alongside the SEM image, an optical micrograph of the film under excitation at 1.78 eV shows that the upconverted supercontinuum arises from discrete diffraction-limited spots,
p-polarization (φk= 0º) s-polarization
(φk = 90º) sample
plane
φdipole
wave plateλ/2 60º
electric field of IR excitation
plane of incidence φk 10 μm
1 μm
-180 0 180 360 540
Excitation Polarization ϕk (°)
1.2 1.4 1.6 1.8
0 1
Single Hot Spot Emission Int.
Excitation Photon Energy (eV) a
b c
min max
min max
I I
I M I
+
= − φkmax
ΔE
Figure 1|Excitation spectroscopy and polarization anisotropy of single nonlinear hot spots in a high-coverage, semicontinuous silver film grown following the Tollens mirror reaction. (a) Under illumination of obliquely incident, pulsed infrared radiation, the film exhibits surface-enhanced upconverted supercontinuum emission from discrete, diffraction-limited spots. Typical SEM and fluorescence micrographs are shown. (b) Excitation spectrum of a single hot spot where the emission intensity is plotted as a function of the IR photon energy. The black line serves as a guide to the eye. The hot spot exhibits multiple resonances that are each characterized by their FWHM,DE. (c) Excitation polarization anisotropy measurements on single hot spots. The emission intensity is recorded as a function of the angle of the electric field vector from the horizontal,Qk, defined in the cartoon, and can be fitted with a cos4function (black line). The coupling to polarized excitation is characterized by the polarization anisotropy valueM, defined in the inset, and the in-plane dipole angle,Qdipole, which is determined from the angle of maximum emissionQmaxk .
which we refer to as ‘‘nonlinear hot spots.’’ Temporal and spectral analysis of the emission from these nonlinear hot spots28reveals that it is quasi-instantaneous with a lifetime of less than 5 ps and is comprised of a broadband continuum with a small amount of fluctuating second-harmonic radiation31, which can be neglected in spectrally integrated measurements. Figure 1(b) shows an example excitation spectrum of a single nonlinear hot spot from a semi- continuous film where the emission intensity is recorded as a function of excitation energy. Each excitation resonance was characterized by its full width at half maximum (FWHM), DE.
Additionally, we preformed excitation polarization anisotropy measurements on single hot spots. A sample dataset from such a measurement is shown in Fig. 1(c), where the intensity of the continuum emission is plotted as a function of the excitation polarization in terms of Qk. From such traces, the polarization- dependent coupling between the hot spot and IR excitation is summarized in two extracted values: the angle of the excitation dipole in the sample plane, Qdipole, which can be calculated from the corresponding angle of maximum emission intensity,Qmaxk , and the anisotropy value,M, which quantifies the emission modulation depth32.
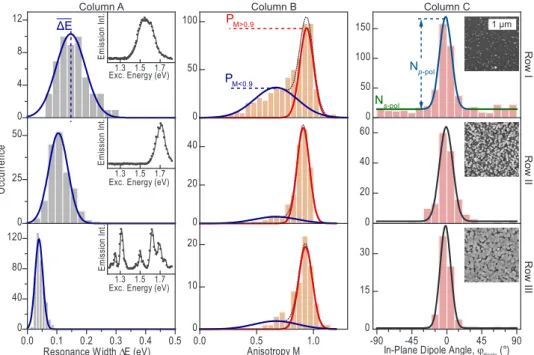
Figure 2 shows the distributions of the resonance widths, DE, (Column A), excitation anisotropy values,M, (Column B) and in- plane dipole angles, Qdipole, (Column C) for three different films (Rows I–III) with distinct surface morphologies as summarized in the SEM micrographs inset in Column C. Progressing downward from the topmost row, the surface coverage of the three films increases from well-separated nanoparticles deposited with a short growth time (45 s; Row I) over interconnected silver islands (inter- mediate growth time of 135 s; Row II) to a semicontinuous structure with a dense distribution of nanoparticles (long growth time of 255 s;
Row III). In previous studies, it was shown that the growth time provides a reliable parameter for reproducible structures. The films of interconnected islands were found to yield maximal linear and
nonlinear emission28 as well as optimal SERS performance33. All three distributions of the excitation properties display a clear dependence on film morphology. For each film, the distribution of resonance widths is well described by a single Gaussian centred around an average value,DE. The nonlinear hot spots in the low- coverage film (Row I) exhibit mostly single-peaked resonances with a broad distribution of widths centred on DE 5 145 meV with a standard deviation (SD) of 50 meV. An increase of growth time (Row II) leads to a narrower distribution of resonance widths centred on a notably smaller average value,DE5105 meV with a SD of 33 meV. This narrowing is more dramatic in the semicontinuous films (Row III) which show a distribution of widths centred on a significantly smaller average value, DE 5 39 meV with a SD of 13 meV. This pronounced decrease in resonance width as the surface coverage increases is accompanied by a transformation from single- peaked excitation resonances to multi-peaked resonances as seen in representative excitation spectra inset.
The film morphology also affects how the nonlinear hot spots selectively couple to the laser polarization. As seen in Column B, the low-coverage film (Row I) yields a bimodal distribution of aniso- tropy values with a strongly-polarized population centred onM5 0.95 and a less-polarized population aroundM50.65. The overall distribution is well-described by two super-imposed Gaussians. The relative populations of the strongly-polarized species to the less- polarized species are characterized by the heights of the respective Gaussian peaks in the histograms,PM.0.9andPM,0.9. As the surface coverage is increased, excitation of the nonlinear hot spots becomes increasingly more anisotropic in terms of polarization, and the popu- lation of less-polarized hot spots,PM,0.9, vanishes to nearly unde- tectable levels in both the film of interconnected islands (Row II) and the semicontinuous film (Row III).
A similar trend is also observed in the distributions of the in-plane dipole angles (Column C). The low-coverage silver film (Row I) yields a histogram that consists of a pronounced peak at 0usuperimposed on
0 4 8 12
0 50 100
0 50 100 150
0 25 50
Occurrence
0 20 40
0 20 40 60
0.0 0.1 0.2 0.3 0.4 0.5 0
40 80 120
Resonance Width ΔE (eV)
0.0 0.5 1.0
0 10 20
Anisotropy M
-90 -45 0 45 90
0 15 30
In-Plane Dipole Angle, ϕdipole (°) 1.3 1.5 1.7
Emission Int.
Exc. Energy (eV)
1.3 1.5 1.7
Emission Int.
Exc. Energy (eV)
1.3 1.5 1.7
Emission Int.
Exc. Energy (eV) ΔE
PM<0.9 PM>0.9
Ns-pol Np-pol
Row IRow IIRow III
1 μm
Column A Column B Column C
Figure 2|Nonlinear excitation properties of single hot spots of Tollens silver films in three distinct regimes of surface coverage and morphology. For each film, the distribution of resonance widths (Column A), polarization anisotropy values (Column B) and in-plane dipole angles (Column C) are shown. Representative excitation spectra of single hot spots are inset in Column A; SEM micrographs of the substrates are given in Column C. At low surface coverage (Row I) the films consist of well-separated silver nanoparticles. Increased surface coverage leads to films that are made up of interconnected silver islands (Row II) and are ultimately semicontinuous (Row III). The distributionPof anisotropy values is bimodal, corresponding to unpolarized and polarized hot spot excitation. The distribution of phase angles arises from hot spots which can be excited by eitherp- ors-polarized light, the number of which is described byN.
top of a uniform distribution that spans all angles resulting in a positive baseline offset of the peak. This dual-featured scatter of angles in itself is surprising. For an isotropic arrangement of dipoles in two or three dimensions, the strong peak at 0u is unexpected (see Supplementary Information), and leads us to conclude that it must arise due to a preferential response of the nonlinear hot spots top- polarized excitation where the electric field component of the incident radiation that is normal to the sample plane is maximized. The uni- form distribution that spans all angles, on the other hand, is expected for a random arrangement of dipoles in a two-dimensional plane (see Supplementary Information) and is accordingly attributed to hot spots that are maximally excited with in-plane electric fields. Thus, the low- coverage film consists of two types of nonlinear hot spots:p-polarized hot spots that respond maximally to an electric field that is normal to the sample plane; ands-polarized hot spots that respond maximally to an electric field that is parallel to the plane. Analogous to the aniso- tropy (M) distributions, these two populations are characterized by the height of the baseline offset for thes-polarized population (Ns-pol) and the height of the Gaussian peak for thep-polarized population (Np-pol) in the histograms in Column C. The values ofMandQmaxs for a single hot spot were found to be uncorrelated indicating that these two populations are independent of one another. So, in addition to the pronounced narrowing of resonance widths, increased surface cov- erage of the silver films also reduces the number of less-polarized and s-polarized hot spots leaving only highly-polarized hot spots that maximally couple top-polarized excitation.
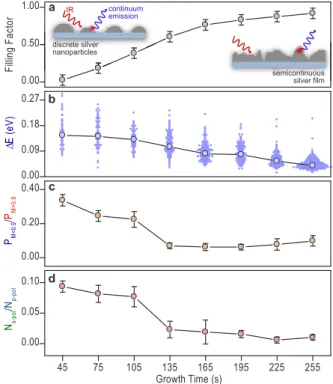
Using the average resonance width (DE), the ratio between the less-polarized and strongly-polarized hot spots (PM,0.9/PM.0.9) and the ratio between the populations ofs-polarized andp-polarized hot spots (Ns-pol/Np-pol), we summarize the progression of the excitation characteristics with increasing surface coverage in Fig. 3. In order to provide a more quantitative description of film morphology than growth time, we approximated surface coverage by computing the two-dimensional filling factor from SEM micrographs for eight dif- ferent growth times from 45 s to 255 s as shown in Fig. 3(a). The filling factor increases almost linearly from,0 to a saturation value close to unity. The progression of the hot spot excitation properties is quite pronounced. As shown in Fig. 3(b), the average resonance width narrows monotonically with increased growth time. On the other hand, the relative populations of the less-polarized hot spots to strongly-polarized hot spots, as well as the ratio of the populations of s-polarized hot spots top-polarized hot spots, show a pronounced step-like dependence on growth time as seen in Figs. 3(c) and 3(d), respectively. The populations of less-polarized (PM,0.9) and s- polarized (Ns-pol) hot spots drop to nearly undetectable levels upon increasing the surface coverage of the film from a filling factor of 0.4 (growth time: 105 s) to 0.6 (growth time: 135 s). This range of sur- face coverage is close to the percolation threshold of thermally depos- ited silver films21,24,25.
From Fig. 3, the nature of the plasmonic resonances is clearly distinct in the different regimes of surface coverage. When the film consists of well-separated silver islands, the resonances are domi- nated by the plasmon modes of interacting particles as is particularly evident in the broad resonance widths. In this regime, it is expected that the most pronounced hot spots are formed in the gaps of closely- spaced collections of particles, as in the case of simple arrangements such as nanoparticle dimers and trimers34. Such structures are expected to be maximally excited by electric fields that lieparallel to the sample surface35. Indeed, such arrangements are readily observed in our polarization data as the population ofs-polarized hot spots. However, a larger population of p-polarized hot spots exists in these films and indicates that the majority of hot spots are maximally excited by an electric field that isnormalto the sample surface. We attribute this pronounced preference in electric field vector orientation to diffractive coupling between the nanoparticles since light that is polarized normal to the sample plane maximizes the
out-of-plane polarization of the individual particles and concomi- tantly the in-plane diffractive coupling in the system36,37. The result- ing picture for the low-coverage films is an intricate electromagnetic confinement scheme that combines both the localized nature of the near-field coupled LSPR modes of closely-spaced nanoparticles with the delocalized nature of the longer-range diffractive coupling, giving rise to electromagneticlocalizationreminiscent of disordered media38.
As the silver coverage increases and larger, interconnected islands and ultimately semicontinuous films are formed, the plasmonic excitations transform from the LSPR modes of the individual nanoparticles to hybridized localized and delocalized modes, a well established phenomenon in semicontinuous metal films1,4,21–26. Signatures of this transformation in the macroscopic optical prop- erties of such films can be treated using an effective medium theory such as the Maxwell-Garnett approximation39. However, the spatial averaging of the local field distribution in such theoretical treatments limits their applicability to high resolution analysis of optical hot spot formation40. Past measurements on thermally-deposited semi- continuous metal films using near-field microscopy24,25, far-field spectroscopy21 and fluorescence lifetime microscopy26 have corre- lated the percolation threshold with the maximum level of hybrid- ization between localized and delocalized plasmonic modes. From the step-like behaviour near the percolation threshold that is seen in Fig. 3, we propose that the polarization anisotropy serves as an almost binary indicator of delocalized modes in these films: a
0.00 0.50 1.00
Filling Factor
0.00 0.20 0.40
PM<0.9/PM>0.9
45 75 105 135 165 195 225 255
0.00 0.05 0.10
Growth Time (s) Ns-pol/Np-pol
0.00 0.09 0.18 0.27
ΔE (eV)
a
b
c
d
discrete silver nanoparticles
semicontinuous silver film
IR continuum
emission
Figure 3|Transformation of plasmon modes with surface coverage as probed by nonlinear excitation of single hot spots. (a) The two- dimensional filling factor is used to describe surface coverage, showing an approximately monotonic increase with growth time. For low-coverage films, the plasmon modes are dictated by LSPRs of silver nanoparticles that are diffractively coupled to one-another, while the higher-coverage films are characterized by delocalized modes as is illustrated in the insets. (b) The average resonance width plotted on top of the corresponding distribution of data points shows a clear narrowing with growth time. The small data points describe the underlying distribution of resonance widths at the specified growth time and the horizontal breadth of the points reflects the occurrence frequency. The ratio between unpolarized to polarized (c) and s-polarized top-polarized (d) hot spots shows a step-like drop with increasing growth time between 105 s and 135 s.
plasmonic mode with traits of delocalization is maximally excited withp-polarized radiation. Such a condition on the excitation polar- ization is analogous to quintessential delocalized plasmon modes:
propagating surface plasmons in smooth metal films, which neces- sitate a non-zero electric field that is normal to the metal surface29.
Increased delocalization is accompanied by a transformation of the excitation spectra. The observed resonances in the films of high- est surface coverage (i.e., the excitation spectrum in Fig. 2, Column A, Row III) consist of multiple narrow peaks, differing notably to the broad, single-peaked resonances that are observed in the low- coverage films (cf. Row I). In contrast to the step-like behaviour of the polarization data, the resonance widths narrow continuously with increased surface coverage, conceptually bridging the broad resonant scattering spectra of individual metal nanoparticles41,42to narrow resonant near-field scattering spectra of large colloidal aggre- gates17. At the single hot spot level, devoid of ensemble broadening, we have observed resonances as narrow as 13 meV (255 s growth time). As spectral width and mode lifetime are inversely propor- tional, the narrow resonances suggest that the dephasing time of these modes can be over an order of magnitude larger than what is observed in single silver nanoparticles41,42, qualitatively confirming an analogous conclusion derived from near-field scattering spectro- scopy17. We propose that spectral narrowing and the associated increase in lifetime is yet another signature of plasmonic delocaliza- tion, as is particularly evident with the progression of these features with increasing surface coverage. In addition to this lifetime increase, the narrow resonances may have substantial practical appeal in ana- lytical applications where sensitivity is inversely proportional to spec- tral width43. Indeed, extraordinarily narrow resonances have been observed in well-engineered systems such as periodic arrays of nano- particles44–46. Being significantly more disordered, however, the rough metal films presented here are clearly distinct, and the exist- ence of sharp resonances in these systems has previously only been explored in the context of linear Rayleigh scattering in near-field microscopy17,19 and photoelectron emission microscopy (PEEM)47 of single hot spots, which do not necessarily correlate with the under- lying plasmonic excitations. In contrast, we report here directly on narrowplasmonicresonances detected in theoptical far-field.
At the highest coverage, single hot spots exhibit multiple reso- nances, suggesting that the film contains plasmonic structures capable of efficiently focusing several discrete bands of electromagnetic energy to the same spatial region (i.e., the same hot spot). However, a dense distribution of nanoscale features exists (cf. inset in Fig. 2, Column C, Row II) on scales well below the diffraction limit of our microscope (,500 nm), and the anticipated size of a hot spot is,15 nm48. Thus, extreme care must be taken when assigning the distinct resonances to the same spatial region. Even though near-field Rayleigh scattering of colloidal silver clusters has shown that a 100 nm region can contain multiple spectral resonances17,19, this length scale is nearly an order of magnitude larger than the hot spot. Since the spatial distribution of near-field intensity depends dramatically on incident photon energy4,17,19, the existence of hot spots with multiple discrete electro- magnetic resonances remains to be unambiguously established, neces- sitating spatial resolutions of order 10 nm.
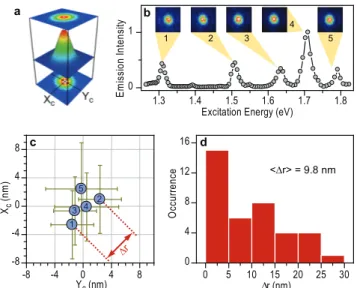
Localization microscopy of single multi-resonant nonlinear hot spots. To noninvasively probe the spatial extent of the multiple resonances of single hot spots in Figure 4, we employed photon localization30, a super-resolution microscopy technique that has been used in plasmonics to map the intensity distribution in the near-field regime around bow-tie antennae49, SERS hot spots in silver nanoparticle aggregates50,51 and hot spots that enhance the fluorescence of single molecules on rough silver films48. As shown in Figure 4(a), the emission centroid of the hot spot is extracted by fitting a two-dimensional Gaussian to the diffraction-limited spot.
Using these centroid coordinates, a single emitter can be localized
with a resolution limited only by the noise in the measurement, readily reaching nanometer precision30,48. The excitation spectrum and the corresponding microscope images of the hot spot at each resonance energy are shown in Fig. 4(b). The diffraction-limited emission profile of the hot spot is well described by a two- dimensional Gaussian function at each resonance. Furthermore, even though theemissionspectrum varies from spot to spot28, it is virtually identical at each resonance of asinglehot spot andover 103 broader(.400 meV) than the individual excitation resonances (see the Supplementary Information). Figure 4(c) shows the relative locations of the centroid at each resonance. Thus, for this hot spot, the centroid at all five resonances is localized to the same region within ,6 nm. Analogous measurements were repeated for 5 separate hot spots comprising 25 distinct spectral resonances, and the corresponding distribution of spatial shifts, Dr, between resonances within a hot spot is shown in Fig. 4(d). All of the recorded shifts fall below 30 nm with a large number of shifts below 15 nm. We stress that these shifts span a range of ,500 meV in excitation energy (over 200 nm in wavelength) and that such highly-localized emission is an unlikely scenario if the emitter were spatially extended. While the precise mechanism of nonlinear supercontinuum generation remains elusive, the high level of localization suggests the presence of a localized polarizable species within the hot spot28,31,50. A silver or silver oxide nanocluster is an obvious candidate for such a species52. By using this localized emitter as a probe of both localized and delocalized plasmon modes that are responsible for the nonlinear excitation process, we have identified evidence of naturally-grown plasmonic structures capable of producing multi-resonant broadband hot spots.
Discussion
We have shown that theexcitationproperties of surface-enhanced nonlinear supercontinuum hot spots in rough silver films grown by
1.3 1.4 1.5 1.6 1.7 1.8
0 1
Emission Intensity
Excitation Energy (eV)
-8 -4 0 4 8
-8 -4 0 4 8
Xc (nm)
Yc (nm) 0 5 10 15 20 25 30
0 4 8 12 16
Δr (nm)
Occurrence
1 2 3
4 5
1 2 3 4
5
Δr
a b
c
<Δr> = 9.8 nm d
Figure 4|Super-resolution localization microscopy of single multi- resonant nonlinear hot spots. (a) The centroid of the diffraction-limited hot spot image is extracted from a two-dimensional Gaussian fit.
(b) Excitation spectrum of a single hot spot with corresponding microscope images. The hot spot centroid at each resonance was recorded 20 times in an alternating fashion. (c) Resulting spatial localization of the hot spot at each resonance with respect to the average value, illustrating that the centroid at each resonance is localized within a region of,6 nm.
Repeating this measurement for 5 additional hot spots that included 25 distinct resonances provides a distribution of spatial shifts of the centroid position between resonances and shows that multi-resonant hot spots are localized within an average region of,10 nm.
the Tollens reaction reflect the signatures of the plasmonic reso- nances within these systems. For the low-coverage films that consist of well-separated silver islands, excitation spectroscopy and polar- ization anisotropy reveal that the hot spots form by diffractive coup- ling of the LSPRs of the individual nanoparticles. Signatures of non-diffractive delocalized plasmon resonances in the higher- coverage films that are near the percolation threshold are found in spectral narrowing of the resonance and a reduction in number of both hot spots that can be excited with electric fields orientedparallel to the sample plane, and hot spots that have reduced excitation polarization anisotropy. We conclude that delocalized modes have narrow resonances, are highly polarized in excitation and are max- imally excited with electric fields that are oriented normalto the sample plane. At the highest surface coverage, the resonances of single hot spots are surprisingly narrow with widths as small as 13 meV. The excitation spectra exhibit multiple, discrete resonances between 1.15–1.83 eV (1080–680 nm). Emission spectroscopy and super-resolution microscopy of the hot spots at their individual excitation resonances indicate that the emission at each resonance of one hot spot is localized to the same spatial region of the film within less than 10 nm. The supercontinuum generation appears to originate from a structural anomaly that is not readily identified with electron microscopy. In addition to providing a nearly background- free, non-invasive and non-perturbative probe of the plasmon reso- nances in these complex systems and unravelling their underlying structure-property relationships, nonlinear optical microscopy of single hot spots highlights the presence of extraordinarily high qual- ity factor, multi-resonant plasmonic excitations as was recently pre- dicted in evolutionary simulations of optical nanoantennae18. Methods
Film growth.The growth process described by Saitoet al.27was followed for the fabrication of Tollens films used in this work. Briefly, separate solutions of a silver- nitrate-based reagent and glucose were prepared in ultra-pure water. By combining the two solutions under ambient conditions (i.e., at room temperature and atmospheric pressure), the glucose reduces the reagent resulting in the deposition of silver on any glass surface in contact with the progressing reaction. Thus, by immersing a cleaned glass microscope coverslip into the solution, a silver film is deposited on the glass to form a Tollens substrate. The duration that the coverslip spends immersed in the reaction is defined as the growth time.
Nonlinear excitation measurements.The excitation source (a Coherent Chameleon Ultra II Ti-Sapphire laser) produced excitation pulses with an average temporal width of 140 fs at an 80 MHz repetition rate and was tuneable between 1.82 eV and 1.15 eV. The average spectral width of the excitation laser over the excitation range was 10 meV. The angle of incidence was 60u, and the orientation of the linear polarization was controlled with an achromaticl/2 wave plate. Visible optical emission from the silver films was collected with a long working-distance objective (Olympus, 403), passed through a short-pass emission filter that blocked light at energies below 1.90 eV, and imaged on a cooled charge-coupled device camera (Photometrics Coolsnap HQ2) that was attached to an imaging spectrometer (PI Acton). All of the measurements were conducted in vacuum at room temperature. See theSupplementary Informationfor a list of the excitation densities used throughout this work. The FWHM of each resonance peak in the spectrum was determined by estimating the width of the peak at its half maximum using linear interpolation between neighbouring data points. The polarization modulation curves were analyzed by fitting a cos4curve to extract the values described in the text.
Determination of in-plane dipole orientation.See theSupplementary Information.
Filling factor calculation.See theSupplementary Information.
Localization analysis.See theSupplementary Information.
1. Aeschlimann, M.et al. Coherent two-dimensional nanoscopy.Science333, 1723–1726 (2011).
2. Stockman, M. I., Faleev, S. V. & Bergman, D. J. Coherent control of femtosecond energy localization in nanosystems.Phys. Rev. Lett.88, 067402 (2002).
3. Barnes, W. L., Dereux, A. & Ebbesen, T. W. Surface plasmon subwavelength optics.Nature424, 824–830 (2003).
4. Stockman, M. I. Nanoplasmonics: past, present, and glimpse into future.Opt.
Express19, 22029–22106 (2011).
5. Halas, N. J., Lal, S., Chang, W.-S., Link, S. & Nordlander, P. Plasmons in strongly coupled metallic nanostructures.Chem. Rev.111, 3913–3961 (2011).
6. Willets, K. A. & Van Duyne, R. P. Localized surface plasmon resonance spectroscopy and sensing.Annu. Rev. Phys. Chem.58, 267–297 (2007).
7. Kneipp, K.et al. Single molecule detection using surface-enhanced Raman scattering (SERS).Phys. Rev. Lett.78, 1667–1670 (1997).
8. Nie, S. & Emory, S. Probing single molecules and single nanoparticles by surface- enhanced Raman scattering.Science275, 1102–1106 (1997).
9. Wang, Z. & Rothberg, L. J. Structure and dynamics of single conjugated polymer chromophores by surface-enhanced Raman spectroscopy.ACS Nano1, 299–306 (2007).
10. Walter, M. J.et al. Simultaneous Raman and fluorescence spectroscopy of single conjugated polymer chains.Phys. Rev. Lett.98, 137401 (2007).
11. Palomba, S. & Novotny, L. Near-field imaging with a localized nonlinear light source.Nano Lett.9, 3801–3804 (2009).
12. Chaudhuri, D.et al. Toward subdiffraction transmission microscopy of diffuse materials with silver nanoparticle white-light beacons.Nano Lett.9, 952–956 (2009).
13. Noginov, M. A.et al. Demonstration of a spaser-based nanolaser.Nature460, 1110–1112 (2009).
14. Anker, J. N.et al. Biosensing with plasmonic nanosensors.Nat. Mater.7, 442–453 (2008).
15. Kelly, K. L., Coronado, E., Zhao, L. L. & Schatz, G. C. The optical properties of metal nanoparticles: The influence of size, shape, and dielectric environment.
J. Phys. Chem. B107, 668–677 (2003).
16. Davis, T. J., Vernon, K. C. & Go´mez, D. E. Designing plasmonic systems using optical coupling between nanoparticles.Phys. Rev. B79, 155423 (2009).
17. Markel, V. A.et al. Near-field optical spectroscopy of individual surface-plasmon modes in colloid clusters.Phys. Rev. B59, 10903–10909 (1999).
18. Feichtner, T., Selig, O., Kiunke, M. & Hecht, B. Evolutionary optimization of optical antennas.Phys. Rev. Lett.109, 127701 (2012).
19. Gre´sillon, S.et al. Experimental observation of localized optical excitations in random metal-dielectric films.Phys. Rev. Lett.82, 4520–4523 (1999).
20. Shalaev, V. M.Nonlinear Optics of Random Media: Fractal Composites and Metal Dielectric Films.Springer, Berlin, (2000).
21. Maaroof, A. I. & Sutherland, D. S. Optimum plasmon hybridization at percolation threshold of silver films near metallic surfaces.J. Phys. D: Appl. Phys.43, 405301 (2010).
22. Stockman, M. I., Faleev, S. V. & Bergman, D. J. Localization versus delocalization of surface plasmons in nanosystems: Can one state have both characteristics?
Phys. Rev. Lett.87, 167401 (2001).
23. Genov, D. A., Shalaev, V. M. & Sarychev, A. K. Surface plasmon excitation and correlation-induced localization-delocalization transition in semicontinuous metal films.Phys. Rev. B72, 113102 (2005).
24. Seal, K.et al. Near-field intensity correlations in semicontinuous metal-dielectric films.Phys. Rev. Lett.94, 226101 (2005).
25. Seal, K.et al. Coexistence of localized and delocalized surface plasmon modes in percolating metal films.Phys. Rev. Lett.97, 206103 (2006).
26. Krachmalnicoff, V., Castanie`, E., De Wilde, Y. & Carminati, R. Fluctuations of the local density of states probe localized surface plasmons on disordered metal films.
Phys. Rev. Lett.105, 183901 (2010).
27. Saito, Y., Wang, J., Batchelder, D. & Smith, D. Simple chemical method for forming silver surfaces with controlled grain sizes for surface plasmon experiments.Langmuir19, 6857–6861 (2003).
28. Borys, N. J. & Lupton, J. M. Surface-enhanced light emission from single hot spots in Tollens reaction silver nanoparticle films: Linear versus nonlinear optical excitation.J. Phys. Chem. C115, 13645–13659 (2011).
29. Novotny, L. & Hecht, B.Principles of Nano-Optics.Cambridge University Press, (2006).
30. Thompson, R. E., Larson, D. R. & Webb, W. W. Precise nanometer localization analysis for individual fluorescent probes.Biophys. J.82, 2775–2783 (2002).
31. Borys, N. J., Walter, M. J. & Lupton, J. M. Intermittency in second-harmonic radiation from plasmonic hot spots on rough silver films.Phys. Rev. B80, 161407 (2009).
32. Chang, W.-S., Ha, J. W., Slaughter, L. S. & Link, S. Plasmonic nanorod absorbers as orientation sensors.Proc. Natl. Acad. Sci. U. S. A.107, 2781–2786 (2010).
33. Wang, Z., Pan, S., Krauss, T. D., Du, H. & Rothberg, L. J. The structural basis for giant enhancement enabling single-molecule Raman scattering.Proc. Natl. Acad.
Sci. U. S. A.100, 8638–8643 (2003).
34. Imura, K., Okamoto, H., Hossain, M. K. & Kitajima, M. Visualization of localized intense optical fields in single gold-nanoparticle assemblies and ultrasensitive Raman active sites.Nano Lett.6, 2173–2176 (2006).
35. Koen, K. A., Weber, M. L., Mayer, K. M., Fernandez, E. & Willets, K. A. Spectrally- resolved polarization anisotropy of single plasmonic nanoparticles excited by total internal reflection.J. Phys. Chem. C116, 16198–16206 (2012).
36. Khunsin, W.et al. Long-distance indirect excitation of nanoplasmonic resonances.Nano Lett.11, 2765–2769 (2011).
37. Pinchuk, A. O. & Schatz, G. C. Nanoparticle optical properties: Far- and near-field electrodynamic coupling in a chain of silver spherical nanoparticles.Mat Sci Eng B-Solid149, 251–258 (2008).
38. Wiersma, D. S., Bartolini, P., Lagendijk, A. & Righini, R. Localization of light in a disordered medium.Nature390, 671–673 (1997).
39. Shi, Z.et al. Surface-plasmon polaritons on metal-dielectric nanocomposite films.
Opt. Lett.34, 3535–3537 (2009).
40. Sarychev, A. K. & Shalaev, V. M. Theory of nonlinear optical responses in metal- dielectric composites.Topics Appl. Phys.82, 169–184 (2002).
41. Bosbach, J., Hendrich, C., Stietz, F., Vartanyan, T. & Tra¨ger, F. Ultrafast dephasing of surface plasmon excitation in silver nanoparticles: Influence of particle size, shape, and chemical surrounding.Phys. Rev. Lett.89, 257404 (2002).
42. Hu, M.et al. Dark-field microscopy studies of single metal nanoparticles:
understanding the factors that influence the linewidth of the localized surface plasmon resonance.J. Mater. Chem.18, 1949–1960 (2008).
43. Sherry, L. J., Jin, R., Mirkin, C. A., Schatz, G. C. & Van Duyne, R. P. Localized surface plasmon resonance spectroscopy of single silver triangular nanoprisms.
Nano Lett.6, 2060–2065 (2006).
44. Auguie´, B. & Barnes, W. L. Collective resonances in gold nanoparticle arrays.Phys.
Rev. Lett.101, 143902 (2008).
45. Chu, Y., Schonbrun, E., Yang, T. & Crozier, K. B. Experimental observation of narrow surface plasmon resonances in gold nanoparticle arrays.Appl. Phys. Lett.
93, 181108 (2008).
46. Kravets, V. G., Schedin, F. & Grigorenko, A. N. Extremely narrow plasmon resonances based on diffraction coupling of localized plasmons in arrays of metallic nanoparticles.Phys. Rev. Lett.101, 087403 (2008).
47. Awada, C., Barbillon, G., Charra, F., Douillard, L. & Greffet, J. J. Experimental study of hot spots in gold/glass nanocomposite films by photoemission electron microscopy.Phys. Rev. B85, 045438 (2012).
48. Cang, H.et al. Probing the electromagnetic field of a 15-nanometre hotspot by single molecule imaging.Nature469, 385–388 (2011).
49. McLeod, A.et al. Nonperturbative visualization of nanoscale plasmonic field distributions via photon localization microscopy.Phys. Rev. Lett.106, 037402 (2011).
50. Weber, M. L. & Willets, K. A. Correlated super-resolution optical and structural studies of surface-enhanced Raman scattering hot spots in silver colloid aggregates.J. Phys. Chem. Lett.2, 1766–1770 (2011).
51. Weber, M. L., Litz, J. P., Masiello, D. J. & Willets, K. A. Super-resolution imaging reveals a difference between SERS and luminescence centroids.ACS Nano6, 1839–1848 (2012).
52. Peyser, L. A., Vinson, A. E., Bartko, A. P. & Dickson, R. M. Photoactivated fluorescence from individual silver nanoclusters.Science291, 103–106 (2001).
Acknowledgements
The authors would like to thank Randy Polson for assistance with the SEM characterization of the samples and Alex Thiessen for numerous helpful discussions. This work was funded by a Scialog award of the Research Corporation for the Advancement of Science.
Author contributions
N.J.B. performed the experiment and measurement analysis. E.S. and J.M.L. contributed to the discussion and measurement analysis. All authors contributed to the preparation of the manuscript.
Additional information
Supplementary informationaccompanies this paper at http://www.nature.com/
scientificreports
Competing financial interests:The authors declare no competing financial interests.
How to cite this article:Borys, N.J., Shafran, E. & Lupton, J.M. Surface plasmon delocalization in silver nanoparticle aggregates revealed by subdiffraction supercontinuum hot spots.Sci. Rep.3, 2090; DOI:10.1038/srep02090 (2013).
This work is licensed under a Creative Commons Attribution-
NonCommercial-NoDerivs 3.0 Unported license. To view a copy of this license, visit http://creativecommons.org/licenses/by-nc-nd/3.0