J. Clin. Chem. Clin. Biochem.
Vol. 26, 1988, pp. 141-146
© 1988 Walter de Gruyter & Co.
Berlin · New York
Blood Glucose, Lactate, Pyruvate, Glycerol, 3-Hydroxybutyrate
and Acetoacetate Measurements in Man Using a Centrifugal Analyser with a Fluorimetric Attachment
By J. Harrison. A. W. Hudson, A. W. Skillen, R. Stappenbeck
Department of Clinical Biochemistry and Metabolic Medicine, Medical School, Newcastle upon Tyne L. Agius and K. G. M. M. Alberti
Department of Medicine, Medical School, Newcastle upon Tyne, UK
(Received October 20, 1987 / February 5, 1988)
Summary: Methods are described for the analysis of glucose, lactate, pyruvate, alanine, glycerol, 3-hydroxy-
butyrate and acetoacetate in perchloric acid extracts of human blood, using the Cobas Bio centrifugal analyser fitted with a fluorimetric attachment. Intra-assay and inter-assay coefficients of variation ranged from 1.9 to 7.9% and from 1.0 to 7.2% respectively. Correlation coefficients ranged from 0.96 to 0.99 against established continuous-flow and manual spectrophotometric methods. All seven metabolites can be measured using a single perchloric acid extract of 20 μΐ of blood. The versatility of the assays is such that as little as 100 pmol pyruvate, 3-hydroxybutyrate or as much as 15 nmol glucose can be measured in the same 20 μΐ extract.
In relation to budgetary control the centrifugal analyser methods are quicker, less labour intensive, and more economical with both small and large numbers of samples.
Introduction
Several automated photometric (1) and fluorimetric (2 — 5) techniques have been developed to measure intermediary metabolites. Routinely in our laboratory blood glucose, lactate, pyruvate, alanine, glycerol and 3-hydroxybutyrate have been measured at room tem- perature using continuous-flow fluorimetric methods (6). Up to three different metabolites can be measured simultaneously in this system. It is relatively simple and inexpensive to operate and is capable of higher inter^ and intra-assay precision with large numbers of easily prepared samples.
A major disadvantage of the continuous-flow meth- ods is the need of an additional analytical "run" to assess sample "blanks". Other problems include the inaccuracies and tedium involved in matching large numbers of "blank" to "test" fluorescence peaks as well as measuring them. Alternative systems, which
might overcome these disadvantages and yet still able to handle large numbers of samples, were considered.
The most promising appeared to be a centrifugal fast analyser with a fluorescence detection accessory. A Cobas Bio with a fluofimeter attachment was ac- quired, appropriate methods developed and evaluated in comparison with the corresponding continuous flow methods. The main advantage of the fluorimetric centrifugal fast analyser is that the concentration of all seven metabolites can be reliably determined on a perchloric acid extract of 20 μΐ of blood.
Materials and Methods
Lithium lactate grade L-X, sodium pyruvate Type II, lithium acetoacetate and Ζ,-alanine were obtained from Sigma Ltd.
(Poole, Dorset, UK), NAD, NADH, NADP, ATP, £>,JL-3-hy- droxybutyrate (monosodium salt), lactate dehydrogenase (pig heart - Cat No 107069), hexokinase (yeast - Cat No 127817),
142 Harrison et al.: Blood metabolite measurements using a fluorimetric centrifugal analyse-r.
L-alanine dehydrogenase (B. subtilis - Cat No 102636), gly- cerokinase (Candida mycoderma - Cat No 127795), 3-hydroxy- butyrate dehydrogenase (Rhodopseudomonas spheroides — Cat No 737054), glycerol-3-phosphate dehydrogenase (rabbit mus- cle — Cat No 127752) and glucose-6-phosphate dehydrogenase (yeast - Cat No 127671) from BCL (Lewes, East Sussex, UK) with glycerol (AR), glucose (50 mmol/1 in saturated i. e. 5 g/1 benzoic acid), perchloric acid - 600 g/kg (AR) and all other chemicals from BDH (Poole, UK).
Sample preparation
About 1.5—2 ml of whole blood is added to a preweighed plastic tube containing 5 ml of 0.77 mol/1 perchloric acid pre- viously cooled to 0 °C. After mixing the tube is reweighed, centrifuged at 2500 g for 5 min and the protein-free supernatant removed. The dilution of the blood is determined by the weight changes measured. Alternatively 0.5 ml whole blood may be added volumetricaily to 2 ml 0.77 mol/1 perchloric acid and the weighing omitted. Part of the supernatant is placed in an Autoanalyzer cup and the remainder stored in another plastic tube at —20 °C. For the metabolites, other than acetoacetate, analysis of the samples in the Autoanalyzer cups is carried out immediately or they are stored at —20 °C. Analysis for aceto- acetate is carried out immediately or the samples are stored at -70 °C but for not longer than 3 days.
Continuous flow analyses
These are carried out essentially as described earlier (6) with 0.46 mol/1 perchloric acid used to prepare the standards.
Acetoacetate
A modified manual method for the determination of acetoac- etate is based on that described by Williamson et al. (7). One ml of perchloric acid extract is put into a weighed plastic tube and reweighed. Universal indicator (BDH Cat No 21049) is added, mixed and the perchloric acid neutralized to a yellow colour with 3.5 mol/1 and 0.35 mol/1 KOH. The tube is centri- fuged and re-weighed to determine the dilution of the original sample. The supernatant is used for analysis. To determine the acetoacetate content, 500 μΐ of the neutralized extract is added to 1 ml of 0.42 mmol/1 NADH in 0.1 mol/1 potassium phosphate buffer, pH 7.0, and 500 μΐ water. The absorbance is measured against a blank containing 0.21 mmol/1 NADH immediately at 340 nm using a Zeiss PMQ3/MQ/3 spectrophotometer (Carl Zeiss, Woodfield Road, Welwyn Garden City, Herts., UK) and again at 30 min, at room temperature, after adding 300 mU of 3-hydroxybutyrate dehydrogenase to determine the decrease.
Blanks are also prepared omitting the neutralized perchloric acid extract to determine enzyme interaction with the buffered coenzyme reagent. The acetoacetate content is calculated using the molar lineic absorbance of NADH of 622 m2/mol. Stand- ards are prepared using solutions of acetoacetate in 0.46 mol/1 perchloric acid over the range of 25 — 100 μιηόΐ/ΐ which are treated in the same way as the perchloric acid extracts.
Centrifugal analyser
The instrument used is a Cobas Bio (Roche Products Ltd., Welwyn Garden City, UK). All the analysis program parame- ters are shown in table 1. The assays for alanine, glycerol and 3-hydroxybutyrate were initial rate methods, those for aceto- acetate and pyruvate end-point methods and those for glucose and lactate two-point analyses using the instruments own curve- fitting programme for appropriate standards. The buffers used are the same as for the continuous-flow methods for the me- tabolites other than acetoacetate. Modifications, however, are made in the composition of the coenzyme/enzyme reagents as follows:
Acetoacetate
Coenzyme reagent: 500 μΐ 0.75 g/i NADH in 0.3 mol/1 potas- sium phosphate buffer pH 7.4 is added to 20 ml of the same buffer.
Enzyme reagent ("start" solution): 200 μΐ 3-hydroxybutyrate dehydrogenase (7.5 U) is added to 400 μΐ water.
To set PM voltage use water as sample arid! 'a* coenzyme reagent containing: 650 μΐ 0.75 g/l NADH in 0.3 mol/1 potassium phosphate buffer pH 7.4 added to 20 ml of the same buffer.
Alanine
Buffer: 0.04 mol/1 TRIS, 1 mol/1 hydrazine hydrate, 1.34 mmol/1 EDTA (disodium salt) adjusted to pH 10.0 with 10 mol/1 hy- drochloric acid.
Enzyme reagent: 20 rng NAD and 100 μΐ alanine dehydrpgenase (12 U) in 10 ml 0.1 mol/1 phosphate buffer pH 7.4. The working reagent is prepared by adding 0.7 ml of this solution to 8.8 ml of the buffer. This dilution is freshly prepared for each batch of analyses and is warmed to 25 °C before use.
To set PM voltage use top standard (300 μιηρί/ΐ).
Glucose
Buffer: 0.1 mol/1 triethanolamine, 2 inmol/l magnesium chlo- ride, adjusted to pH 8.0 with 10 mot/1 hydrochloric acid.
Enzyme reagent: 32 mg NADP, 37 mg ATP (disodium salt), 100 μΐ hexokinase (140 U) and 100 μΐ glucose-6-phosphate dehydrogenase (70 ) in 10 nil 0.4 mol/1 triethanolamine buffer, pH 7.4.
To set PM voltage use top standard (3 mmol/1).
Glycerol
Buffer: 0.2 mol/1 glycine, 1 mol/1 hydrazine hydrate, 10 mmol/1 magnesium chloride brought to pH 9.5 with 10 mol/1 sodium hydroxide.
Enzyme reagent: 20 mg NAD, 20 mg ATP (disodium salt), 50 μΐ glycerokinase (21.3U) and 100 μΐ glycerol-3-phosphate de- hydrogenase (170 U) in 10 ml 0.4 mol/1 triethanolamine buffer, pH 7.4; 0.7 ml of this reagent added to 8.8 ml of the buffer for analysis. This mixture is prepared immediately before use and should be at 25 °C when applied to the analyser.
To set PM voltage use the top standard (120 μιηοΐ/ΐ).
Pyruvate
Buffer: 0.4 mol/1 triethanolammonium chloride, 10 mmol/1 di- sodium EDTA adjusted to pH 7.4 with 10 mol/1 sodium hy- droxide.
Coenzyme reagent: 50 μΐ l g/l NADH in 0.1 mol/1 phophate buffer, pH 7.4 is added to 16 ml of the triethanolamine buffer.
Enzyme reagent ("start" solution): 50 μΐ lactate dehydrogenase (150 U) is added to 8 ml 0.1 mol/1 phosphate buffer, pH 7.4.
To set PM voltage use water as sample.
Lactate
Buffer: 0.5 mol/1 glycine, 0.2 mol/1 hydrazine hydrochloride, 5.4 mmol/1 disodium EDTA adjusted to pH 9.6 with 10 mol/1 sodium hydroxide.
Enzyme reagent: 50 mg NAD and 500 μΐ lactate dehydrogenase (1500 L[) in 5 ml 0.1 mol/1 phosphate buffer, pH 7.4.
To set PM voltage use top standard (1.2 rntnol/1).
J. Clin. Chem. Clin. Biochem. / Vol. 26,1988 / No. 3
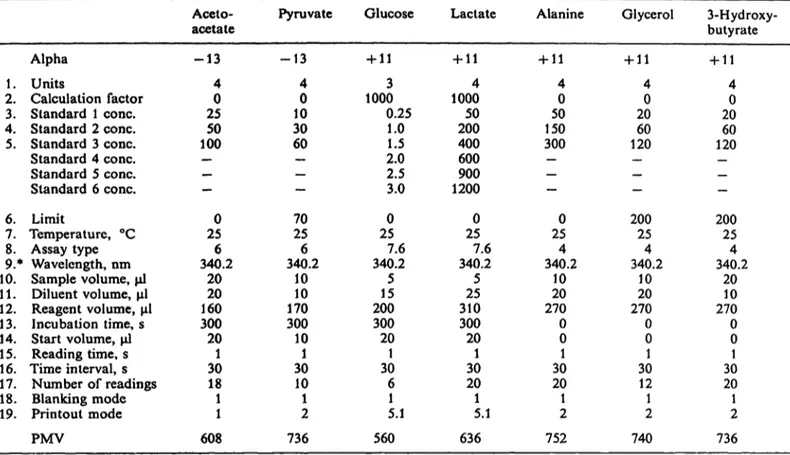
Tab. 1. Program parameters for metabolite measurement on the Cobas Bio centrifugal analyser Aceto-
acetate Pyruvate Glucose Lactate Alanine Glycerol 3-Hydroxy- butyrate Alpha -13 -13 +11 +11 +11 +11 +11
1 . Units 4 4 3 4 4 4 4
2. Calculation factor 0 0 1000 1000 0 0 0 3. Standard 1 cone. 25 10 0.25 50 50 20 20 4. Standard 2 cone. 50 30 1.0 200 150 60 60 5. Standard 3 cone. 100 60 1.5 400 300 120 120 Standard 4 cone. - - 2.0 600 - - - Standard 5 cone. - — 2.5 900 _ — _ Standard 6 cone. - — 3.0 1200 — _ _ 6. Limit 0 70 0 0 0 200 200 7. Temperature, °C 25 25 25 25 25 25 25 8. Assay type 6 6 7.6 7.6 4 4 4 9.* Wavelength, nm 340.2 340.2 340.2 340.2 340.2 340.2 340.2 10. Sample volume, μΐ 20 10 5 5 10 10 20 11. Diluent volume, μΐ 20 10 15 25 20 20 10 12. Reagent volume, μΐ 160 170 200 310 270 270 270 13. Incubation time, s 300 300 300 300 0 0 0 14. Start volume, μΐ 20 10 20 20 0 0 0
1 5 . Reading time, s 1 1 1 1 1 1 1
16. Time interval, s 30 30 30 30 30 30 30 17. Number of readings 18 10 6 20 20 12 20
1 8 . Blanking mode 1 1 1 1 1 1 1
19. Printout mode 1 2 5.1 5.1 2 2 2 PMV 608 736 560 636 752 740 736 All concentrations are in μιηοΐ/ΐ except for glucose which are in mmol/1.
* The excitation wavelength was 340 nm and the emission wavelength was 470 nm. The setting 340.2 identifies that the emission filter in position No 2 is used.
3-Hydroxybutyrate
Buffer: 0.1 mol/1 TRIS, 1 mol/I hydrazine hydrate, 2.7 mmol/1 EDTA (disodium salt) adjusted to pH 8.5 with 10 mol/1 hydro- chloric acid.
Enzyme reagent: 10 mg NAD and 350 μΐ 3-hydroxybutyrate dehydrogenase (7.5 U) in 5 ml 0.1 mol/1 phosphate buffer, pH 7.4. The working reagent is prepared by adding 0.7 ml of this solution to 8.8 ml of the buffer.
To set PM voltage use top standard (120 μπιοΙ/1).
Standard solutions
Stock standards 100 mmol/1 lithium lactate, 10 mmol/1 sodium pyruvate, 10 mmol/1 S^hydrpxybutyrate, 100 mmol/1 glycerol, 10 mmol/1 acetoacetate and 250 mmol/1 alanine are prepared in deionised-distilled water and diluted to the appropriate work- ing level with 0.46 mol/1 perchloric acid. The glucose standard is commercially available as 50 mmol/1 in approximately 5 g/1 benzoic acid and is also diluted to the appropriate working level with the same perchloric acid solution. All standards are stored in a refrigerator at 4 °C. The working standards shown in table 1 are in μπιοί/Ι except for glucose which is in mmol/1.
Results
The intra-assay precision for each method was as- sessed by filling two sample racks, one with a per- chloric acid extract of blood containing a "low" con- centration of the metabolite and the other with a similar extract but with a "high" concentration of the metabolite. The results are given in table 2.
Tab. 2. Intra- and inter-assay imprecision of analyses Intra-assay
η = 24
Alanine
3-Hydroxybutyrate Glycerol
Glucose Lactate Pyruvate Acetoacetate
X
μηιοΐ/ΐ 23764
9412 10020 25001100 1085146
4716 53
cv %
2.33.0 6.52.1 7.92.3 2.65.4 6.06.1 3.51.9 5.8
Inter-assay η = 22
X
μπιοΐ/l 23965
9612 10120 25401090 979149 176
—
CV
%
2.73.0 4.51.0 5.23.0 2.84.2 6.13.7 29.86.3
—
Intra-assay variation was carried out in a single run on the analyser and inter-assay variation over a 3 week period
Inter-assay precision was assessed by measuring two
pooled perchloric acid extracts on separate occasions,
fresh reagents being prepared for each assay. The
results are shown in table 2. Coefficients of variation
ranged from 1.0 to 7.2%.
144
Harrison et al.: Blood metabolite measurements using a fluorimetric centrifugal analyserThe correlations between the results obtained by
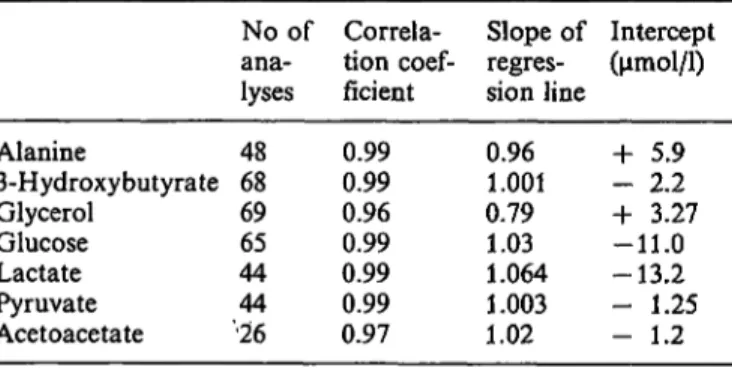
Cobas Bio and continuous-flow methods are pre- sented in table 3. It can be seen that there was a close correlation for all metabolites with the slope of the relationship differing significantly from unity only for acetoacetate and glycerol.
Tab. 3. Correlation of metabolite results obtained with the Cobas Bio analyser compared with the continuous-flow analyser.
For the regression line y = bx 4- c the slope and intercept are also indicated.
Acetoacetate was correlated against a manual spectro- photometric method.
Alanine
3-Hydroxybutyrate Glycerol
Glucose Lactate Pyruvate Acetoacetate
No of ana-lyses 4868 6965 4444
•26
Correla- tion coef- ficient 0.990.99 0.960.99 0.990.99 0.97
Slope of regres- sion line 0.961.001 0.791.03 1.064 1.003 1.02
Intercept oimol/1) + 5.9 - 2.2 + 3.27 -11.0 -13.2 - 1.25 - 1.2
Discussion
Glucose is the most frequently measured intermediary metabolite in blood. Other intermediates of carbo- hydrate metabolism are also of pathophysiological and clinical interest. Apart from non-esterified fatty acids the most commonly measured are: lactate, py- ruvate, 3-hydroxybutyrate, acetoacetate, glycerol and alanine. The main need to measure these metabolites currently comes from researchers seeking better un- derstanding of diabetes and other metabolic disorders.
There are many methods available to measure these metabolites. Nearly all are enzymatic and have been shown to be rapid, sensitive and accurate. In some of those described a number of very similar assays are grouped together to measure several metabolites (5, 8 — 11). Keintsch-Engel et al. describe a linked method for the ketone bodies, 3-hydroxybutyrate and aceto- acetate (12). Others measure glycerol (13) and alanine (14) singly as indicators of lipolysis and gluconeoge- nesis from amino acids respectively. Isotope dilution offers advantages when special sampling techniques are required to measure glycerol (15), in contrast to the lack of sample preparation required to measure glucose (16) and lactate (17) by the use of enzyme electrodes.
Any advance in instrumentation tends to be applied to the measurement of metabolites. Recent examples include bioluminescence-linked methods for the meas- urement of glycerol (18). However, there is no best
possible method because a variety of criteria, other than accuracy, must be considered before a method is chosen. The continuous-flow methods (6) which we have used previously have certain attributes which taken together make them very useful. The advan- tages include: the ability to handle large numbers of samples by automation, measurement of a variety of metabolites simultaneously, on the same sample by similar methods, as well as the usual requirements of precision and specificity.
The methods we have developed for the centrifugal analyser were designed to give comparable results and needed to be at least, as precise as the continuous- flow methods. Efforts were primarily directed to pro- duce economical and quick, rather than optimised methods and thus initial-rate rather than end-point or two-point, methods were chosen. We have previ- ously commented on the problem of using perchloric acid extracts of blood (19). Perchloric acid interferes with enzymatic assays particularly initial rate meth- ods. In the methods described here the small volume of perchloric acid extract used as sample reduces the concentration of perchloric acid within the assay to within the range 7 to 46 mmol/1 and thus helps to reduce the inhibitory effect of the perchloric acid. The use of end-point methods for all seven metabolites would overcome the problems of perchloric acid but this would mean much longer incubation times and the use of much higher concentrations of enzymes making the assays correspondingly slower and more expensive.
Hansen & Freier (19) have described methods for
assay of the lactate, pyruvate, 3-hydroxybutyrate and acetoacetate concentrations of plasma using a spec- trophotometric centrifugal fast analyser. Our fluori- metric techniques allow lower concentrations of these metabolites to be measured with improved precision.
For example with 3-hydroxybutyrate the spectropho- tometric analyser gave between batch imprecision of 10% at 44 μιηοΐ/ΐ (20) whereas we found 4.5% at 12 μηιοΐ/ΐ and 1.0% at 93 μηκ>1/1.
The intra-assay precision was the worst for the esti- mation of lactate. This probably reflects the use of a
"two-point" assay, the reaction not having gone to completion, and the instrument's own programs for data calculation from non-linear standard curves.
Only the glucose and lactate assays require these
programs, the other assays providing linear standard
curves. Inter-assay precision for most analyses was
excellent. Inter-assay precision studies were not car-
ried out for acetoacetate analysis because of the inst-
ability
aof this metabolite in low concentration espe-
cially in solutions containing even sjp ll amounts of
J. Clin. Chem. Clin. Biochem. / Vol. 26,1988 / No. 3protein. Overall precision was at least as good as obtained by other methods and at the higher concen- trations much better.
Excellent correlation was obtained between the values obtained with the continuous flow and centrifugal fast analysers and apart from the acetoacetate and glycerol assays the slope of the regression line was close to unity. For acetoacetate the explanation of this deviation may lie in the inherent instability of this metabolite but for glycerol may lie in the calcu- lation procedure. Glycerol is analysed using a rate- reaction method but the calibration curve shows sig- nificant curvature suggesting sub-optimal conditions.
In relation to this assay it is important that the enzyme reagent is freshly prepared and pre-warmed to 25 °C before use.
Regression analysis showed positive intercepts for alanine and glycerol but these were small in relation to the levels usually found in blood. The negative intercept for the lactate assay is also small in relation to usual blood levels. The reason for these intercepts is unclear but again may be due to the calculation procedures used by the microprocessor in the Cobas Bio to calculate the substrate concentrations. For acetoacetate the correlation against a manual spec- trophotometric method (7) as a satisfactory continu- ous-flow method is unavailable.
One disadvantage of the continuous-flow methods is the need for two autoanalyser "runs" to be made: one to determine the concentration of the substrate pres- ent, and the other to determine the instrinsic or
"blank" fluorescence in the blood extracts. This
"blank" can range from the barely detectable to amounts above the top standard in the range used.
Another disadvantage with the continuous-flow meth- ods is the need to draw calibration graphs and com- pare large numbers of peaks which is necessarily time- consuming and a notorious source of error. The tecU ium of the analyst and the calculation errors can be very much reduced by using an appropriate program and a microcomputer to process the fluorimeter data (20). A major advantage of the Cobas Bio analyser
is that the instrument automatically takes sample blanks into account thus eliminating "blank" runs.
This results in a very considerable saving of time and reagents so that analysis of batches of all six metab- olites takes less than half the time used with the continuous-flow methods. Measuring acetoacetate by the Cobas Bio analyser is very much quicker than the manual or automated spectrophotometric methods previously described (7 — 12).
The fluorimetric methods we have described are ex- tremely sensitive and readily assay as little as 100 pmol of pyruvate, 200 pmol of 3-hydroxybutyrate and 400 pmol of glycerol. There is, generally, enough glucose and lactate in our samples for much less sensitive methods to be used. However, to eliminate an extra source of error the methods have been de- signed so that the whole group of analyses can be done without further dilution of the intial perchloric acid extract. The volume of perchloric acid extract needed to carry out all seven analyses is about 100 μΐ which represents 20 μΐ or less of blood and is much less than that required for the continuous-flow system.
By using less sample, reagent costs including partic- ularly expensive enzyme preparations is approxi- mately one third of those needed for the continuous- flow system. Operation of the Cobas Bio, however, does require the use of disposable rotors and the cost of these makes analysis only about 20% less expensive overall than the continuous-flow system. The use of small samples entails an increased possibility that end- point analyses are feasible.
With the Cobas Bio, a change from one metabolite method to another can be made very quickly. There- fore it is possible to analyse small numbers of samples for a variety of different metabolites quickly, whereas the continuous-flow system is most economical of time and reagents when relatively long "runs" are made. Thus the Cobas Bio allows greater flexibility in the choice of the methods available as well as being more user-friendly. In practice we have found that analysts become proficient in the use of the Cobas Bio in a very much shorter time than that necessary with the continuous-flow system.
References
1. Asrow, G. (1969) Anal Biochein 28, 130-137.
2. Antonis, A., Clark, M. & Pilkington, T. R. E. (1966) J.
Lab. Clin, Med. 68, 340-346.
3. Cramp, D. G. (1970) J. Med. Lab. Techno). 27, 359-365.
4. Lesse, H. J. & Bronk, J. R. (1972) Anal. Biochein. 45, 211-216.
5. Ozand, P. T., Hawkins, R. L., Collins, R. M. Jr., Tildon, J. T. & Comblath, M. (1975) Biochem. Med. 14, 170-183.
6. Lioyd, B., Burrin, J. M., Smyth, P. & Alberti, K. G. M.
M. (1978) Clin. Chem. 24, 1724-1729.
7. Williamson, D. H., Mellanby, J. & Krebs, H. A. (1962) Biochem. J. 82, 90—98.
8. Cuthbert, C. & Alberti, K. G. M. M. (1978) Clin. Chim.
ActaP , 179-186.
9. Maughan, R. J. (1982) Clin. Chim. Acta 722, 231 -240.
10. Li, P. K., Lee, S. T., Macgillivray, M. H., Schaefer, P. A.
& Siegel, J. H. (1980) Clin. Chem. 26, 1713-1717.
11. Weicker, H., Hagele, H. & Kornes, B. (1984) Int, J. Sports Med. 5, 47-54.
146 Harrison et al.: Blood metabolite measurements using a fUuorimetric centrifugal analyser 12. Kientsch, R. I., Siess, E. A. & Wieland, Ο. Η. (1982) Anal. 16. Smith, P. A., Goldfinch, M. E., Sheldon, W. L. & Hodson, Biochem. 723, 270-275. A. W. (1985) Report of the Scientific & Technical Branch, 13. Huber, C. T., Duckworth, W. C. & Solomon, S. S. (1978) Department of Health and Social Security, London, May.
Anal. Biochem. 85, 239-250. 17. Clark, L. C, Npyes, L. K., Grooms, T. A. & Moore, M.
14. Lowry, O. H. & Passoreau, J. V. (1972) In: "A flexible S. (1984) Critical Care Med. 72, 461-464.
system of enzymatic analysis" 1st ed., Academic Press, New 18. Lave, J. T. (1984) Anal. Biochem. 739, 510-515.
York and London p. 149. 19. Hansen, J. L. & Freier, E. R (1978) Clin. Cheni. 24, 475^
15. Bell, J. D., Buxton, I. L. O. & Brunton, L. L. (1984) Anal. 479.
Biochem. 739, 305-308. 20. Hetherington, C. S., Keir, M., Stappenbeck, R., Sinun, A., Brigham, L. L., Skfflen, A. W. & Hodson A. W. (1986) J.
Automatic Chem. 8, 49-55.
Dr. A.W.Skiiien
Dept. of Clinical Biochemistry and Metabolic Medicine Medical School
Newcastle upon Tyne UK
J. Clin. Chem. Clin. Biochem. / Vol. 26,1988 / No. 3