EXPLORING DIMENSIONALITY REDUCTION EFFECTS IN MIXED REALITY FOR ANALYZING TINNITUS PATIENT DATA
Burkhard Hoppenstedt(a), Manfred Reichert(b), Christian Schneider(c), Klaus Kammerer(d), Winfried Schlee(e), Thomas Probst(f), Berthold Langguth(g), Rüdiger Pryss(h)
(a), (b), (d), (h) Institute of Databases and Information System, Ulm University
(c), (e), (g) Department of Psychiatry and Psychotherapy, University of Regensburg
(f) Department for Psychotherapy and Biopsychosocial Health, Danube University, Krems
(a) burkhard.hoppenstedt@uni-ulm.de, (b) manfred.reichert@uni-ulm.de, (c) christian.schneider@gmail.com
(d) klaus.kammerer@uni-ulm.de, (e) winfried.schlee@tinnitusresearch.org,
(f) thomas.probst@donau-uni.ac.at, (g) berthold.langguth@medbo.de, (h) ruediger.pryss@uni-ulm.de
ABSTRACT
In the context of big data analytics, gaining insights into high-dimensional data sets can be properly achieved, inter alia, by the use of visual analytics. Current developments in the field of immersive analytics, mainly driven by the improvements of smart glasses and virtual reality headsets, are one enabler to enhance user-friendly and interactive ways for data analytics.
Along this trend, more and more fields in the medical domain crave for this type of technology to analyze medical data in a new way. In this work, a mixed-reality prototype is presented that shall help tinnitus researchers and clinicians to analyze patient data more efficiently. In particular, the prototype simplifies the analysis on a high-dimensional real-world tinnitus patient data set by the use of dimensionality reduction effects. The latter is represented by resulting clusters, which are identified through the density of particles, while information loss is denoted as the remaining covered variance. Technically, the graphical interface of the prototype includes a correlation coefficient graph, a plot for the information loss, and a 3D particle system.
Furthermore, the prototype provides a voice recognition feature to select or deselect relevant data variables by its users. Moreover, based on a machine learning library, the prototype aims at reducing the computational resources on the used smart glasses. Finally, in practical sessions, we demonstrated the prototype to clinicians and they reported that such a tool may be very helpful to analyze patient data on one hand. On the other, such system is welcome to educate unexperienced clinicians in a better way. Altogether, the presented tool may constitute a promising direction for the medical as well as other domains.
Keywords: immersive analytics, dimensionality reduction, mixed reality, covariance graph 1. INTRODUCTION
Recent developments of smart glasses offer new perspectives in the field of immersive analytics. The
latter is a research field that investigates new display technologies for analytical reasoning (Chandler 2015).
In many cases, augmented reality approaches use a three-dimensional representation of data, which enables the user to recognize spatial contexts of data more easily.
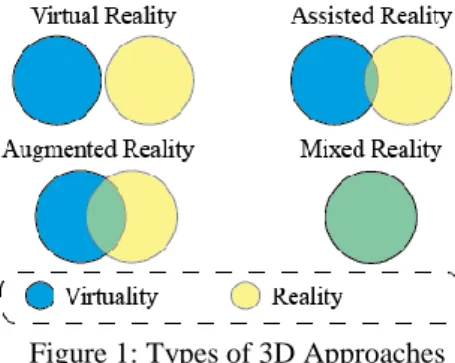
In this context, Figure 1 presents our categorization of different approaches in the field of augmented reality for smart glasses. Note that there exists a variety of other categorizations, such as the so-called Reality- Virtuality Continuum (Milgram 1994).
Figure 1: Types of 3D Approaches
In our categorization, the augmented reality approaches are defined by the degree of overlap between reality and virtuality: First, virtual reality (VR) separates the user from the real world by the use of a headset that simulates an environment that is similar to the real world. Second, assisted reality (ASR) constitutes the concept of appliances (e.g., again headsets) for which the augmented information is not directly in the user’s field of view. Consequently, the augmented information must be actively focused on to obtain further insights.
For example, an industrial maintainer is repairing a machine and needs a clear field of vision. Though, he should be able to check the current machine state with a sideways glance to the edge region of his smart glasses.
Third, in contrast to assisted reality, augmented reality (AR) displays the information directly in the user’s viewing area. Fourth, and most importantly for the work at hand, mixed reality (MR) must be distinguished.
Thereby, the displayed information is integrated into the real world by using the concept of spatial mapping, also denoted as 3D reconstruction (Izadi 2011). Hereby, a room is scanned, usually by the use of depth-sensors, and the resulting, generated model can be used as an interface between holograms and the real world. Note that this concept enables new interaction possibilities in the context of immersive analytics as diagrams to be analyzed can be placed nearly anywhere in the real world. In this context, we discuss the following research question along a high-dimensional data set of tinnitus patients: How does mixed-reality allow quick insights into the effects of dimensionality reduction in large data sets?
To answer this question, first of all, we selected from a variety of dimensionality reduction techniques (Van Der Maaten 2009), the principal component analysis (PCA) (Wold 1987). This Euclidean distance-based technique, in turn, is often used for classification purposes in combination with other approaches, such as neural networks. Thereby, the PCA transfers all values into a subdimension, which allows for displaying a three- dimensional plot for data sets of arbitrary size.
However, since information can be lost in this transformation process, our approach particularly addresses this issue during the dimensionality reduction.
In addition, we focus on two other major aspects:
• Identification of clusters in dimensionality reduced data sets
• Recognition of correlations between variables of the data set
To practically evaluate our approach, we implemented a proof of concept based on the Microsoft HoloLens, a head-mounted display for mixed-reality, and the unity game engine (Technologies 2015). The data set that is used for the prototype stems from the TrackYourTinnitus platform (TYT). Note that the latter is a mHealth crowdsensing platform that enables iOS and Android users to gather everyday life data with their own smartphones to understand their individual tinnitus situation better. Tinnitus can be described as the phantom perception of sound. Note that symptoms for tinnitus are subjective and vary over time. Therefore, TYT was developed to reveal insights on this patient variability. Moreover, depending on tinnitus definitions, the duration as well as on the patient age and birth cohort, between 5.1\% and 42.7\% of the population worldwide experience tinnitus at least once during their lifetime. Moreover, tinnitus is a chronic disorder and its general treatment is challenging as well as costly.
Especially in the context of chronic disorders, a comprehensive and quick access to patient data is of utmost importance. On one hand, clinicians and researchers want to obtain the required patient information (e.g., what are the characteristic variables of an individual patient) as quick as possible in order to conduct studies with promising hypotheses or to start a proper patient treatment. On the other, by sharing information on patient data in a proper way,
unexperienced clinicians can be educated more efficiently. Therefore, the presented approach and the developed prototype shall support clinicians and researchers in this context.
The remainder of the paper is structured as follows: Section 2 discusses related work, while Section 3 introduces the mathematical background for the pursued dimensionality reduction. In Section 4, the developed prototype is presented, in which the data set, the Graphical User Interface (GUI), and the backend are presented. Threats to validity are presented in Section 5, whereas Section 6 presents a summary and Section 7 concludes the paper with an outlook.
2. RELATED WORK
The usefulness of the third dimension for data analytics has been tested in various scenarios. In a study based on loss of quality quantification (Gracia 2016), the authors found that three-dimensional visualizations are superior compared to two-dimensional representations. The authors compared the tasks point classification, distance perception, and outlier identification in two ways. First, they evaluated a visual approach and, second, they applied an analytical counterpart. Furthermore, they conducted a user study and compared 2D and 3D scenarios on a display. However, they did not use smart glasses to evaluate their models. A second user study (Raja 2004)), specialized on scatter plots in an immersive environment, indicated that a high degree of physical immersion results in lower interaction times.
This scenario included a large field-of-regards, head- tracking, and stereopsis, but was limited to only a few number of subjects. Another study supporting the theory of improved performance in a three-dimensional space (Arms 1999), compared 2D and 3D visualizations by using interaction (i.e., time measurement) and visualization tests (i.e., correct identification). The subjects were asked to identify clusters, to determine the dimension of a dataset, and to classify the radial sparseness of data. Similar to our work, a prototype for dimensionality reduced scatterplots was developed and examined in (Wagner Filho 2017). The subjects had to identify the closest party, party outliers, and the closest deputy in a data set. Therefore, a desktop-based 3D and an immersive 3D visualization were tested on the defined user tasks. Interestingly, the immersive approach generated the best outcome concerning classification accuracy. The differences to our solution are missing components to visualize correlations and information loss, the lack of voice commands, and a different representation of data points. Here, the data points are displayed using solids circles or spheres, which is unsuitable for large data sets we are focusing on. In contrast to the previous works, (Sedlmair 2013) recommends 2D scatterplots. In a study in which users had to compare the class separability of dimensionality reduced data using 2D and 3D scatterplots, the three- dimensional approach generated higher interaction costs.
Teaching abstract data analytical concepts, such as dimensionality reduction, was tested in an exceptional project called Be the Data (Chen 2016). Persons were embodying by data points, while the floor represents a 2D projection. This idea relies on findings, where bodily experiences, such as gesturing, body orientation, and distance perception support the cognitive process (Bakker 2011). Note that the concepts of bodily experiences are an important part of mixed reality and, hence, can be associated with our work.
The Microsoft HoloLens was profoundly evaluated in (Evans 2017). The authors underline the advantages of working in a hands-free manner, yet they criticize the spatial mapping mash to be unprecise in their industrial environment.
Finally, a platform for immersive analytics was proposed by (Donalek 2018). Effective data visualization for high-dimensional data is described as
“a cognitive bottleneck on the path between data and discovery”.
Altogether, the introduced literature shows the potential of immersive analytics, though indicate potential weaknesses in our pursued context.
3. PRINCIPAL COMPONENT ANALYSIS The principal component analysis (PCA) is a technique to find patterns in high-dimensional data. Common use cases in this context are face recognition (Yang 2004) and image compression (Clausen 2000).
In general, PCA is based on the covariance measure, which expresses the connection between the dimension x and y, and which is denoted as
1
( )( )
( , )
( 1)
n
i i
i
X X Y Y
cov X Y
n
=
− −
= −
(1.1)
Most importantly for the interpretation of the covariance is it’ sign. First, if the value is positive, x and y increase together. Second, if the value is negative, then if one dimension increases, the other decreases accordingly. Finally, a covariance of zero indicates independent variables. When representing more than two dimensions, then a covariance matrix is needed:
( ))
nxn
i, j i, j i j
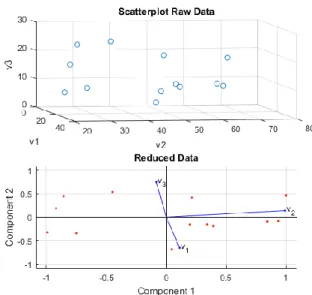
C = c ,c = cov(Dim , Dim , (1.2) where n is denoted as the number of dimensions and each entry in the matrix is a result of the calculation (1.1). Next, we need the eigenvectors and eigenvalues (Hoffman 1971) of the covariance matrix. Note that all eigenvectors of a matrix are perpendicular. The highest eigenvalue (eig1, cf. Figure 2) is denoted as principle component and can be seen as the most important axis of a new coordinate system. Thereby, each eigenvector is identified by a significance, represented by an eigenvalue. This, in turn, is the decisive point of the dimensionality reduction. If we leave out some components, we will lose information.
The remaining eigenvectors form a feature vector as follows:
( 1 2 3 n)
FeatureVector= eig ,eig ,eig ,...eig (1.3) Finally, the feature vector is multiplied with the transposed and mean-adjusted data to receive the final data set.
In summary, the complete steps of the PCA are as follows:
1) Subtract the average across each dimension 2) Calculate the covariance matrix
3) Calculate eigenvectors and eigenvalues of the covariance matrix
4) Define number of components 5) Calculate the new data set
Figure 2: PCA Example
To conclude, by excluding eigenvectors, we reduce the information in the data set. The information loss can be calculated using the percental significance of the erased component. Correlating dimensions, as expressed by the covariance measure, can therefore be well reduced by using the PCA approach.
4. PROTOTYPE
The client-side of the prototype is developed using the Unity game engine and the Microsoft HoloLens, a mixed reality smart glass. When starting the application, the hologram can be placed in the current room and it is further on placed in a static manner, so that the user can walk around the hologram and inspect it from different positions.
4.1. Data Set
The prototype was developed based on data from the TrackYourTinnitus project (Schlee et al. 2016; Probst et al. 2016; Pryss et al. 2018). Included variables are patient data that recorded via mobile applications and which represent, inter alia, the tinnitus loudness or the patient’s mood during the occurrence of tinnitus. Each
data point in this data set represents the users condition at a certain point in time. In a first preprocessing step, the data set was cleaned from missing values, which might occur if the data is stored incompletely due to missing user inputs or errors caused by the used smart mobile devices (cf. Table 1). Next, each column is normalized to ensure comparability between the dimensions. However, we lose information about the absolute values of each dimension on one hand. On the other, a uniform representation for three dimensions becomes possible (cf. Figure 2).
Table 1: The Data Set
Size 41 892
Size After Cleansing 36524
Variables 17
Data Format .csv
A common task for this medical data set is to find connections between dimensions and to derive hypotheses such as “the current mood of the patient influences the perceived tinnitus loudness”.
In this context, three major requirements concerning the developed application are derived from this TYT patient data set:
REQ1: High-dimensional data needs to be displayed and for existing clusters it should be easily possible to identify them.
REQ2: A simple data representation is essential since the application users are not necessarily data science experts.
REQ3: The relation between the data sets dimensions is a core function and needs to be displayed using a quick overview feature.
REQ4: The exchange of dimensions and the visualization of more than three dimensions must be possible.
REQ5: High computational resources must be provided as each permutation, generated by REQ4, needs to be computed on demand.
REQ6: Due to the complexity of the data set, the user needs precise application feedback and easy input possibilities during the data analysis workflow.
4.2. The HoloLens
The HoloLens offers a variety of sensors to improve the user interaction and user feedback (cf. Table 2). The Inertial Measurement Unit (IMU) contains a combination of accelerometers and gyroscopes, which stabilize the visualization of holograms by providing the angular velocity of any head movement (LaValle 2013).
Concerning REQ6, a promising way for a user interaction in this context constitutes the use of voice commands, as they allow for a hands-free interaction principle. Interestingly, the HoloLens provides a microphone array, which can distinguish between vocal user commands and ambient noise. Furthermore, due to the microphone array’s positioning, the identification of the direction of external sounds is easily possible.
Moreover, using spatial audio, the in-app audio comes from different directions, based on the user’s relative position to a virtual object. This can be used to guide the user through a room and direct his field of view to relevant diagrams or information.
Table 2: Technical Data HoloLens Sensor Overview
Inertial Measurement Unit (IMU) 1 Environment Recognition Camera 4
Depth Sensor 1
RGB Camera 2MP * 1
Mixed Reality Capture 1
Microphone 4(2 * 2)
Ambient Light Sensor 1
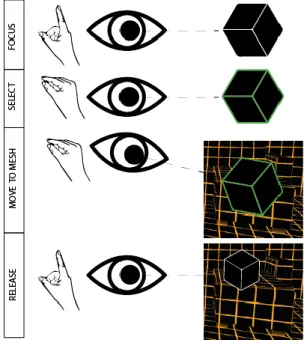
Furthermore, real-world 3D projections can be anchored onto real-life objects and are visible to the user in a distance from about 60 cm to a few meters. Therefore, infinite projections are not possible, neither to the actual distance nor to the actual proximity. Moreover, the HoloLens offers gesture- and gaze recognition. In our work, we solely utilize the tap-to-place-interaction via gestures (cf. Figure 3).
Figure 3: TapToPlace for Holograms
With a weight of 579g, the HoloLens usually needs a longer period for getting familiar with the appliance.
Note that longer wearing periods are not recommended in the beginning, due to the unnatural head positioning.
Theoretically, the power consumption of the HoloLens allows for a usage of 2.5 hours during intensive use, though it is unlikely a user will wear the HoloLens that long for an immersive analytics task.
4.3. Graphical User Interface
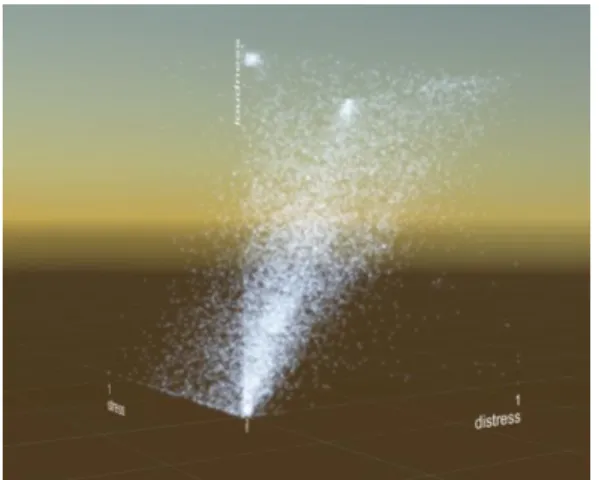
The first introduced graphical component is a particle system as shown in Figure 4. Most importantly here is the increasing brightness for particles in the same position as configured by a shader. This effect simplifies the detection of clusters as regions with a high particle density appear brighter than those with only few contained data points (cf. REQ1).
Furthermore, the particle system is labeled with the corresponding dimension name on each axis. It is possible to plot the same variable on several axes. When these axes are overloaded, meaning that there are more than three variables to be displayed (cf. REQ4), the visualization changes and the plot switches to the dimensionality reduction view. Here, in Figure 4, the PCA result is shown and the axes are renamed to the three principal components with highest significance.
Voice commands allow for the plot manipulation, where a hologram scalation by predefined values can be realized using the keywords plus and minus. As introduced in Section 4.2, a natural zoom by approaching the hologram is only possible to 60cm, therefore the scalation of the hologram replaces this use case and allows the detailed inspection of data points.
Furthermore, the variable assignment to each axis can be edited using voice commands and the resulting changes in the plot are animated, so that the user can understand occurring state changes. Note that the voice commands work fine until a certain degree of background noise exists. Our prototype was demonstrated at the TRI/TINNET Conference 2018 and, depending on the number of visitors in the exhibition hall, the voice recognition failed to detect voice input. Still, the voice commands are intuitive and fulfill REQ6.
Figure 4: Default Particle System Plot
The number of variables to be displayed is further on denoted as variables collection. All items in the variables collection are shown next to the particle system, as well as in a correlation coefficient graph (cf.
Figure 5). The latter is a variant of an existing approach (Peña 2013) using the concept of color coding. Negative variance is marked as a red edge, while positive variance is displayed as a green edge. The strength of
the variable connection is visualized using the opacity of each color, where the covariance intervals [0,1] and [-1,0] are mapped to the new opacity value in the range [0,100%]. In Table 3, therefore, a sample correlation matrix for five variables is shown. Note that, although the covariance is used for the PCA calculation, we visualize the correlation as a normalized form of the covariance.
The correlation is denoted as
( , ) ( , )
X Y
cov X Y corr X Y
=
(1.4)As can be obtained from Eq. 1.4, covariance and correlation depend on each other.
Table 3: Correlation Example Variables
loudness distress mood arousal stress loudness 1.0000 0.0676 0.0373 0.0372 -0.0022
distress 0.0676 1.0000 0.0282 0.0302 -0.0012
mood 0.0373 0.0282 1.0000 0.2874 0.0311
arousal 0.0372 0.0302 0.2874 1.0000 0.0370 stress -0.0022 -0.0012 0.0311 0.0370 1.0000
Figure 5 shows the resulting graphs based on Table 3.
The covariance plot is solely shown to underline the difference to the graphical variant. The covariance graph marks only the strongest edges, while the introduced correlation graph fades irrelevant values.
The user of the prototype can obtain this information from the graph to improve the dimensionality reduction by removing variables that don’t fit well into the graph;
if they a) correlate negatively or b) correlate very weakly.
Figure 5: Covariance (left) and Correlation Graph (right) with abbreviated features presented in Table 3 The last GUI component explains the information loss caused by the Principal Component Analysis. A bar plot shows the percentage of the three most important components for the overall variance. Figure 6 presents the variance of each component in a stacked bar. Due to the transparency, the user is able to recognize the importance of each component, while the red cube represents the discarded information.
Figure 6: Information Loss Component
Altogether, these three GUI Elements combined allow for an intuitive way of dealing with the dimensionality reduction. First, the difficulties of interpreting a covariance matrix are translated into a graph, for a quicker visual registration of connections between features. Second, the particle system allows for the visualization of high-dimensional data and a simplified detection of clusters through the brightness. Finally, the stacked bar of the PCA components variance allow for a quick estimation of each component’s importance and the information loss.
4.4. Backend
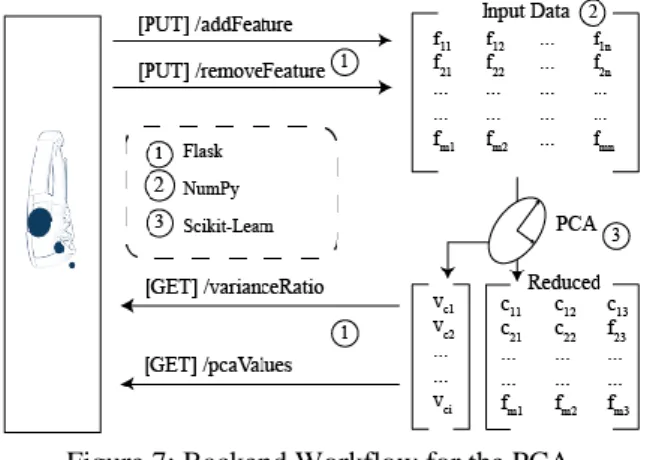
The core concept of this application is to separate the algorithm implementation from the visualization to reduce the required computational resources on the smart glasses (REQ5). Therefore, we implemented a python backend server for dimensionality reduction and data exchange possibilities through a Representational State Transfer (REST) Interface (cf. Figure 7). The server relies on the web framework Flask (Grinberg 2018), which communicates with external applications using the Web Server Gateway Interface (WSGI).
Moreover, the PCA implementation is realized by the free machine learning library scikit-learn (Pedregosa 2011), and the numerical and scientific library NumPy (Walt, Colbert, and Varoquaux 2011). The pursued workflow, in turn, is as follows: Via voice commands, variables can be selected or deselected from the data set, which is stored on the server.
Figure 7: Backend Workflow for the PCA Based on the number of selected variables n, and the number of entries in the data set m, a matrix is generated. This matrix serves as the input for the PCA.
The PCA is executed twice, by varying the number of components. First, to receive a three-dimensional reduced data set, only the three components representing the highest variances are used. The original data set can now be transformed into the new subspace.
Second, the PCA is computed with the maximal number of components to show the distribution of components concerning their variance. The mixed reality application is then able to access - via a REST call - the computed variance ratio vector and the transformed data set.
5. THREATS TO VALIDITY
This section discusses threats to validity when using the prototype in practice. First, the split into two parts of the application (i.e., GUI and Backend) complicates the installation and therefore intuitiveness of the application. On one hand, the presented application shall enable simplified insights into methods of dimensionality reduction, which could be technically shown. On the other, the developed application design for the backend and its required installation procedure are currently inappropriately designed for large-scale practical scenarios. Moreover, the need for an Internet connection disqualifies the current approach for local working environments like the ones that can be found in a production environment when working with machines. A second crucial aspect is the missing integration of numeric values. Neither in the correlation graph, nor the stacked bar, and the particle system are concrete numbers used. Therefore, this application is not meant to perform exact analytics. Moreover, all values in the particle system are normalized, which distorts the impression of the real range of values and instead only represents a relative view on the data set.
Finally, the prototype has not been evaluated in a psychologic study yet. Therefore, amongst others, insights on the cognitive load for users when using this application in practice is currently unexplored and must be evaluated in an empirical study.
6. CONCLUSION
This work presented an interface for a mixed reality application with the goal to obtain insights into dimensionality reduction effects. Use case specific components (i.e., for analyzing tinnitus patient data) were developed and optimized for the principal component analysis method. Furthermore, it was shown how these components fit together in order to gain quick insights into large data sets like the one for tinnitus patients. We have presented that interactions with the application can be executed by the use of voice commands. Furthermore, the application is enriched by a state of the art machine learning backend including a web interface, which allows future modular extensions.
Since the overall algorithm execution is outsourced to a remote server, the required computational resources on the smart glasses could be decreased. Overall, the three
introduced components provide a comprehensible function overview with respect to the major goal pursued by a PCA and can therefore be used for immersive analytics in the context of large-scale healthcare data like the one shown for tinnitus patients.
We regard such technical opportunities especially in the context of healthcare scenarios as an enabler to analyze patient data more efficiently. However, many other domains crave for such appliances that can be used to perform immersive analytics (e.g., in the context of predictive maintenance).
7. FUTURE WORK
The developed prototype is currently evaluated in a user study, in which the users need to solve cluster-based tasks, such as the assignment of occurring data patterns to the correct cluster and interpreting the effect on a cluster when removing a dimension. The study is accompanied by stress measurements to get more insights on the required mental load when using the prototype in practice. The study users, in turn, are put into two groups, which are built on a pre-test that evaluates the spatial imagination abilities of the participating users. Furthermore, the prototype will be improved by integrating the concept of spatial sounds.
As the HoloLens offers a feature for directional sounds, the user may be guided to promising clusters in the particle system. A prerequisite for this approach constitutes a suitably large particle system size, so that a user is enabled to distinguish between clusters. Finally, recommendations will be added to the prototype. So far, a user has to select the dimensions of the data set by himself or herself and, hence, must reveal the most effective dimensionality reduction for the data set by a trial and error method. In a further development, we plan that the variables, which must be selected by an user in this context shall be suggested by the prototype in a more data-driven manner.
REFERENCES
Arms, L., Cook, D., & Cruz-Neira, C., 1999. The benefits of statistical visualization in an immersive environment. Virtual Reality, 1999. Proceedings:
88-95.
Bakker, S., van den Hoven, E., & Antle, A. N., 2011.
MoSo tangibles: evaluating embodied learning.
Proceedings of the fifth international conference on Tangible, embedded, and embodied interaction, 85-92.
Chandler, T., Cordeil, M., Czauderna, T., Dwyer, T., Glowacki, J., Goncu, C., Klapperstueck, M., Klein, K., Marriott, K., Schreiber, F. & Wilson, E., 2015. Immersive analytics. Big Data Visual Analytics (BDVA), 2015: 1-8.
Chen, X., Self, J. Z., House, L., & North, C., 2016. Be the data: A new approach for Immersive analytics.
Immersive Analytics (IA), 2016 Workshop on: 32- 37.
Clausen, C., & Wechsler, H., 2000. Color image compression using PCA and backpropagation learning. pattern recognition, 33(9), 1555-1560.
Donalek, C., Djorgovski, S. G., Cioc, A., Wang, A., Zhang, J., Lawler, E., Yeh, S., Mahabal, A., Graham, M., Drake, A., Davidoff, S., Norris, J. S.,
& Longo, G., 2014. Immersive and collaborative data visualization using virtual reality platforms.
Big Data (Big Data), 2014 IEEE International Conference on, 609-614.
Evans, G., Miller, J., Pena, M. I., MacAllister, A., &
Winer, E., 2017. Evaluating the Microsoft HoloLens through an augmented reality assembly application. Degraded Environments: Sensing, Processing, and Display 2017 (Vol. 10197): p.
101970V.
Gracia, A., González, S., Robles, V., Menasalvas, E., &
Von Landesberger, T., 2016. New insights into the suitability of the third dimension for visualizing multivariate/multidimensional data: A study based on loss of quality quantification. Information Visualization, 15(1): 3-30.
Grinberg, M., 2018. Flask web development:
developing web applications with python. O'Reilly Media, Inc.
Hoffman, K., & Kunze, R., 1971. Characteristic values in linear algebra. Prentice-Hall, New Jersey.
Izadi, S., Davison, A., Fitzgibbon, A., Kim, D., Hilliges, O., Molyneaux, D, Newcombe, R., Kohli, P., Shotton, J., Hodges, S., & Freeman, D., 2011.
KinectFusion: real-time 3D reconstruction and interaction using a moving depth camera.
Proceedings of the 24th annual ACM symposium on User interface software and technology, 559- 568.
LaValle, S., 2013. Sensor Fusion: Keeping It Simple.
Available from:
https://developer.oculus.com/blog/sensor-fusion- keeping-it-simple/ [accessed 12 May 2018]
Milgram, P., & Kishino, F., 1994. A taxonomy of mixed reality visual displays. IEICE TRANSACTIONS on Information and Systems, 77(12), 1321-1329.
Pedregosa, F., et al., 2011. Scikit-learn: Machine learning in Python. Journal of machine learning research 12: 2825-2830.
Peña, J. M., 2013. Reading dependencies from covariance graphs. International Journal of Approximate Reasoning, 54(1): 216-227.
Probst, T., Pryss, R., Langguth, B., & Schlee, W., 2016.
Emotional states as mediators between tinnitus loudness and tinnitus distress in daily life: Results from the “TrackYourTinnitus” application.
Scientific reports, 6, 20382.
Pryss, R., Probst, T., Schlee, W., Schobel, J., Langguth, B., Neff, P., Spiliopoulou, M., & Reichert, M., 2018. Prospective crowdsensing versus retrospective ratings of tinnitus variability and tinnitus–stress associations based on the
TrackYourTinnitus mobile platform. International Journal of Data Science and Analytics, 1-12.
Raja, D., Bowman, D., Lucas, J., & North, C., 2004.
Exploring the benefits of immersion in abstract information visualization. Proc. Immersive Projection Technology Workshop: 61-69.
Schlee, W., Pryss, R. C., Probst, T., Schobel, J., Bachmeier, A., Reichert, M., & Langguth, B., 2016. Measuring the moment-to-moment variability of tinnitus: the TrackYourTinnitus smart phone app. Frontiers in aging neuroscience, 8, 294.
Sedlmair, M., Munzner, T., & Tory, M., 2013.
Empirical guidance on scatterplot and dimension reduction technique choices. IEEE transactions on visualization and computer graphics, 19(12):
2634-2643.
Technologies, U., 2015. Unity - Manual: Unity Manual.
[online] Docs.unity3d.com. Available at:
http://docs.unity3d.com/Manual/index.html [Accessed 03 April 2018].
Van Der Maaten, L., Postma, E., & Van den Herik, J., 2009. Dimensionality reduction: a comparative.
Journal of Machine Learning Research, 10, 66-71.
Wagner Filho, J. A., Rey, M. F., Freitas, C. M., &
Nedel, L., 2017. Immersive Analytics of Dimensionally-Reduced Data Scatterplots.
Available from: http://immersiveanalytics.net/
[accessed 19 April 2018]
Walt, S. V. D., Colbert, S. C., & Varoquaux, G., 2011.
The NumPy array: a structure for efficient numerical computation. Computing in Science &
Engineering, 13(2): 22-30.
Wold, S., Esbensen, K., & Geladi, P., 1987. Principal component analysis. Chemometrics and intelligent laboratory systems, 2(1-3), 37-52.
Yang, J., Zhang, D., Frangi, A. F., & Yang, J. Y., 2004.
Two-dimensional PCA: a new approach to appearance-based face representation and recognition. IEEE transactions on pattern analysis and machine intelligence, 26(1), 131-137.
AUTHORS BIOGRAPHY
Burkhard Hoppenstedt holds a M. Sc. in Computer Science from Ulm University and his research addresses aspects on big data analytics, especially with the focus on predictive maintenance in an industrial context.
Klaus Kammerer holds a M. Sc. in Computer Science from Ulm University. Next to his research on process- centric sensor frameworks, he focusses on the possibilities of mixed-reality applications for maintenance processes.
Berthold Langguth is Head Physician at the Department of Psychiatry and Psychotherapy of the University of Regensburg at the Bezirksklinikum Regensburg and also Head of the multidisciplinary Tinnitus Clinic of the University of Regensburg.
Thomas Probst holds a PhD in psychology from the Humboldt University Berlin. His research focuses on the development and evaluation of IT-based systems for the diagnostic-therapeutic process. In 2017, he has been appointed as a full professor at the Danube University Krems.
Rüdiger Pryss holds a Diploma in Computer Science.
After his studies, Rüdiger Pryss worked as consultant and developer in a software company. In 2015, Rüdiger has finished his PhD thesis. Currently, he works as a senior researcher with the DBIS institute at Ulm University.
Manfred Reichert holds a PhD in Computer Science and a Diploma in Mathematics. Since 2008, he has been appointed as full professor at the University of Ulm, where he is director of the Institute of Databases and
Information Systems (DBIS).
Winfried Schlee holds a PhD in clinical neuropsychology, where he introduced the concept of the Global Model of Tinnitus Perception. In 2013, he joined the Tinnitus Research Initiative where his current work focuses on discovering new methods for the treatment and measurement of chronic tinnitus.
Christian Schneider holds a M.Sc. from the University of Neuchâtel in Advanced Computer Science and investigates computational methods into fields such as Design, Data Visualization, and Neuroscience.