Land Matrix
I
TZA
BRA
MAR
PHL IDN GHA
BEN NGA
ML
SDN
MOZ
ETH
PAK ZMB
MDG
ARG ARG
Transnational Land Deals for Agriculture in the Global South
Analytical Report based on the Land Matrix Database
Ward Anseeuw, Mathieu Boche, Thomas Breu, Markus Giger, Jann Lay, Peter Messerli and Kerstin Nolte
landportal.info/landmatrix
1
April 2012
Land Matrix
I
TZA
BRA
MAR
PHL IDN GHA
BEN NGA
ML
SDN
MOZ
ETH
PAK ZMB
MDG
ARG ARG
Transnational Land Deals for Agriculture in the Global South
Analytical Report based on the Land Matrix Database
Ward Anseeuw, Mathieu Boche, Thomas Breu, Markus Giger, Jann Lay, Peter Messerli and Kerstin Nolte
landportal.info/landmatrix
1
Embargoed until 27 April 2012 at 00.01 CET
Acknowledgments
The LAND Matrix partnership would like to thank the German Ministry of Education and Research (BMBF) for their support to the GIGA project “Large-scale agricultural investments and sustainable development”, the German Ministry for Economic Cooperation and Development (BMZ) for their support through the GIZ sector project “Land policies and land management”, and NCCR North-South for the support to this report.
A special thanks also goes to Mirjam Harteisen, Julia Petersen and Kacana Sipangule (GIGA) for their excellent research assistance, Matthias Engesser (CDE) for GIS analysis, Silvia Forno (ILC) for the key role played in the coordination and development of the LAND Matrix, and Andrea Fiorenza and Michael Taylor (ILC) for their support in producing this report.
Last but not least, the LAND Matrix partners wish to express their gratitude to all members of their networks who have significantly contributed to the data collection.
The Land Matrix is partly financed by the internal resources of the partners organisations. The additional support of Oxfam, SDC, Netherlands Ministry of Foreign Affairs, BMZ and European Commission is greatly appreciated.
landportal.info/landmatrix
The LAND Matrix, out of which this report was produced, is an online public database of large- scale land deals facilitated by a partnership between the following organisations:
The International Land Coalition (ILC) is a global alliance of civil society and intergovernmental organisations working together to promote secure and equitable access to and control over land for poor women and men through advocacy, dialogue, knowledge sharing and capacity building.
www.landcoalition.org
The Centre for Development and Environment (CDE) is the University of Bern’s centre for sustainable development research. Its mission is to produce and share knowledge for sustainable development in cooperation with partners in the global North and South.
www.cde.unibe.ch
CIRAD works with the whole range of developing countries to generate and pass on new knowledge, support agricultural development and fuel the debate on the main global issues concerning agriculture. CIRAD is a targeted research organization, and bases its operations on development needs, from field to laboratory and from a local to a global scale.
www.cirad.fr
The GIGA German Institute of Global and Area Studies is a Hamburg-based research institute focused on political, economic and social developments in Africa, Asia, Latin America, North Africa, and the Middle East. Through a unique combination of area and comparative area studies, the GIGA examines not only the issues and challenges facing these specific regions but also new developments in North-South and South-South relationships.
www.giga-hamburg.de
The Deutsche Gesellschaft für Internationale Zusammenarbeit (GIZ) offers customised solutions to complex challenges. We are an experienced service provider and assist the German Government in achieving its objectives in the field of international cooperation. We offer demand-driven, tailor-made and effective services for sustainable development.
www.giz.de
Edited by Tim Bending
Design by Vittorio Mastellone and Federico Pinci
Transnational Land Deals for Agriculture in the Global South
By The Land Matrix Partnership (CDE, CIRAD, GIGA, GIZ, ILC)
Authors:
Anseeuw, W.; Boche, M.; Breu, T.; Giger, M.; Lay, J.; Messerli, P.; Nolte, K.
Analytical Report based on the Land Matrix Database
Number 1: April 2012
Table of contents
Executive Summary vi
Introduction 1
1. Global overview – The rush for land for agriculture
3 Effective implementation of large-scale land acquisitions 4A growing phenomenon – although its pace has slowed 6
2. Where are investments targeted?
7A national perspective: concentration on selected countries with specific characteristics 9 Local-level analysis: the role of land cover, yield gap and accessibility 16
3. Investors and investor countries
21Where does the investment come from? 21
Characteristics of investors 24
4. Learning more about the drivers
26Water as a driver: the role of water in large-scale land acquisitions 32 The destination of production from large-scale land acquisitions for agriculture 35
5. Processes and impacts: How land deals are implemented
36Land rights and land governance in target countries 37
Contracts, transparency and the involvement of local communities 40 Bibliography 46
Appendix 1: Land Matrix Methodology 48
Figures
Figure 1: Reported acquisitions for agriculture between 2000 and 2010 6 Figure 2: Land acquisitions by region, number of projects and size 7 Figure 3: Land acquisitions by sub-region in Africa, number of projects and size 8 Figure 4: Most targeted countries according to size of total reported acquisitions 9 Figure 5: The location of land deals in relation to suitable available land and the yield gap 13 Figure 6: Typology of land acquisitions according to Global Hunger Index 2011 and agricultural GDP 14 Figure 7: Share of land acquisitions in different global land cover classes 17 Figure 8: Share of land acquisitions in different classes of yield gap in target countries 19
Figure 9: The accessibility of land deal locations 19
Figure 10: Distribution of land acquisitions to different classes of population density in target countries 20
Figure 11: The origin of investment – top 20 countries 22
Figure 12: Land acquisition by type of investor 24
Figure 13: Land acquisition by type of investor on implemented projects 25
Figure 14: Land acquisitions by category of production 27
Figure 15: Land acquisitions by category of production, number of projects and size 28 Figure 16: Targeted regions for food production, number of projects 29
Figure 17: Region of origin of investors, food crop projects 29
Figure 18: Targeted regions for flex crops production, number of projects 31 Figure 19: Impact on water consumption for crop production in target countries 34 Figure 20: The destination of production from large-scale land deals 35
Figure 21: Destination for projects exporting production 35
Figure 22: Land Tenure Security 37
Figure 23: Former land use 39
Figure 24: Former Legal Land Owner 39
Figure 25: Involvement of the community 40
Figure 26: Number of projects with reported evictions 42
Figure 27: Reported Benefits 44
Figure 28: Projects with Reported Domestic Jobs Creation 45
Tables
Table 1: Number of large-scale land acquisitions for agriculture and their size 3
Table 2: Land acquisitions for agriculture with contract signed 5
Table 3: Land acquisitions for agriculture where production has started 5 Table 4: Key socio-economic and institutional indicators of target countries 11 Table 5: Target countries and investment origin countries compared 23
Table 6: Sectors affected by land deals 26
Table 7: Water scarcity and water intensity of large-scale land acquisitions
if implemented in investor countries 33
Table 8: Single Case Evidence on compensation 43
Table 9: Reliability Codes 48
Boxes
Box 1: The case of Cambodia 10
Box 2: Testing the influence of yield gap and land availability on the targeting of investment 12
Box 3: Characterizing key aspects of land deal locations 16
Box 4: Sectors affected - Mainly agriculture, but other land uses are important as well 26 Box 5: Indicators for water balance changes in investors’ countries 32 Box 6: Conflicting land rights and land use in Western Kenya: The case of Dominion Farms 38
Box 7: Communal land and the role of chiefs in Zambia 41
Executive Summary
The 2007/2008 spike in the price of agricultural commodities was accompanied by a spike in media reports of huge transnational farmland acquisitions.
Commentators were soon referring to “land grabbing”, or to a new “global land rush”. However, others have argued that the boom is really only a bubble which is driven by speculation and is thus not likely to materialize in real projects. While some have seen a major threat to the rights and livelihoods of the rural poor in the Global South, others have pointed to potential opportunities arising from new investment in a long-neglected sector. The real extent and the nature of this new phenomenon have been hard to assess, particularly because of the lack of reliable data.
The Land Matrix project was set up to respond to this gap. It is a partnership between the Centre for Development and Environment (CDE) at the University of Bern, the Centre de coopération Internationale en Recherche Agronomique pour le Développement (CIRAD), GIGA German Institute of Global and Area Studies, Gesellschaft für Internationale Zusammenarbeit (GIZ) and the International Land Coalition (ILC). The Land Matrix project systematically collates and seeks to verify information on large-scale land acquisitions. It records transactions that entail a transfer of rights to use, control or own land through sale, lease or concession; that cover 200 hectares (ha) or larger;
and that have been concluded since the year 2000.
The main sections of the database are now publicly available (http://www.landportal.info/landmatrix).
This report draws on the Land Matrix database to analyze and better understand the phenomenon of large-scale agricultural land deals. It focuses on:
» land acquisitions or investments (“deals”) targeting the Global South and Eastern Europe, including only low and middle income countries;
» transnational deals, excluding deals where only
domestic actors are involved; and
» deals where the envisioned land use is agricultural.
The Land Matrix figures confirm that there is a worldwide rush for land, although it has lost some of its initial pace. Many deals have been more than just speculation and strategic positioning. A large number of contracts have been signed and followed through by the implementation and start of operation of projects.
However, the “global land rush” is anything but a simple phenomenon. It involves a large number of target countries with very different investment conditions, as well as a great variety of actors with differing investment motives. Each land deal has its own specific characteristics. In addition to the complexity of the topic, there is a huge lack of transparency on land governance matters, in particular regarding planning and decision-making processes, contractual agreements, and issues of community involvement and compensation. Little is known about the short and expected long-term effects of these investments. Even with the data collated by the Land Matrix project, the picture of large-scale land acquisitions remains hard to decipher.
This study has five main parts. The first gives a global overview and emphasizes the indisputable reality of the large-scale land acquisitions. The second details the target countries and regions. It looks at the determinants of investment decisions and inquires whether investors really target marginal land. Thirdly, this study examines the investor countries, the investors and their characteristics.
The fourth part focuses on learning more about the drivers of the global increase in demand for land. Finally, the processes of large-scale land acquisitions are examined, including an assessment of compensation and potential benefits.
Global overview
The Land Matrix database provides evidence that the phenomenon may be even larger than assumed until now. This report suggests that:
The rush for land is real, although it has fallen from its 2009 peak. The Land Matrix contains reports of 1217 agricultural land deals, amounting to 83.2 million ha of land in developing countries. This is equivalent to 1.7% of the world’s agricultural area.
Data for 625 (51.4%) of these deals, covering 43.7 million ha (39.3%) have been evaluated as coming from a reliable source of information. Nonetheless, it is still difficult to estimate the true scale of the phenomenon, which may still be larger than all the reported deals together, because of the lack of transparency that surrounds many deals. Moreover, some of these deals lack information on the size of the deal.
A significant proportion of reported deals lead to real legal transfers and implementation. Out of 1217 agricultural land deals, 403 (32%) were reported as signed, corresponding to 26.2 million ha. 330 (27%) of the reported deals have so far led to implementation activity, affecting approximately 21 million hectares.
The rush has slowed, but continues. Reports of land deals declined after their peak in 2009, but the decline in the actual conclusion of contracts was slower. While some of this decline may be due to the easing of commodity prices, the financial crisis and new realism about the risks of the investments concerned, it may also reflect a new wariness about announcing very large-scale prospective deals, and a shift in media interest to other topics.
Where are investments targeted?
The Land Matrix also provides evidence on the targets of investment, which can be analyzed on a global, regional or local scale, and in terms of quality of governance and level of economic development, and the types of natural resources involved.
Africa is the most targeted region. 754 land deals covering 56.2 million ha are located in Africa, compared with 17.7 million ha in Asia, and 7 million ha in Latin America. Reported land deals in Africa concern an area equivalent to 4.8% of Africa’s total agricultural area, or the territory of Kenya.
The majority of reported acquisitions are concentrated in a few countries. A large number of countries (84) are reported to be targeted by foreign investors, but just 11 of them concentrate 70% of the reported targeted surface. Among those 11 countries, 7 are African, namely Sudan, Ethiopia, Mozambique, Tanzania, Madagascar, Zambia and DR Congo. In South-East Asia, the Philippines, Indonesia and Laos are particularly affected.
Investors are targeting countries that are among the poorest, are poorly integrated into the world economy, have a high incidence of hunger, and weak land institutions. The data reveal a tendency for investors to focus on the poorest countries, and those that are also less involved in world food exchanges. Our results confirm that investors are targeting countries with weak land tenure security, although they try to look for countries that, at the same time, offer relatively high levels of investor protection. Furthermore, 66% of the reported deals go to countries with high prevalence of hunger.
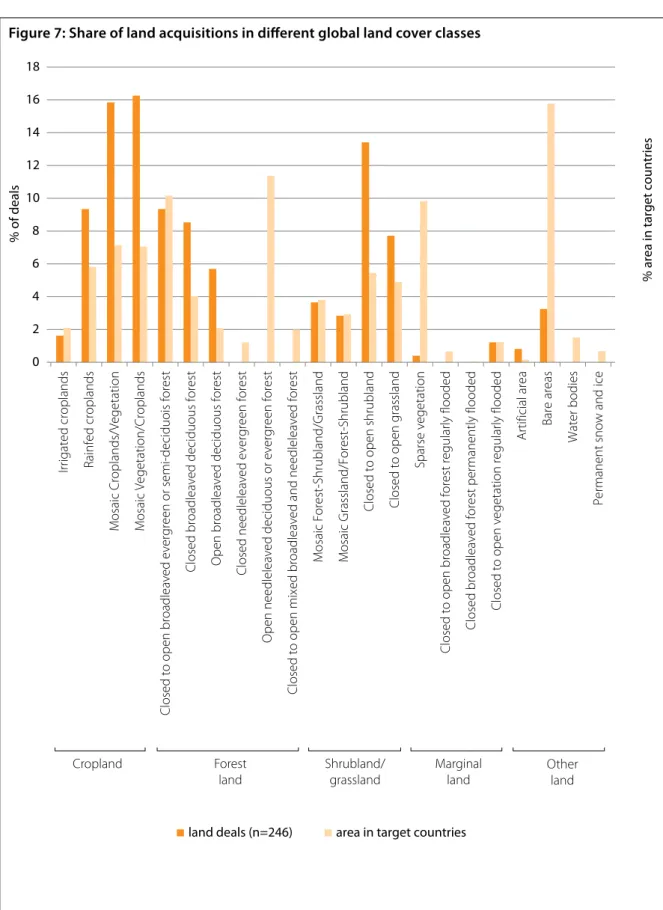
Investors are competing for land with local farming communities. Approximately 45% of the land deals target cropland or crop-vegetation mosaics. Intensive competition for cropland with local communities is therefore likely. Even where national indicators may suggest large reserves of suitable land, target locations are often found within cultivated areas and farmland. This analysis thus contradicts the notion that investments are mostly focused on “idle”
land and serve to bring it into production.
Forested areas are highly affected by land acquisitions. About 24% of the land deals are located in forested areas, representing 31% of the total surface of land acquisitions.
Investors have a tendency to target land with high yield gaps, good accessibility and considerable population densities. Spatial analysis of land deals reveal that investors tend to target cropland where the yield gap is relatively large, and where additional inputs (water, fertilizers, seeds, infrastructure and know-how) may create greater yields. Accessibility is another criterion for choice of target area: the majority of deals may be less than 3 hours away from the next city. More than 60% of all land deals target areas with population densities of more than 25 persons per km².
Who are the investors?
While the focus of early media reports was on the role of public bodies such as sovereign wealth funds, and on certain investor countries, it has so far been difficult to get a comprehensive picture of the type of investors involved in large-scale land acquisitions.
The Land Matrix provides data on the type and origin of investors.
A new regionalism is emerging. According to the Land Matrix results, investment originates from three groups of countries: emerging countries (Brazil, South Africa, China, India, Malaysia, Korea);
Gulf states; and countries in the “Global North”
(USA, European countries). There is a strong trend of intra-regional transactions with, for example, firms from Brazil, Argentina and South Africa seeking to replicate domestic success through investments in their regional neighborhoods.
Investment is coming from wealthier, food importing countries. Countries of investment origin have an average GDP per capita four times higher than target countries. The former are also net importers of food, with net imports of US$ 13.9 per capita (US$
306 per capita for countries that are only the origin of investment, not targets).
Investors are both public and private actors.
The Land Matrix data reveal four different types of investors: private companies (442 projects; 30.3 million ha); state-owned companies (172 projects,
11.5 million ha); investment funds (32 projects, 3.3 million ha); and private-public partnerships (12 projects, 0.6 million ha).
Partnerships are important for investors. Foreign investors have built partnerships with domestic companies in 12% of cases, probably as a way of reducing the costs of complex local administration, and for legislative reasons in some contexts. Foreign investors also often act in partnership with each other. Investors from USA, UK and South Africa have formed such partnerships in about a third of the deals in which they are involved.
What is driving the land rush?
The driving forces behind large-scale land acquisitions include increased global demands for different crops and, at a more fundamental level, expected future demands for water, food and energy. Investor choices about the location of land acquisitions and the types of crops grown are a reflection of the expectations created by these long-term trends.
The rush for land is being driven by long term trends. The recent surge in investor interest has been triggered primarily by the food price crisis of 2007- 2008. But far from being a brief phenomenon, the land rush is likely to continue in the long run because of the trends that are driving it. Among the main drivers, we find expectations of rising prices, population growth, growing consumption rates and market demand for food, biofuels, raw materials and timber, carbon sequestration and financial speculation.
Investors are acquiring water. In some regions of the world, water scarcity is increasingly a key constraint on agricultural production, leading to escalating competition for water resources.
Calculations reveal that in two thirds of the countries targeted, water consumption will increase as a result of large-scale land acquisitions. Overall, the increase in water consumption in these countries is estimated at 12.7%. Land acquisitions can be expected to have a positive effect on the freshwater
Both food and non-food crops are important, but investors are seeking flexibility to switch between them. Drawing on reliable data sources, the Land Matrix reveals that food production accounts for 34% of investments, non-food crops account for 26%, “flex crops” for 23% and “multiple uses” for 17%. The importance of non-food and
“flex” crops shows the extent to which investors are attracted to biofuels and other, more traditional,“high value crops” such as rubber (37 projects).
The “flex crops” (soybean, sugarcane and oil palm) are so called because these crops can either be used for food or non-food purposes (particularly for biofuel). The importance of flex crops and multiple use projects makes the real balance between food and non-food production difficult to determine.
It also suggests the importance to investors of flexibility in the face of risks linked to price volatility, commercialization, and so on.
Most projects are export-oriented. For the 393 cases where information on the main destination of production is available, export is the principal aim of production. Domestic markets are of marginal concern. Of the projects that are export-oriented, 43% aim to send the production to the country of origin of the investors. These projects are mainly concerned with food crop production (42%), which supports the argument that food security is one of the drivers of the land rush.
How do large-scale land acquisitions take place, and what are the impacts?
Two of the chief causes of concern about large- scale land acquisitions relate to the way they are decided and carried out, and their local impacts.
For a number of the cases recorded in the Land Matrix database, information has been reported on such issues as consultation, on who is recognized as the vendor or leaser, on who used the land prior to the acquisition, on the displacement of former land users, and on compensation, employment and other benefits.
Land governance systems are often not adequate to deal with large-scale land investments.
The involvement of foreign investors often has repercussions for the local land tenure system. It is common that the prospect of attracting foreign investment may alter the significance and role of formal land rights that are often held by state. Local authorities such as village chiefs who often play a key role in allocating land rights appear to frequently fail to act in the community’s interest.
Governments are selling land that is used by smallholders. The analysis of the limited number of projects with information on previous land use confirms that the land acquired by investors is often used by smallholders. However, the same land is typically sold or leased by the state; this being a direct consequence of diverse land tenure systems, in particular in African countries.
Acquisitions are rarely based on Free, Prior and Informed Consent (FPIC) and there is limited but worrying evidence on evictions. The evidence from the Land Matrix reveals that only very few projects seem to engage in adequate consultations with local communities. In the few cases with community involvement, the consultation process is typically described as “limited”. Moreover, the database reports a small number of projects that lead to substantial evictions. While information on the sensitive issue of displacement is – not surprisingly – scarce, the fact that most land acquired was at least partially used by local farmers, gives cause for concern.
Rates of compensation are often very low. For a limited number of cases, the Land Matrix has information on compensation (typically stated intentions). Compensation arrangements range from in-kind grants to the community, such as building social or productive infrastructure, to cash- payments for affected individual farmers. One-off payments are frequent, but lease fees are also paid in some cases, and range from 7 US cents to 100 US$ per ha annually. Such variation is linked to the lack of functioning land markets and corresponding
price signals in many affected regions, a situation that some investors may exploit to their advantage.
As those compensation or lease payments are often received by local authorities on behalf of communities, they may be prone to theft.
Some infrastructure, but little evidence on benefits from employment generation. Evidence on how local communities may otherwise benefit from investment projects is also scarce. The great majority of projects with reported benefits mention infrastructure improvements such as health or education facilities, better access to markets and project infrastructure that can be used by the local population.
The limited information on employment creation suggests that for some projects, this effect could be significant. However, it is difficult to distinguish between additional employment creation and job replacement, in particular where smallholders lose access to land and their former employment.
Key conclusions
In summary, this report confirms that the drive for land acquisition is a global trend that already has considerable impacts. The database on which it is built, the largest of its kind, shows that Africa is the continent mainly targeted. On global scale, land deals since 2000 are reported to affect an area equivalent to more than 1.7 percent of the global agricultural area.
Investors from countries that are wealthier and net food importers are acquiring land in poorer countries with high incidences of hunger and weak land governance. Both food and non-food crops are produced, often for export.
Although there is a tendency to acquire land in countries with large reserves of uncultivated land, a closer examination reveals that almost halve of the deals concern areas that are already used for crops.
Investors target areas that are easily accessible, have a high yield gap and have considerable population
densities. High competition for land with existing users is unavoidable.
Acquisitions are rarely based on Free, Prior and Informed Consent (FPIC) and there is limited but worrying evidence on evictions. Scarce reports on other benefits suggest some infrastructure provision, but provide little evidence on benefits from employment generation.
Large-scale land acquisitions are also partly targeting forested and grazing land, creating trade- offs with environmental and social goals. There are also indications that water stress may increase as a result of land acquisitions in target countries.
Introduction
The 2007/2008 spike in commodity prices marked the start of a surge in media reports on farm land acquisitions that were soon referring to a new
“global land rush”. However, others have argued that the boom is really only a bubble, and not likely to materialize in real projects. While there have been common concerns expressed that the rush for land may constitute a major threat to the rights and livelihoods of the rural poor in the Global South, others have pointed to potential opportunities for food security and rural development arising from new investment in a long-neglected sector.
The real extent and the nature of this new phenomenon have been hard to assess, particularly because of the lack of widely available, reliable data. There is a huge lack of transparency on land governance matters, in particular regarding planning and decision-making processes, contractual agreements, and issues of community involvement and compensation. Little is made public, or even known about the short and long-term effects of these investments.
In addition, the “global land rush” is anything but a simple phenomenon. It involves a large number of target countries with very different investment conditions and land governance systems, as well as a great variety of actors with differing investment motives. Each land deal therefore has its own specific characteristics, defying attempts to make easy generalizations.
The Land Matrix project was set up to respond to the lack of widely available, reliable data on large-scale land transactions in the Global South. It collates and evaluates data from a wide range of sources on large transnational transactions in the agricultural sector and other sectors. This report represents the first thorough analysis of the Land Matrix database.
The Land Matrix figures confirm that there is a worldwide rush for land, and while the rate of land acquisition in developing countries appears to have lost some of its initial pace, the Land Matrix data does not support the argument that this rush is only a speculation-driven bubble, unlikely to materialize in real projects. A large number of land acquisitions have been followed by project implementation.
The Land Matrix - Tracing, verifying and following-up land deals world-wide
Since 2009, a partnership between the Centre for Development and Environment (CDE) at the University of Bern, Centre de coopération Internationale en Recherche Agronomique pour le Développement (CIRAD), GIGA German Institute of Global and Area Studies, Gesellschaft für internationale Zusammenarbeit (GIZ) and the International Land Coalition (ILC), has been systematically collating and verifying information on large-scale land acquisitions. This Land Matrix records transactions that entail a transfer of rights to use, control or own land through sale, lease or concession; that cover 200ha or larger; and that have been concluded since the year 2000. The database is now the largest of its kind.
The data comes from a variety of sources including media, international and non-governmental organizations, as well as academic (and in part field- based) research. Reports are chiefly sourced through the two most active Internet portals that deal with land transactions, www.commercialpressuresonland.
org of the Land Portal operated by the International Land Coalition (ILC) and www.farmlandgrab.org operated by the NGO GRAIN.
Data classified as reliable are available via the Land Portal (http://www.landportal.info/landmatrix) and include information on name of investor, country
of origin, target country, hectares of acquisition and sector of production. The database contains further fields of information that have been collected where possible, on which this report has also been based, but which are not made public for legal reasons.
How reliable is the data?
The database ranks data reliability on a scale of 0 and 3. A reliability rank of 0 is given to land transactions only reported by the press or other sources (typically websites), and that have not undergone any process of verification. A reliability rank of 1 is assigned to transactions reported by sources judged more reliable, in particular research papers based on field research, company websites and government records. A reliability rank of 2 is given to land transactions that have been cross-checked by the Land Matrix Partnership through questionnaires submitted to organizations working in the host country. A rank of 3 is assigned to cases where contractual agreements have been made publicly available. Cases with reliability ranking of 1, 2 or 3 are referred to as “reliable”. The term “reported” refers to all cases, including those with a ranking of 0. As the database matures, cases will be revised in terms of their reliability.
However, it must be noted that even where data has been classified as “reliable”, it can still be subject to change.
Various factors may also influence the coverage of the database. One factor is media bias (e.g. a tendency to focus more on some countries as “land-grabbers”
than others). Another is the effect of different levels of transparency. Thus Peru’s transparency laws allow access to information on all large-scale land acquisitions, for example, whilst reports and research may under-represent the phenomenon in Congo Basin states. Information on the implementation status of each acquisition (whether the project is in the start-up phase, in operation, etc.) is limited, being available only for some cases reported as having a completed contract.
The coverage of this report
This report covers:
» Countries of the ‘Global South’, including only low and middle income countries, and countries in Eastern Europe, as targets of land acquisition.
» Acquisitions by foreign investors (excluding purely domestic transactions).
» Agriculture-oriented projects (although globally assessing the significance of land acquisition in other sectors, in-depth analyses will exclude mining, tourism, etc.).
The figures presented in this report thus differ significantly from those in previous reports based on the Land Matrix such as “Land Rights and the Rush for Land” (Anseeuw et al., 2012) which used a less selective range of data (covering sectors such as forestry and mining, for example). This report also reflects updates to the database as of February 2012, including new entries and revisions based on the ongoing cross-checking process. More details on the methodology of the Land Matrix are given in Appendix 1.
This report is structured in 5 parts. Part 1 gives a global overview and emphasizes the indisputable reality of the large-scale land acquisition phenomenon. The second part details the target countries and regions and, notwithstanding announcements that marginal land will be targeted, the factors that appear to influence investors’ choice of locations. Part 3 presents investor countries, the investors and their characteristics. Part 4 focuses on the drivers of land acquisitions. Finally, the processes of large-scale land acquisitions are detailed in Part 5, presenting the different land tenure systems affected, the previous land uses/users, the displacements occurring, as well as the information available on compensation and potential benefits.
Global overview – The rush for land for agriculture
The rush for land – A reality
The Land Matrix contains reports of 1217 agricultural land deals, amounting to 83.2 million hectares of land in developing countries. This includes all reported and reliable data on transactions, concerning solely agriculture. Of these reports, data on 625 deals (51.4% of total) covering 32.7 million hectares (39.3% of total) are classified as reliable, and we can say with confidence that in these cases a land transaction, i.e. at least a transfer of land rights, has taken place (Table 1). The identified surface areas represent respectively the area of France and Germany combined (reported data) or Germany, Belgium and the Netherlands together (reliable data), and are equivalent respectively to 1.7% and 0.7% of world’s agricultural land.1
The results emerging from the Land Matrix thus provides evidence that the scale of the phenomenon affecting developing countries is significantly larger than assumed until now, even if only agricultural
1 Global agricultural land amounts to 4889 million ha, source: http://faostat.fao.org/
deals are considered. The World Bank report, “Rising global interest in farmland” (2010) presents a figure of 46.6 million hectares worldwide reported in the press between October 2008 and August 2009. The Land Matrix figures reveal a reported area 78.6%
greater than this (although more reliable data only account for an area 29.8% lower than the World Bank estimation). One of the major reasons explaining this difference is the different time period considered.
A significant proportion of the deals that are reported, but for which no reliable information source yet exists, have very probably taken place.
Indeed, the reported data may underestimate the real scale of the phenomenon. The main reason for caution in estimating the scale of transactions is the non-transparent manner in which these deals are taking place. Very little information is readily available regarding these deals.
Table 1: Number of large-scale land acquisitions for agriculture and their size
Number of deals Number of hectares
Only Reported 592 50481345
Reliable 625 32735012
Total 1217 83216357
Source: Authors’ calculations based on the Land Matrix.
1.
Effective implementation
of large-scale land acquisitions
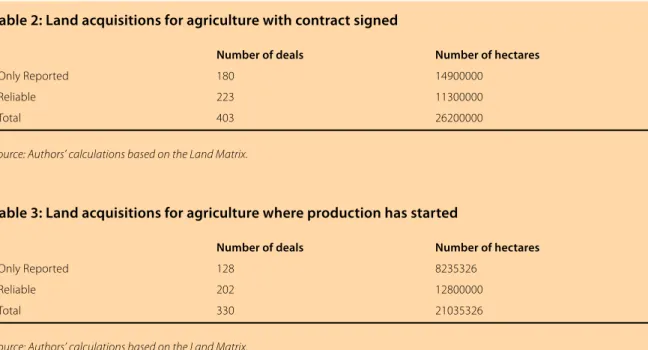
It is evident that a high proportion of deals that are reported, and that can even be classified as from a reliable source, are never implemented. Out of the 1217 agricultural land deals, amounting to 83.2 million hectares of land in developing countries, 403 deals (31.5%) covering 26.2 million hectares were reported as actually signed (the reliable data covers 223 cases and 11.3 million hectares, see Table 2). To estimate the area that has been brought into production under these deals is still more difficult, as implementation may be only partial. However, 330 projects, nominally covering 21 million hectares, are reported to have started production. This represents approximately the area of the United Kingdom.
Although the latter represents only 25.3% of area covered by all reported deals, it does represent an 81.9% implementation rate for deals that have been reported as signed.
The difference between the reported deals and projects that have started production is related to the following factors:
» Some operators may have underestimated the managerial and technical difficulties related to the implementation of large land deals in often difficult ecological, political, bureaucratic and socio-economic environments. This issue is likely to be particularly relevant to operators that do not have an established track-record in agriculture.
» Investors may not be successful in gaining the
attributes they seek, thus leading the investor to pull out. This was reportedly the case in Mali and Madagascar among others (Oakland Institute, 2011a; Andrianirina-Ratsialonana et al, 2011).
Brautigam (2011) gives the example of a Chinese parastatal backing down on its allegedly well- received request to access 100,000 ha to three million hectares of forested lands to grow oil palm, following feasibility studies which showed insufficient transport and infrastructure support from the area.
» Some public announcements of land deal negotiations may reflect the strategic and speculative positioning of investors aiming to secure land even in the absence of specific investment plans in the short term, but in the expectation that land prices will increase.
The gap between reported deals, reliable cases, and implemented projects, should not cause complacency. Indeed, announcements, negotiations and certainly contracts signed but not implemented may still exacerbate pressures on land and lead to displacements or a weakening of land rights for the local population. Potential benefits of long-term investments, such as irrigation and other infrastructure, access to markets and jobs (see Chapter 5), will not materialize either.
Table 2: Land acquisitions for agriculture with contract signed
Number of deals Number of hectares
Only Reported 180 14900000
Reliable 223 11300000
Total 403 26200000
Table 3: Land acquisitions for agriculture where production has started
Number of deals Number of hectares
Only Reported 128 8235326
Reliable 202 12800000
Total 330 21035326
Source: Authors’ calculations based on the Land Matrix.
Source: Authors’ calculations based on the Land Matrix.
A growing phenomenon – although its pace has slowed
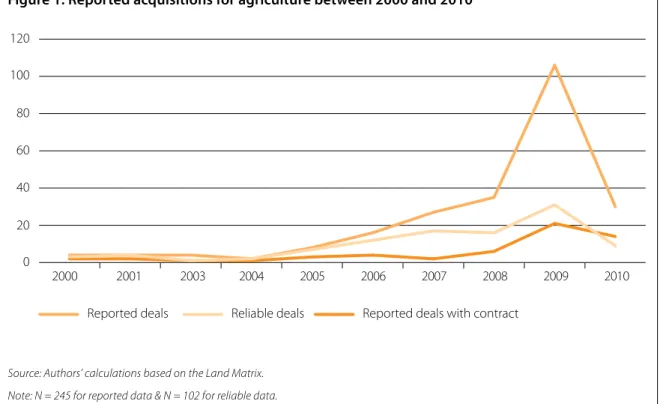
The Land Matrix data (reported and reliable) suggest that the rate of acquisitions remained low until 2005, whereafter it accelerated greatly, peaking in 2009 and slowing down again in 2010 and following years (Figure 1). The surge of 2005–2009 can be related to the food price crisis and a range of factors that triggered new investor interest in land (Anseeuw et al., 2012). The slowdown in 2009 is likely to be partly due to the 2008–2009 financial crisis and a consequent deceleration in the rate of acquisition.
It may also be due to potential investors becoming more realistic about the risks of difficult conditions, technically but also socio-politically. This was the case in Madagascar following the withdrawal of Daewoo (Andrianirina-Ratsialonana et al., 2011).
Thirdly, it may be that significant critical press coverage has made potential investors more wary of large-scale acquisitions in poor countries, or at
least less inclined to publicly announce new large acquisitions.
This being said, overall, the data are suggestive of a long-term trend of growing commercial interest in land, somewhat masked by a possible new- found wariness (since 2009) about attempting very large-scale land deals, or publicizing those under negotiation. A similar trend is revealed by the reliable dataset and by deals where a contract is reported as signed. However, the declines in the latter since 2009 are less steep. Reporting of the signing of contracts has remained relatively constant at a level significantly higher than in the early 2000s.
Figure 1: Reported acquisitions for agriculture between 2000 and 2010
Source: Authors’ calculations based on the Land Matrix.
Note: N = 245 for reported data & N = 102 for reliable data.
0 20 40 60 80 100 120
Reported deals with contract Reliable deals
Reported deals
2000 2001 2003 2004 2005 2006 2007 2008 2009 2010
Where are investments targeted?
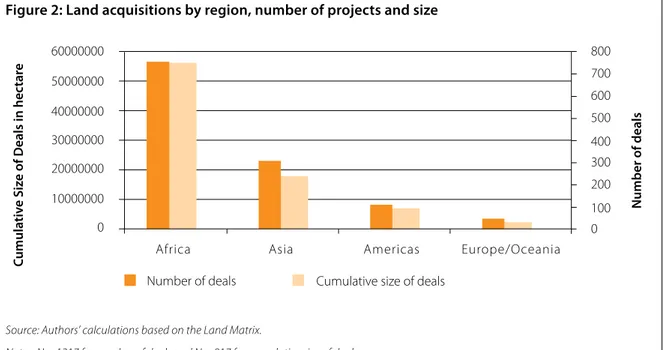
Africa appears to be the main target of the land rush. Of the 1217 publicly reported deals, 62% of the projects covering a total area of 56.2 million hectares are located in Africa, while some 17.7 million hectares are reported in Asia, and 7 million hectares in Latin America. The remaining 2.2 million hectares are in other regions, particularly Eastern Europe and Oceania (Figure 2).
For Africa, the reported large-scale land acquisitions for agricultural production correspond to the total territory of Kenya, or 4.8% of Africa’s total agricultural areas.2 Africa stands in stark contrast to other continents, where large-scale land acquisitions account for 1.1% and 1.2% of agricultural land in Asia and Latin America respectively. Even if only a small share of the agricultural area in Asia is targeted by land acquisitions, the 307 reported deals make up a considerable surface of 17.8 million hectares.
2 Source: http://faostat.fao.org/
This pattern of distribution may reflect the strong media interest in African deals, as much as real-world differences in volumes of transactions. That said, in Asia, population density and current land pressures seem to constrain large-scale land acquisitions; Latin America has known a strong concentration pattern of its agricultural land in the 1980s, leaving less room for the present large-scale acquisition dynamics.
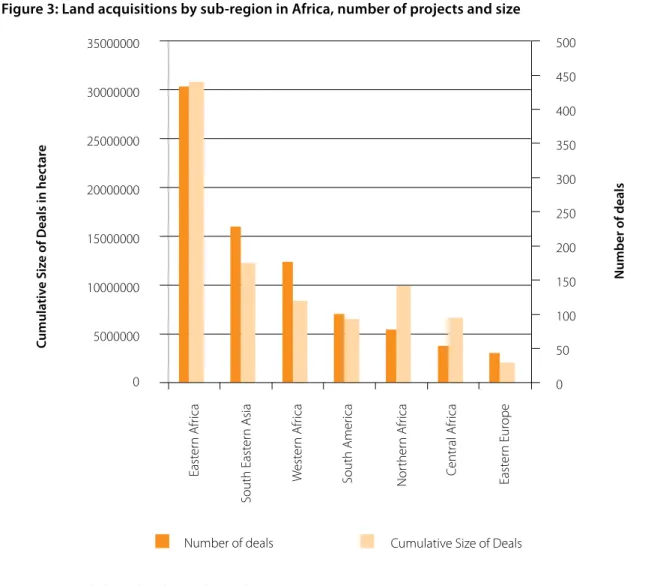
There are also significant differences between sub regions (see Figure 3). Eastern Africa is clearly the most targeted area in the World with 1/3 of the reported projects and area affected. The concentration of deals in this part of the world is even more significant (45%) if we only consider reliable data. Western Africa appears to be the third most targeted area (15% of all projects), after South- East Asia (19% of all the projects; 25% according to reliable data).
Figure 2: Land acquisitions by region, number of projects and size
Source: Authors’ calculations based on the Land Matrix.
Notes: N = 1217 for number of deals and N = 917 for cumulative size of deals
0 100 200 300 400 500 600 700 800
0 10000000 20000000 30000000 40000000 50000000 60000000
Africa Asia Americas Europe/Oceania Cumulative size of deals
Number of deals
Cumulative Size of Deals in hectare Number of deals
2.
Figure 3: Land acquisitions by sub-region in Africa, number of projects and size
Source: Authors’ calculations based on Land Matrix data.
0 50 100 150 200 250 300 350 400 450 500
5000000 10000000 15000000 20000000 25000000 30000000 35000000
Eastern Africa South Eastern Asia Western Africa South America Northern Africa Central Africa Eastern Europe
0
Cumulative Size of Deals Number of deals
Cumulative Size of Deals in hectare Number of deals
A national perspective: concentration on selected countries with specific characteristics
Few countries are hosting the large majority of land acquisitions
The demand for land by foreign actors seem to be widespread in developing countries around the world. Although a large number of countries (84) are targeted by foreign investors, 11 countries of them concentrate 70% of the reported targeted surface.
Among those 11 countries 7 are African (Figure 4).
African countries also represent half of the countries
in the top 20 most targeted countries for land acquisition for agricultural production according to reported observations. Countries such as Sudan, Ethiopia, Mozambique, Zambia, DR Congo and Tanzania are facing a large part of the reported demand for land by foreign actors, both in terms of cumulative size and number of projects. Although the share of reliable observations differs from one country to another, most of these countries are still among the most targeted even when only reliable
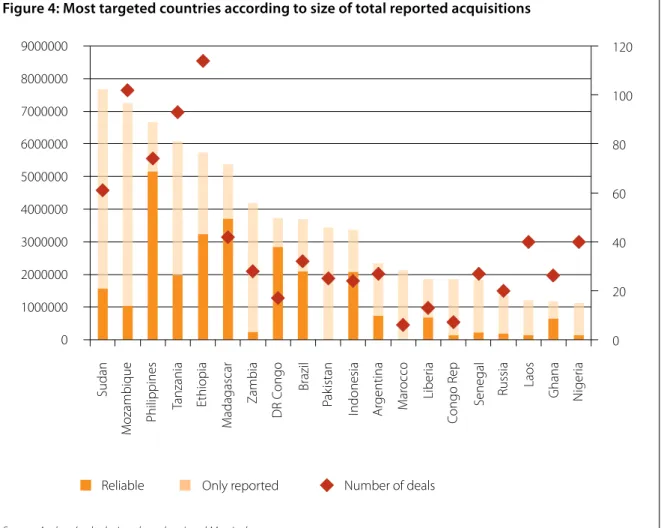
Figure 4: Most targeted countries according to size of total reported acquisitions
Source: Authors’ calculations based on Land Matrix data.
0 20 40 60 80 100 120
0 1000000 2000000 3000000 4000000 5000000 6000000 7000000 8000000 9000000
Sudan Mozambique Philippines Tanzania Ethiopia Madagascar Zambia DR Congo Brazil Pakistan Indonesia Argentina Marocco Liberia Congo Rep Senegal Russia Laos Ghana Nigeria
Only reported
Reliable Number of deals
observations are considered. In other words, the strong interest of investors for African countries can be confirmed by our data.
Asia is the second most targeted continent. South-East Asian countries such as the Philippines (74 deals on 6.6 million ha; or 5.2 million ha according to reliable data), Indonesia (24 deals on 3,36 million ha; or 1.3 million according to reliable data) and Laos (40 deals on 1.1 million ha reported; 140,000 ha reliable) are most prominently represented. In South Asia, Pakistan and India are also among the main targeted countries.
In Latin America, Brazil (32 reported deals on 3.7 million ha; 2.1 million ha reliable) and Argentina (27 reported deals on 2.7 million ha; 1 million ha reliable) are the most targeted. Both Brazil and Argentina already have well-developed agricultural-food value chains.
Domestic actors operate large-scale farms, facilitating the establishment of foreign investors who are able to mimic these models (Collier & Venables, 2011).
Many other Latin American countries are also facing commercial pressure on land, yet with different drivers (mining and conservation) and/or actors (domestic investors), as in the cases of Peru, Chile and Colombia.
Former socialist countries such as Ukraine and Russia are the main non-OECD European countries concerned by this phenomenon as target countries.
Food crop production, particularly cereal production, is the main reason for investors to acquire land in
those countries. Farmlands are among the most fertile in the world and the land tenure structure is favorable for investors (Cochet and Merlet, 2011). Because of our coverage limitations, the scale of the phenomenon in this part of the world is underrepresented.
Socio-economic and institutional characteristics of target countries
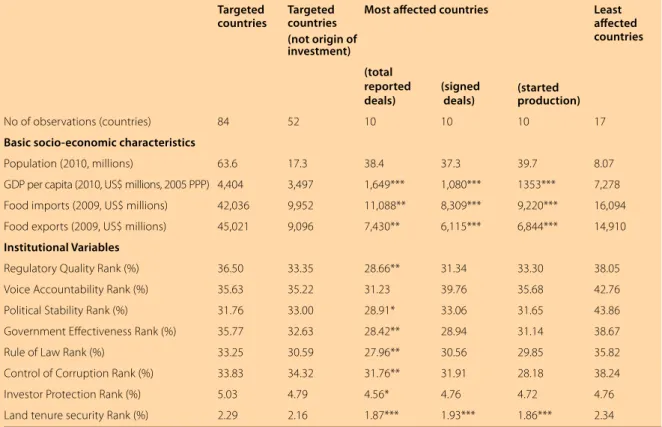
There are many differences between countries that are targeted by investors, particularly in terms of the intensity with which they are targeted. Nonetheless, it is possible also to identify some key characteristics that they tend to share. Table 4 compares different categories of target countries and countries of origin according to selected socio-economic and institutional development indicators (all target countries; countries that are only targeted and are not simultaneously the origin of investment; the 10 most affected target countries and the 17 least affected target countries).
Table 4 shows that the most affected countries are significantly poorer than both the least affected countries and the average of targeted countries.
They are also less involved in world food exchanges.
This confirms that the poorest countries, with the least developed economies, in particular agricultural economies, are the most targeted by investors.
Data on governance suggest that institutions are significantly weaker in the most affected countries (those with most reported deals) than in average target countries. These institutions encompass regulatory frameworks, government effectiveness, the rule of law, corruption control and investor protection.
However, governance indicators are not significantly weaker for the countries with most signed deals and where production has most frequently begun. This result suggests that governance issues, especially regarding investor protection, are a determining factor for effective engagement in agricultural production.
But land governance institutions present a different case. The most affected countries (including countries with the highest number of contracts signed or
Box 1:
The case of Cambodia
Cambodia does not appear among the 20 most targeted countries. However, investor’s interest in this country is significant as 60 deals are recorded in the Land Matrix (for a cumulative size of 400,000 ha). This particularity illustrates the diversity of the phenomenon and the difficulty fo fully measuring the intensity of the investor interest in a particular country.
projects already in production) have weaker land institutions, and this is true for countries with the highest number of contracts signed and projects already in production, as well as for countries with the most reported deals. This provides clear evidence that investors are targeting the poorer countries with weak land tenure security (Arezki et al., 2011). Investors are interested in countries that combine a strong general institutional framework, that protects their investment and allows them to smoothly operate their business, with low land tenure security that gives them easy and possibly cheap access to land.
Table 4: Key socio-economic and institutional indicators of target countries
Targeted
countries Targeted countries (not origin of investment)
Most affected countries Least affected countries (total
reported
deals) (signed
deals) (started production)
No of observations (countries) 84 52 10 10 10 17
Basic socio-economic characteristics
Population (2010, millions) 63.6 17.3 38.4 37.3 39.7 8.07
GDP per capita (2010, US$ millions, 2005 PPP) 4,404 3,497 1,649*** 1,080*** 1353*** 7,278 Food imports (2009, US$ millions) 42,036 9,952 11,088** 8,309*** 9,220*** 16,094
Food exports (2009, US$ millions) 45,021 9,096 7,430** 6,115*** 6,844*** 14,910
Institutional Variables
Regulatory Quality Rank (%) 36.50 33.35 28.66** 31.34 33.30 38.05
Voice Accountability Rank (%) 35.63 35.22 31.23 39.76 35.68 42.76
Political Stability Rank (%) 31.76 33.00 28.91* 33.06 31.65 43.86
Government Effectiveness Rank (%) 35.77 32.63 28.42** 28.94 31.14 38.67
Rule of Law Rank (%) 33.25 30.59 27.96** 30.56 29.85 35.82
Control of Corruption Rank (%) 33.83 34.32 31.76** 31.91 28.18 38.24
Investor Protection Rank (%) 5.03 4.79 4.56* 4.76 4.72 4.76
Land tenure security Rank (%) 2.29 2.16 1.87*** 1.93*** 1.86*** 2.34
Notes: The table shows unweighted averages of country characteristics. “Most affected countries” were selected in three alternate ways: according to the number of reported deals, according to the number of signed deals, and according to the number of deals where production was reported to have begun. The t-test was used to test the significance of the difference between the averages for all targeted countries, and the averages for the 10 most affected countries (according respectively to reported deals, completed deals, and started production). The statistical significance of the differences between most affected country averages and all target country averages is shown as follows: *** denotes significance at the 1%
level (very significant), ** at the 5% level and * at the 10% level.
Source: Authors’ calculations based on the Land Matrix.
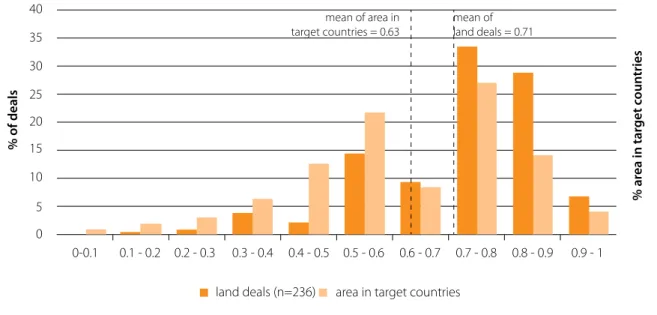
Agro-ecological characteristics of target countries
Resource endowments, and particularly agro- ecological characteristics, are considered to be important factors in determining the targeting of investment (Arezki et al., 2011). Among these characteristics, the “yield gap” and land availability (see Box 2) have been described as major determinants of patterns of land acquisitions, and have been used to provide a typology of investment countries (Deininger and Byerlee 2011, 2012). The yield gap is a measure to compare current yields with potential yields in a given location. It is the difference between performance that is technically achievable and the effective yield observed (FAO and IIASA cited in Arezki et al., 2011). One of the underlying hypotheses explaining the interest in farmland is the availability of land where current yields are low compared to the potential yields, as such land can be improved and its market value increased. Land availability refers to land suitable for rainfed cultivation that is currently non- cultivated, and that has a population density of less than 25 persons per km².
The Land Matrix data was used to test the influence of land availability and yield gap on the distribution of investment interest (Box 2, Figure 5).
This analysis confirmed the usefulness of the typology of target countries proposed by Deininger and Byerlee (2012). Figure 5 shows how target countries can be classified into four groups:
» Type 1: Suitable land available, high yield gap:
These countries (upper-right square in Figure 5) appear to have both land resources of medium and good quality available, and significant potential for increased yields. As Deininger and Byerlee (2012) observe, many target countries fall within this category. Land Matrix data suggests that target countries of this type represent the largest share of land acquired, amounting to 58% of all land deal surfaces. Among the most affected countries in this category, the majority are African, especially from East Africa.
» Type 2: Little suitable land available, high yield gap: In this category, we find a number of West African countries, but also Ukraine, Cambodia and Morocco. Even if only 13% of acquired land falls into this category of target countries, competition for land with the local population may be especially intense, as land is already scarce.
» Type 3: Little suitable land available, low yield gap: This group accounts for 17% of all acquired land surfaces and is dominated by the Philippines, Indonesia and Pakistan. Even though endowed with little available suitable land, these countries
Box 2:
Testing the influence of yield gap and land availability on the targeting of investment Yield gap: to estimate the yield gap in targeted countries, we used global data layers from the global agro-ecological zoning (GAEZ) method developed by the International Institute for Applied Systems Analysis (Fischer, Velthuizen, Shah, & Nachtergaele, 2002). Taking into account local agro-ecological conditions this method assesses the gap between potentially achievable rain-fed yields of five major crops as compared to the current yields.
Available suitable land was estimated from data available from GAEZ (IIASA/FAO, 2010; Fischer, Velthuizen, Shah, & Nachtergaele, 2002). As we considered a larger set of countries than Arezki et al. (2011), we used accessible data layers from GAEZ indicating the suitability of land for five important crops (wheat, oil palm, sugarcane, soybean, and maize) to calculate the average suitability for production of these five crops. This figure was then compared to currently used cropland to give a measure of relative availability of suitable land for each country.
These two indicators were used to establish a typology of all destination countries and all agricultural land acquisitions in the land matrix database (Figure 5).
have attracted large numbers of land acquisitions.
However, there seem to be particular areas in these countries where investors still find attractive land for investment, despite low overall availability of land. Yield gaps may not be uniformly low. This may imply that land is subject to land deals despite the fact that it is already cultivated.
» Type 4: Suitable land available, low yield gap:
This group accounts for only 12% of land deals by surface area. Brazil and Argentina are the
most affected countries in this group, with Laos and China playing a lesser role. Due to large land reserves, and probably good investment climates, these countries seem to be attractive targets for investors despite relatively low yield gaps.
Although it reveals clear patterns, a national-level analysis of the effects of agro-ecological and socio- economic conditions is, on its own, limited. Such conditions, in contrast to governance and macro- Figure 5: The location of land deals in relation to suitable available land and the yield gap
Source: Authors’ calculations based on the Land Matrix; IIASA/FAO 2010.
Notes: The difference between the percentage of land area that is available (uncultivated) and suitable for cultivation, and that is actually cultivated, is given for each country on the horizontal axis. This is used as an approximate measure of scarcity of land. A positive value indicates that more land is suitable yet uncultivated than is cultivated. The vertical axis displays the yield gap. A high value indicates a high gap between potential and actual yields. The land acquired by foreign investors for each country is represented by the size of the bubble in figure 5. The 20 countries most affected by land acquisitions are identified by acronyms.
SDN MOZ
ETH
TZA MDG
PHL
IDN PAK BRA
ZMB COD
ARG SEN
MAR
.LBR
COG
KHM
LAO
UKR RUS
GHA
CHN NGA UGA
BEN
MYS
CMR
PER
0 0,1 0,2 0,3 0,4 0,5 0,6 0,7 0,8 0,9 1
-50 -40 -30 -20 -10 0 10 20 30 40
yield gap
Difference of suitable to cultivated land (%) Size of total deals per target country
MLI
economic factors, vary widely within a country. A complementary analysis at a sub-national level, as provided below, is thus important.
Target countries are affected by hunger and show high agricultural shares of GDP
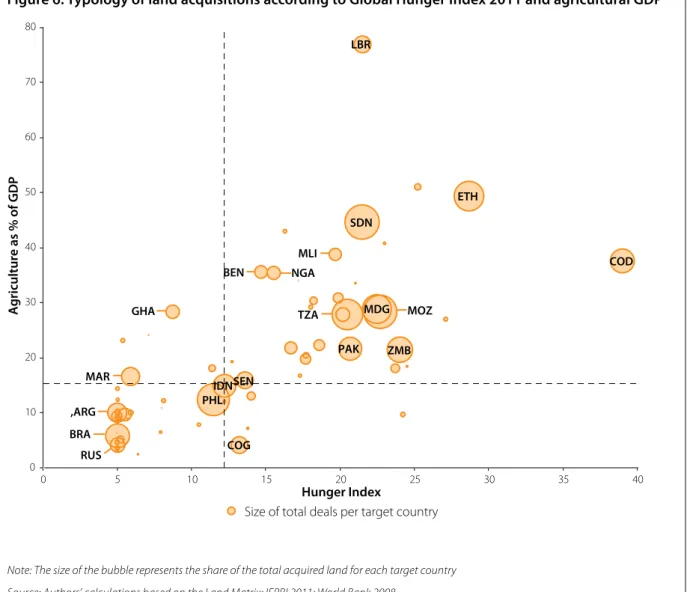
The Land Matrix data show that target countries are significantly poorer than investor countries. In order to illustrate this finding in more detail, the data on land acquisitions was compared with data on the prevalence of hunger and agriculture’s share of GDP for each target country (Figure 6).
Figure 6 illustrates how countries with a high prevalence of hunger tend to be more dependent on agriculture. It also reveals two main groups of target countries. The first group of target countries show above average hunger prevalence and an above average agricultural share of GDP. This group accounts for a share of 66% of the land area acquired in reported deals. A second group scores below average on the Hunger Index and has below average agricultural shares of GDP. These countries host a total of 22% of the total surface of land acquisitions.
The concentration of deals in countries affected by hunger and relatively dependent on agriculture gives cause for concern. As a significant proportion Figure 6: Typology of land acquisitions according to Global Hunger Index 2011 and agricultural GDP
Note: The size of the bubble represents the share of the total acquired land for each target country Source: Authors’ calculations based on the Land Matrix; IFPRI 2011; World Bank 2008.
SDN
MOZ
PHL
TZA
ETH
ZMB
COD
BRA
PAK IDN
,ARG MAR
LBR
COG SEN
RUS
GHA
NGA BEN
MLI
0 10 20 30 40 50 60 70 80
0 5 10 15 20 25 30 35 40
Agriculture as % of GDP
Hunger Index
Size of total deals per target country MDG
of this land is likely to be destined for non-food production or export, investment schemes may have an adverse impact on local food availability. Relative dependence on agriculture suggests that people may have few alternatives for income generation.
Evictions and resettlements are likely to have more adverse impacts under such circumstances than they would in richer societies with more diversified economies. Figure 6 also shows that a number of important target countries (notably Argentina, Brazil and Russia) exhibit very different economic and social conditions from the majority. Here, the socio-economic impacts of land deals may be very different from impacts in most countries.