Innovation Paths in Wind Power
Rasmus Lema Johan Nordensvärd Frauke Urban
Wilfried Lütkenhorst
Joint project with:
Insights from Denmark and Germany
Rasmus Lema Johan Nordensvärd Frauke Urban
Wilfried Lütkenhorst
Bonn 2014
Die deutsche Nationalbibliothek verzeichnet diese Publikation in der Deutschen Nationalbibliografie;
detaillierte bibliografische Daten sind im Internet über http://dnb.d-nb.de abrufbar.
The Deutsche Nationalbibliothek lists this publication in the Deutsche Nationalbibliografie; detailed bibliographic data is available at http://dnb.d-nb.de.
ISBN 978-3-88985-637-1
Rasmus Lema, Assistant Professor, Department of Business and Management, Aalborg University Email: lema@business.aau.dk
Johan Nordensvärd, Lecturer in Social Policy, University of Southampton Email: j.o.nordensvard@soton.ac.uk
Frauke Urban, Lecturer in Environment and Development, School of Oriental and African Studies (SOAS), University of London
Email: f.urban@soas.ac.uk
Wilfried Lütkenhorst, Associate Fellow, German Development Institute Email: wilfried.luetkenhorst@die-gdi.de
© Deutsches Institut für Entwicklungspolitik gGmbH Tulpenfeld 6, 53113 Bonn
+49 (0)228 94927-0
+49 (0)228 94927-130 E-Mail: die@die-gdi.de www.die-gdi.de
least in the wind power sector. These investments in wind energy are driven by the twin objectives of reducing carbon emissions and building up international competitive advantage. Support for wind power dates back to the 1970s, but it has gained particular traction in recent years thus opening up new innovation paths. This paper explores the key features, similarities and differences in innovation paths in Denmark and Germany and sheds light on their main determinants.
The paper shows that there are many commonalities between Denmark and Germany when it comes to innovation pathways, both in technological and organisational innovation. In turbine technology, the similarities are the constant increase in turbine size and quality. The key difference to be found is the relative importance of different turbine designs. The ‘Danish Design’ remains the global standard. The direct drive design, while uncommon in Denmark, dominates the German installation base. Direct drive technology has thus emerged as a distinctly German design and sub-trajectory within the overall technological innovation path.
When it comes to organising wind turbine deployment, both countries have moved along broadly similar paths. There are now fewer turbines deployed than at any time in the past 10 to 20 years, but on average these are concentrated in larger projects and the production capacity and total electricity output has increased significantly in both countries. The key difference is in the role of the offshore segment in deployment: Denmark has been a pioneer in the offshore segment, which has hitherto played a much smaller role in Germany.
While this paper shows that there are many common features between the two countries, it also identifies a diversity of pathways, or rather, a co-existence of different sub- trajectories in both core technology and in the organisation of deployment. It is as yet unclear whether the future will bring more convergence or divergence.
To address this, the paper explores specific determinants of innovation paths: government policies, demand conditions, geography, value chains, and the strategies undertaken by firms. It demonstrates that the innovation paths common to both countries have roots in a confluence of determining factors which are mainly due to social and political priorities, preferences and decisions at national level. However, the sub-trajectories, which create variation between Denmark and Germany, differ in this regard. They tend to have roots in
‘given’ geographical conditions and in company-level technology choices. In other words, many of the similarities in innovation paths between Denmark and Germany have common national causes, while company-specific strategies also influence the innovation paths in significant ways. This raises important questions about the national specificity of innovation paths in wind power development.
Finally, the paper briefly addresses the increasing global interconnectedness of wind technology markets and the role of emerging new players, such as China and India.
complex issues the world has ever faced. Technological innovation plays a major role in taking on this challenge. Old and new industrial powers alike are increasingly reforming their policy frameworks to encourage low carbon innovation, and investments are following.
Evolutionary economics has clearly demonstrated how initial choices of technologies and institutional arrangements preclude certain options at later stages; hence, situations evolve in an incremental and cumulative way, resulting in context-specific technological pathways.
Such path dependency implies that technologies and institutions do not progressively converge toward a unique best practice, as neoclassical equilibrium models might suggest.
The historical and social embeddedness of such evolutionary processes instead results in a variety of very different technologies and institutions across countries.
The starting assumption of our research was that low carbon technologies depend on politically negotiated objectives and policies to a particularly high degree, mainly due to the failure of markets to reflect environmental costs. The way national governments and industries deal with the low carbon challenge varies greatly depending on levels of environmental ambition, technological preferences (such as different attitudes towards nuclear energy, shale gas, carbon capture & storage), the ways markets are regulated, and the importance attached to expected co-benefits (such as exploiting green jobs or energy security). Consequently, low carbon technologies are more likely to evolve along diverging pathways than other technologies whose development is more market-driven.
To test this assumption we conducted the international research project “Technological trajectories for low carbon innovation in China, Europe and India”. The project explored whether, to what extent and why technological pathways differ across countries. Case studies were conducted in two technological fields, electromobility and wind power technologies, in China, India and leading European countries. Whether a diversity of pathways emerges or a small number of designs becomes globally dominant has important implications. From an environmental perspective, diversity may help to mobilise a wide range of talents and resources and deliver more context-specific solutions. Convergence, on the other hand, might help to exploit economies of scale and thereby bring about bigger and faster reductions in the cost of new technologies. From an economic perspective, diversity may provide niches for many firms, whereas a globally dominant design is likely to favour concentration in a small number of global firms – which may or may not be the established ones. Comparing European incumbents with Asian newcomers is particularly interesting, because China and India might well become the gamechangers – responsible for most of the increase of CO2 emissions but also leading investors in green technology.
In addition, the project explored lessons for international technology cooperation, emphasising ways to navigate the trade-offs between global objectives to mitigate climate change effects and national interests to enhance competitiveness and create green jobs locally.
The project was carried out between 2011 and 2014 as a joint endeavour of four institutions:
the German Development Institute / Deutsches Institut für Entwicklungspolitik (DIE), the Institute of Development Studies (IDS) Brighton, the Indian Institute of Technology (IIT) Delhi, and the School of Public Policy at Tsinghua University, with additional collaborators from the Universities of Aalborg, London and Frankfurt. The project was truly
Eight reports have been published in, or are currently being finalised for, the DIE Discussion Paper series:
1. Schamp, Eike W. (2014): The formation of a new technological trajectory of electric propulsion in the French automobile industry
2. Chaudhary, Ankur (2014, forthcoming): Electromobility in India. Attempts at leadership by businesses in a scant policy space
3. Altenburg, Tilman (2014, forthcoming): From combustion engines to electric vehicles: Implications for technological trajectories. Case study Germany
4. CHEN Ling, Doris FISCHER, SHEN Qunhong and YANG Wenhui (2014, forthcoming): Electric vehicles in China – Bridging political and market logics 5. Lema, Rasmus, Johan Nordensvärd, Frauke Urban and Wilfried Lütkenhorst (2014,
forthcoming): Innovation paths in wind power: Insights from Denmark and Germany 6. DAI, Yixin, Yuan ZHOU, Di XIA, Mengyu DING, Lan XUE (2014, forthcoming):
Innovation paths in the Chinese wind power industry
7. Narain, Ankita, Ankur Chaudhary and Chetan Krishna (2014, forthcoming): The wind power industry in India
8. Bhasin, Shikha (2014, forthcoming): Enhancing international technology cooperation for climate change mitigation. Lessons from an electromobility case study
On the basis of these case studies, the team is currently working on a series of cross-country comparative analyses to be published in academic journals.
The research team is very grateful for generous funding and the very supportive attitude of the Swedish Riksbankens Jubileumsfond under a joint call with the Volkswagen Foundation and Compagnia de San Paolo.
Bonn, April 2014 Tilman Altenburg
Abbreviations
1 Introduction 1
1.1 Research questions 2
1.2 Innovation paths 2
1.3 Examining innovation paths in wind power 3
1.4 The country cases 5
1.5 Data collection 6
1.6 Paper structure 7
2 Innovation paths in Denmark and Germany 9
2.1 Turbine size 9
2.2 Turbine reliability 12
2.3 Turbine design 15
2.4 Onshore/offshore installation 17
2.5 Project size 22
2.6 Services 24
2.7 Summary 25
3 The key determining factors 28
3.1 Government policies 29
3.1.1 Policy context and evolution 29
3.2 Policy measures: boosting demand and supply 32
3.2.1 Demand-side policy measures 32
3.2.2 Supply-side policy measures 35
3.2.3 How policies influenced innovation paths: summary 37
3.3 Business context 38
3.3.1 Corporate actors in Denmark 38
3.3.2 Corporate actors in Germany 39
3.4 Company strategies: integration and internationalisation 41
3.4.1 Vertical and horizontal integration strategies 41
3.4.2 Domestic versus export market focus 43
3.4.3 How company strategies influence the innovation paths: summary 44
3.5 Demand conditions 45
3.5.1 Volume of demand 45
3.6 Factor conditions 49
3.6.1 Factor costs 49
3.6.2 Geographical endowments 50
3.6.3 How factor conditions influence the innovation paths: summary 51
3.7 Related firms, networks and clusters 53
3.7.1 How related firms and network influenced the innovation paths: summary 54
3.8 Summary 55
4 Conclusions and outlook 57
4.1 Innovation paths in Denmark and Germany 57
4.2 Explaining the similarities and differences 58
4.3 Pathways and national specificity 59
4.4 Pathways and globalisation 62
4.5 The need for international comparison 63
Bibliography 65
Annex
Annex 1: Wind and other renewable energy policies in the European Union 73 Table A1: Climate energy and wind policies in the European Union 73 Annex 2: Examples of key wind energy actors in Denmark and Germany 75
Table A2: Key actors in Denmark 75
Table A3: Key actors in Germany 76
Figure 2: Average size of turbines installed each year 10
Figure 3: Turbine size classes by global market share 10
Figure 4: Market shares in mainstream and multi-MW markets 11
Figure 5: Danish offshore capacity factors 13
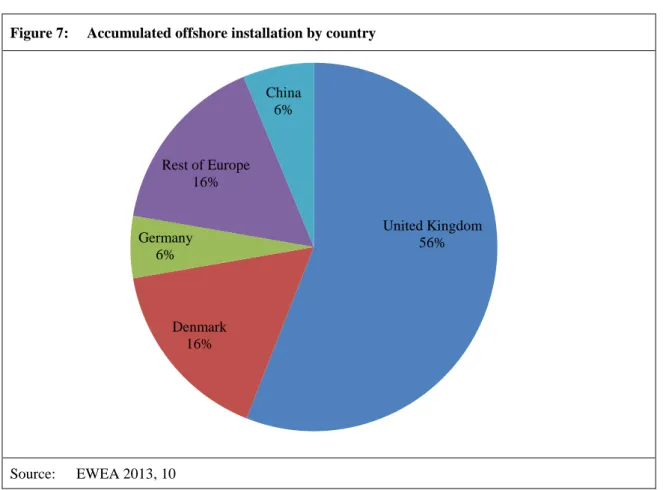
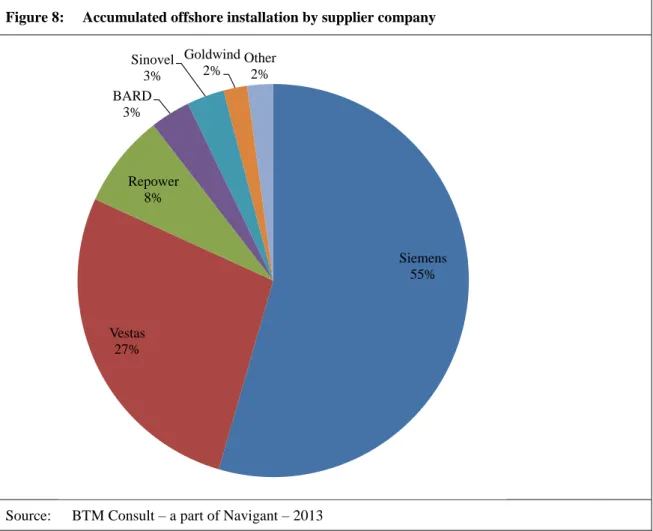
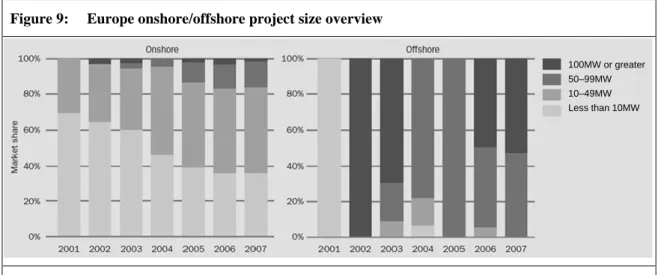
Figure 6: Annual onshore and offshore installations in Europe 18 Figure 7: Accumulated offshore installation by country 19 Figure 8: Accumulated offshore installation by supplier company 20 Figure 9: Europe onshore/offshore project size overview 23
Figure 10: Average offshore wind farm size 23
Figure 11: Global market shares and number of markets served by lead firms 44
Figure 12: Wind energy output 2000–2012 45
Figure 13: Share of electricity generated from wind energy 2000–2012 46 Tables
Table 1: Specific criteria for analysing innovation paths in wind energy 5 Table 2: Main elements for analysing determinants of innovation paths 5 Table 3: Innovation cases addressing different aspects of the innovation paths 8 Table 4: Onshore and offshore capacity in Denmark and Germany (2012) 18
Table 5: Summary of the core technology paths 25
Table 6: Summary of the deployment paths 26
Table 7: National wind policies in Denmark and Germany 33
Table 8: Typology of support policies 35
Table 9: Key geographical differences between Denmark and Germany 51
Table 10: Summary of key determinants: shared paths 56
Table 11: Summary of key determinants: distinct paths 56
Boxes
Box 1: Interviews in Denmark 6
Box 2: Interviews in Germany 7
Box 3: Innovation case – Vestas V112 14
Box 4: Innovation case – Enercon E126 16
Box 5: Innovation case – Horns Rev II 18
Box 6: Innovation case – Alpha Ventus 52
Box 7: Innovation case – Envision 128/3.6 PP 2B 60
Box 8: Innovation case – Vensys 2.5 61
BMUB BMVi BMWi BNEF BWE CCS CHP CSP DD DEA DFIG DTU DVES DWIA EEG ETS EU EUDP EWEA FDI FIT GHG GW GWEC GWh IEA IEC IPCC IPRs IWES KIBS km kW kWh LCOE LORC MNC m m/s MW NGOs
Bundesministerium für Umwelt, Naturschutz, Bau und Reaktorsicherheit (German Federal Ministry for the Environment, Nature Conservation, Building and Nuclear Safety)
Bundesministerium für Verkehr und digitale Infrastruktur (German Federal Ministry for Traffic and Digital Infrastructure)
Bundesministerium für Wirtschaft und Energie (German Federal Ministry for Economic Affairs and Energy)
Bloomberg New Energy Finance
Bundesverband WindEnergie (German Wind Energy Association) Carbon capture and storage
Combined heat and power Concentrated solar power Direct drive
Danish Energy Authority Doubly-fed induction generator Danish Technical University Danish Wind Electricity Society Danish Wind Energy Association
Erneuerbare Energien Gesetz (Renewable Energy Law, Germany) Emission Trading Scheme
European Union
European Union Demonstration Project European Wind Energy Association Foreign direct investment
Feed-in tariff Greenhouse gas Gigawatt
Global Wind Energy Council Gigawatt hour
International Energy Agency
International Electrotechnical Commission International Panel on Climate Change Intellectual property rights
Institute for Wind Energy and Energy Systems (Fraunhofer) Knowledge-intensive business service
Kilometre Kilowatt Kilowatt hour
Levelised cost of energy
Lindoe Offshore Research Centre Multinational corporation Metre
Metre per second Megawatt
Non-governmental organisations
OEM Original equipment manufacturer PMDD Permanent magnet direct drive
PV Photovoltaics
R&D Research & development
RE Renewable energy
SME Small and medium-sized enterprises S&T Science and technology
SET Strategic Energy Technology Plan (Europe) SOE State-owned enterprise
TSO Transmission system operator
UK United Kingdom
UNFCCC United Nations Framework Convention on Climate Change
US United States
VDMA Verband Deutscher Maschinen- und Anlagenbau (German Engineering Federation) WEC Wind energy converter
WTG Wind turbine generator
1 Introduction
Innovation paths for low carbon transformation are likely to differ markedly between countries because of the diversity in policies, endowments and technological capabilities. These pathways will differ in the approach to, and effectiveness of, mitigating climate change and tackling related domestic energy challenges. But they will also differ in the degree to which low carbon technologies and solutions can become a source of national competitiveness.
There is widespread agreement that the European Union (EU) has so far been a global frontrunner lowering carbon emissions through innovation in policies and technologies.
It has created momentum in new green industries such as the wind power and the electric vehicle industries. The wind power industry in particular is at the front end of the low carbon transformation as it plays a key role in the efforts of European co untries to use more renewable energy. Wind energy is the most commercialised and most successful type of renewable energy presently available. This paper examines the innovation paths that can be observed in Denmark and Germany, the leading wind energy nations in the EU.
These two countries were first movers in the wind industry and quickly developed a strategic advantage that led to the dominance of Danish and German firms in the global industry. To date, Denmark and Germany are leading innovators and markets. Both countries are widely considered as role models in the development of policies to support the expansion of wind energy. However, if national and European targets for wind energy are to be reached, these countries cannot rest on past success. While it is predicted that the use of wind power for electricity production will more than double in the next generation, the specific paths for deployment are hotly debated due to the many interests at stake.
At the same time, emerging economies such as China and India are rapidly catching up in the industry, developing their own policy regimes at home while buying up firms and forming technological alliances abroad. China has become particularly focused on green technology, with wind power now designated as one of five strategic high-tech industries. India has invested fewer resources for domestic deployment, but has world - class wind power R&D centres and firms competing in overseas markets. The rapid development of the ‘rising powers’ influences the global dynamics of the wind power industry.1
The wind energy sector is thus in a flux both globally and nationally. It is not yet apparent how distinct national pathways will be; how they will look; and how fast they will change the local energy systems. To advance our knowledge, the main purpose of this paper is to examine the low carbon innovation paths in Denmark and Germany. It addresses in particular the role of public policy in shaping these innovation paths, but also seeks to examine other factors such as corporate strategies and market evolution.
1 For an assessment of how China is influencing the wind power industry, see Lema / Berger / Schmitz 2013.
1.1 Research questions
This paper examines the innovation paths of Denmark and Germany, the global forerunners of wind energy, to explore how these innovation paths have evolved in the face of domestic challenges combined with global competition and collaboration with new powerful wind energy actors from India and China. The research questions for this paper are the following:
What are the key features, similarities and differences in innovation paths in Denmark and Germany?
What explains these similarities and the differences?
Examining these questions, the paper presents research on the wind energy innovation paths in Denmark and Germany and summarises the key findings from fieldwork in both countries. Complementary research was undertaken on the new economic powers of China and India in order to allow comparison of these trends across regions and countries at various different levels of economic and technological development.
1.2 Innovation paths
Green innovation takes place within the boundaries of common challenges, including the need to decouple growth from resource use, to increase the use of new and renewable energy sources, to increase energy efficiency, and to reduce carbon emissions (Lema et al. 2014). Although these general challenges are shared between nations, specific pathways may evolve in different directions depending on the national starting points.
Evolutionary economics suggest that specific innovation pathways emerge as technological trajectories, i.e. as ‘branches’ in the evolution of a technological paradigm (Dosi 1982).
The pathways tend to be cumulative and self-reinforcing because they are continually being shaped by extant capabilities and infrastructures. In other words, innovations are often path-dependent in the sense that they are built upon earlier technologies, experiences with innovation, and with competition strategies (David 1985). Innovation paths are likely to reflect the properties of the countries in which they have evolved.
Such a notion arises from the theory of national innovation systems (Nelson 1993;
Lundvall 1992). Pathways in different countries emerge as a context-dependent process involving interaction between firms and other organisations, influenced by the national institutions (e.g. policies), the properties of the underlying technology, and the economi c and social structures of specific countries. Altenburg and Pegels (2012) suggest that innovation pathways in sustainability-oriented industries are particularly country- specific due to the important role of public policies and public finance. The same conclusion can be reached from literature emphasising technological factors such as the dependence on specific national infrastructures in many carbon-reducing technologies (Jonsson 2000). In other words, there are strong reasons to believe that innovation pathways will be country-specific.
However, there are forces and dynamics which may pull in different directions. First, path dependence at the national level is not destiny. History is rich in examples of intentional path creation or shifting (Garud / Karnøe 2001). Innovations can be ‘path- creating’ when new constellations are moving in the direction of new techno-economic paradigms or new designs within emerging sub-trajectories. Firstly, innovation paths are emergent properties, shaped by a myriad of processes including interactions between firms and by public organisations seeking to steer their direction (Garud / Kumaraswamy / Karnøe 2010). Second, while national institutions and system-level factors are important, the role of individual firms tends to be overlooked. Where rival technological standards exist, dominant designs are often decided in the battles of particular lead firms. In other words, innovation paths may be company-specific rather than country-specific. Third, the national level may be over-emphasised when industries are characterised by global inter-connectedness. National distinctiveness may play less of a role when technologies are mobile and subject to significant international ‘transfer’
through global trade, globally mobile engineers, foreign direct investment, or mergers and acquisitions. Flagship firms are likely to originate from particular green ‘lead markets’, but this dynamic home base will often be used as a platform for subsequent diffusion through export initiatives and other cross-border activities (Beise / Rennings 2005). Thus technologies become international, as opposed to country-specific, and this may be reinforced by the adoption of ‘best practice’ policies within specific domains, which lead to similarity in outcomes. Against this backdrop, the paper examines what the dominant trends are in the European wind power industry. It seeks to unravel to what extent, how and why the innovation paths are different or similar in the Danish and German wind industry.
1.3 Examining innovation paths in wind power
In the wind power industry, innovation takes place at two different levels: at the core technology level (the wind turbine) and at the deployment level (the installation of turbines).2 Different firms tend to specialise in different activities at both levels. In core technology, the main actors are wind turbine generator (WTG) producers such Danish Vestas or German Enercon and component suppliers such as LM, a Danish blade manufacturer. At the deployment level, the key firms are utility firms such as Dong Energy (Denmark) or RWE (Germany) or independent power producers, which may be independent firms or cooperatives. A range of other firms also engage in deployment including planning, construction and logistics firms and consultancy services providers and operation as well as maintenance (O&M) services providers. There is no strict division between the two levels. For example, turbine manufacturers partake in deployment in various ways, usually in O&M. Thus, different paths may emerge at both different levels. While in core technology there are rival turbine designs, there is also a variety of deployment models. The latter exhibit key differences in siting (on or offshore and micro-siting within farms)3, turbine size, wind farm size, business models, and
2 See Lema et al. 2011, Section 2.2. and Figure 2.1.
3 Wind farm siting has two elements: Macro-siting (or just siting) refers to the identification of the most suitable locations for the installation of wind parks. It involves an investigation of the most suitable location where the park can be located, considering a range of relevant factors. Micro-siting refers to
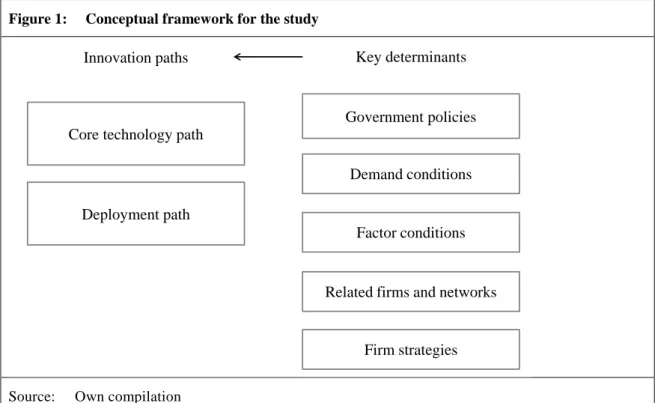
integration into the electricity system. The distinction between core technology and deployment is analytically useful – even though the boundary between the two is blurred in reality.4 It is used in this paper to unbundle the notion of innovation paths (technological trajectory), as shown on the lefthand column of Figure 1.
As mentioned, much contemporary theory emphasises the importance of the national level in shaping innovation paths and distinct sources of competitiveness (Schmitz / Altenburg 2014). Porter (1990) emphasised ‘the diamond factors’: demand conditions, factor conditions, firm networks, and individual firm strategies. Government policies were initially seen as semi-external to the diamond model, as their function was to influence the four core determinants. But many observers have pointed out that government policies tend to influence the four factors to such an extent that policies alone could sometimes be used to analyse patterns of specialisation. While the diamond factors are suitable for a rapid appraisal of determinants, government policies must be given at least equal weight. As shown in Figure 1, these will be used to structure the analyses of the determinants of innovation paths.
Figure 1: Conceptual framework for the study
Source: Own compilation
Table 1 provides the specific criteria for dealing empirically with innovation paths in wind power, covering both core technology (first three criteria) and deployment (last three criteria). Table 2 provides the main elements for examining the determinants. In this way, the five determinants can be unbundled – an essential step towards detecting the investigation of the park’s layout, which includes investigating the relevant technological and economic factors. It thus refers to the careful placement of each turbine. The specific position of each turbine is important because a small difference can potentially double output (Ntoka 2013). Note that siting also has an alternative spelling as ‘sitting’.
4 For example, the quality of the core technology (i.e. the turbine) can only be finally assessed when deployed.
Innovation paths
Core technology path
Deployment path
Government policies
Demand conditions
Factor conditions
Related firms and networks
Firm strategies Key determinants
the myriad of ways in which they influence innovation paths. While we address the general influence of these factors throughout this section, the summary subsection at the end of the chapter will establish the links to specific paths most explicitly.
Table 1: Specific criteria for analysing innovation paths in wind energy
Turbine size: Nameplate capacity in MW
Turbine quality: Reliability as reflected in actual turbine capacity factors
Turbine design: Use of gear versus direct drive models
Onshore/offshore installation: Share of offshore segment compared to the onshore segment
Project size: Project capacity in megawatts and number of
turbines
Deployment services: Operation and maintenance (O&M) services content of new deployment projects
Source: Own compilation
Table 2: Main elements for analysing determinants of innovation paths
Government policies: Demand-side policies
Supply-side policies
Firm strategies: Vertical and horizontal strategies and focus
areas
Focus on domestic/export market
Demand conditions: Volume of demand
Nature of demand
Factor conditions: Geographical endowments
Factor costs
Related firms and networks: Value chains
Industrial clusters Source: Own compilation
1.4 The country cases
Denmark has been the world leader in turbine technology for more than thirty years.
Danish firms hold 25% of the total global turnover in this industry. Denmark is also a key location for inbound investment in wind power development activities, such as research and development (R&D), testing, and high-quality production. This status has been achieved with the strong support of government policy. Today, wind energy constitutes more than 30% of electricity consumption in Denmark. A 2012 agreement concluded by all major parties in parliament stipulates that 50% of the electricity consumption in Denmark shall be supplied by wind power by 2020.
While Denmark has historically been the global first mover in wind energy, Germany is today Europe’s largest, and the world’s third largest, wind energy market after China and the United States (BWE 2012). Germany had an installed capacity of more than 30GW by the end of 2011 and its installed capacity and market has been growing continuously since the mid-1990s (BWE 2012; IEA 2013). The large majority of installed capacity is onshore, with only about 253MW (0.253GW), less than 1%, being offshore in 2011 (IWES 2012). After years of stagnation and financial crisis, the wind energy sector seems to have recovered with growing installation trends. This is due to the so-called ‘second spring’ with large wind energy capacity being added in areas of low wind speeds in southern Germany (BWE 2012). The German government has targets in place for 35% of the total electricity to come from renewable energy by 2020, 50% by 2030 and 80% by 2050, of which wind plays an important role.
1.5 Data collection
Interviews were conducted in Denmark and Germany. For Denmark, substantial parts of the material contained in this paper draw on interviews in the first quarter of 2013.
These interviews were conducted by Rasmus Lema and Søren Møller Andersen and focused mainly on the innovation paths. Prior interviews were made to establish the context and trends. These first rounds were undertaken with Shikha Basin (April 2012) and with Yixin Dai, Yuan Zhou and Ankita Narain (May 2012) (see Box 1).
Box 1: Interviews in Denmark
Representatives from the following organisations were interviewed in Denmark:
BTM Consult,
Danish Energy Authority (DEA, Ministry of the Environment),
Danish Wind Design (turbine design),
Danish Wind Energy Association (DWIA, business association),
Dong Energy (utility firm),
DTU/Risø Research Centre on Renewable Energy,
Envision (turbine manufacturer),
LM Wind Power (the world’s largest supplier of turbine blades),
Mita-Teknik (supplier of control system equipment and business services),
Norwin (turbine design and consultancy),
Danish Energy Association (business association),
Vestas (turbine manufacturer),
Windar Photonics (sensor technology).
In Germany, the fieldwork involved interviews with 12 key actors. These actors were (wind) energy firms, business associations, research organisations and government agencies. The aim was to assess the trends of the German wind energy sector with regard to innovation paths and specific innovation milestones. The interviewees were selected based on leading positions in their organisations and their expertise in relation to the German wind energy sector. The German interviews were conducted by Frauke Urban and Johan Nordensvärd in the third quarter of 2012 at various sites in Germany (see Box 2).
Box 2: Interviews in Germany
Representatives from the following organisations were interviewed in Germany:
AREVA (wind energy firm),
BMU (German Ministry for the Environment),
Bosch Rexroth (supplier firm),
CEwind (research organisation),
Enercon (turbine producer),
EWE (energy firm),
ForWind (research organisation),
REpower (wind energy firm),
Vattenfall (energy firm),
VDMA Power Systems (business association),
Vensys (wind energy firm),
Vestas (wind energy firm).
Secondary data comes mainly from reports of sectoral organisations, notably the German Wind Energy Association (BWE), the Danish Wind Energy Association (DWIA), the European Wind Energy Association (EWEA), and the International Energy Agency (IEA).5
The interview questions were based on semi-structured questionnaires. The questions followed an interview schedule, which was used for all four case study countries involved in the overall project: Denmark, Germany, China and India. The interviews in Denmark and Germany were (mostly) conducted in the local languages and then translated into English to ensure consistency with the overall project. Information which is not referenced in this report is derived from the interviews.
1.6 Paper structure
The body of the paper is structured according to Figure 1, covering the contextual setting in Denmark and Germany, the innovation paths, and the key determinists. The outline is as follows:
Section 2 identifies key characteristics of the innovation paths in Denmark and Germany, covering both the core technology and the deployment dimension. It does so by examining the development trends along the six ‘indicators’ specific to the wind energy industry when it comes to the technological-sectoral pathway in this industry.
The section shows that there are many common features of the innovation paths in
5 Additional policy information was derived from desk research in Phase 1 of the project which aimed to analyse national climate change mitigation policies, energy policies, and industrial policies relevant for the wind sectors. This involved a review of existing literature and data for assessing the key policies and strategies in place at the national level (and the regional level for the EU) to achieve climate change mitigation, particularly in relation to wind energy. See the outputs and reports from Phase 1 for details (Urban et al. 2012).
both countries, but also some notable differences, both in core technology and deployment.
Section 3 discusses the main determinants that shape the innovation paths in these two European countries. It focuses on what explains the similarities and differences, drawing heuristically on the factors identified by Schmitz and Altenburg (2014), who in turn draw on Porter (1990) in his attempt to understand the competitive advantage of nations. The section shows that the similarities between the innovation paths have roots primarily in factors that are socially and politically determined. The differences, on the other hand, tend to have roots in firm-level technology choices and given geographical conditions.
Section 4 pulls together the key findings of our research and provides a discussion of the innovation paths in Denmark and Germany. It sums up the insights with regard to how one can explain the similarities and differences between these two countries.
Against this background it then discusses the nature and degree of national specificity in innovation paths, the role of globalisation, and firm-level factors in this regard and finally puts forth questions for a future research agenda.
The paper includes six ‘innovation cases’, which are described in text boxes. These are included to provide some flesh and to illustrate aspects of the pathways at the case level.
Although the case boxes are distributed between different sections of the paper, all of these cases illuminate multiple aspects of the innovation pathways. The sources for these cases are interviews with company representatives, company documents and media reports.
Table 3 shows which aspects of innovation pathways the cases illuminate. Some of the case boxes also shed light on the drivers/determinants of these paths, but this is only addressed explicitly in some of the cases.
Table 3: Innovation cases addressing different aspects of the innovation paths Turbine
size
Turbine quality
Turbine design
Onshore/
offshore installation
Project size Deployment services
Vestas V112
Enercon E126
Horns Rev II
Alpha Ventus
Envision 128
Vensys 2.5
Source: Own compilation
2 Innovation paths in Denmark and Germany
In order to show what paths innovations in Denmark and Germany have taken in recent years, this section draws on interviews, but also brings in secondary data. As noted in the introduction, we distinguish between the core technology path and the deployment path.
Specific criteria for the analysis were identified in Table 1. They will be further specified and elaborated in this chapter. The summary section brings out the key differences and similarities between Denmark and Germany.
2.1 Turbine size
There are many reasons behind the overall rise in wind power output in Denmark and Germany and more importantly the growth paths taken – the trajectories which lie behind the aggregate numbers have both similarities and differences. This section examines the development in the nameplate (or nominal) capacity of turbines.6 One of the major sectoral trends is the increasing size and capacity of wind turbines that are developed and sold.
Turbine capacity has been increasing dramatically and all of the leading manufacturers in Europe are taking part in the race to develop ever bigger turbines. This is one important element of the quest to make wind energy compete head-to-head with conventional energy by reducing the levelised costs of energy (LCOE) from wind.
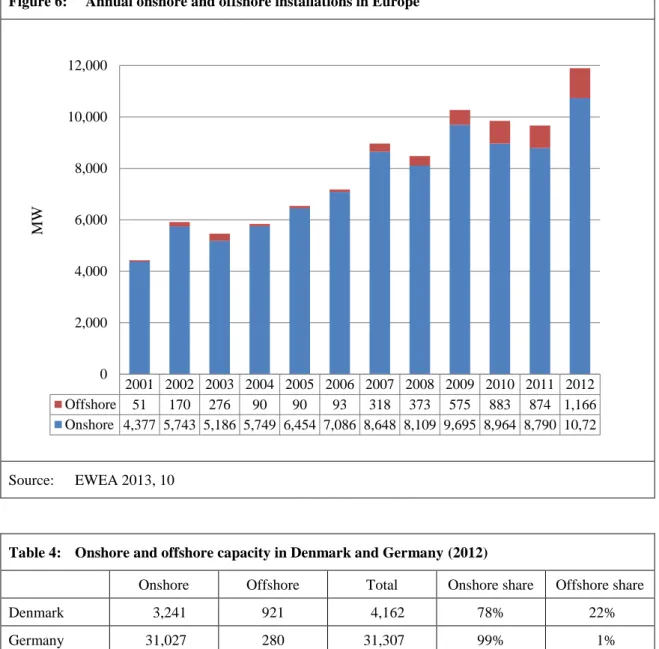
This race is partly related to the increasing shift in market growth from onshore to offshore projects, as offshore turbines tend to be larger than onshore turbines. Hence the shift from onshore to offshore (as discussed below) does not only constitute a deployment trend – there are also different core technologies involved. However, onshore turbines are also increasing in average size, meaning that up-scaling is a general trend in both the onshore and offshore segment.
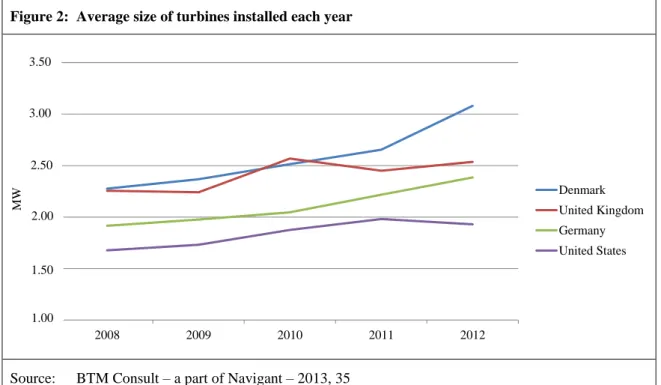
As shown in Figure 2 there is large variation in the average size of installed turbines in different markets. Average turbine sizes are larger in Europe than in the United States and in Asia. Denmark and Germany are both in the global Top Three when it comes to installing large turbines. Denmark is topping the list due to major offshore projects in recent years.
As Figure 3 shows, the current European market (United Kingdom, Denmark, Germany and Spain) is characterised by turbines in the range from 2.0 to 2.5MW. All of the producers are well capable of supplying this demand in terms of turbine size and most have turbines on offer that are above the average range, e.g. Vestas 3.0MW (V112).
However, all of the interviewed manufacturers work under the assumption that market demand will shift towards even bigger turbines in the future. At 7.5MW, the Enercon 126 is a clear example of this trend. REpower has built the world’s largest offshore turbine currently in operation with a size of 6MW. Similarly, all of the producers work on designs for giant turbines, such as the Vestas V164 offshore turbine with a capacity of 8.0MW. This turbine has recently been sold to an offshore project developed by Dong in the United Kingdom
6 This refers to the intended technical full-load sustained output of a turbine and is measured in megawatts (MW).
Figure 2: Average size of turbines installed each year
Source: BTM Consult – a part of Navigant – 2013, 35
Figure 3: Turbine size classes by global market share
Note: Small WTGs constitute a minor share ranging from 0.1% to 0.6%.
Source: BTM Consult – a part of Navigant – 2013, 53
2008 2009 2010 2011 2012
Denmark United Kingdom Germany United States 2.50
2.00
1.50
1.00
MW
3.50
3.00
2008 2009 2010 2011 2012
Denmark United Kingdom Germany United States 2.50
2.00
1.50
1.00
MW
3.50
3.00
Percentageofglobal share
0%
10%
20%
30%
40%
50%
60%
70%
80%
90%
100%
2010 2011 2012
"Multi-MW Class"
>2500 kW
"Mainstream-MW"
1500–2500 kW
"One-MW" 750–1499 kW and "Small WTGs" <750 kW
"Multi-MW Class"
>2,500kW
"Mainstream-MW"
1,500–2,500kW
"One-MW" 750–1,499kW and "Small WTGs" <750kW
at the Burbo Bank Extension Offshore Wind Farm. Several firms are currently conducting R&D for up-scaled turbines of about 10 to 20MW, including Enercon, Vensys, REPower and Siemens. DONG Energy and Vestas have concluded a cooperation agreement to test the V164-8.0MW wind turbine at the Test Centre Østerild in Denmark.
The increasing turbine size has ramifications for deployment because few firms have the experience, equipment and solutions for the transportation and installation of giant turbines offshore. Dong plans to radically increase the size of the offshore turbines it will install, from 3 to 4MW currently to 8 to 10MW between 2016 and 2020.
The up-scaling of wind energy turbines is expected to make wind energy more financially viable, both offshore and onshore and in areas with both strong and weak winds. The continuous up-scaling of wind turbine capacities, towers, rotors, and blades is an on-going innovation path in both Denmark and Germany.7
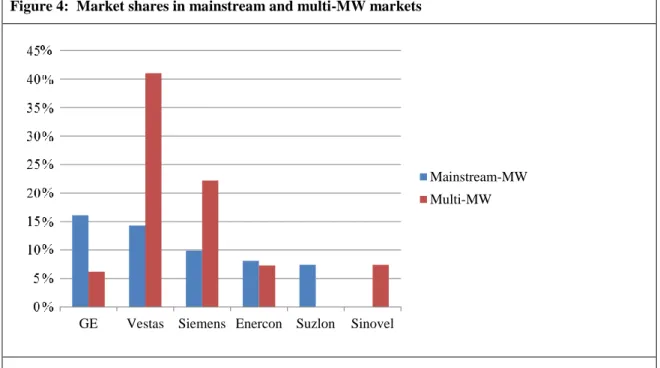
Figure 4 shows the market shares for turbines of different size. There is still a very small market for turbines below 750MW (0.1% of total sales and not included as a separate category). As seen, the mainstream market of 1.5 to 2.5MW turbines is by far the largest segment at 83.5% in 2012. The multi-MW market (turbines above 2.5MW) grew to 12.8%
in 2012. Vestas has the largest market share globally within the multi-MW market segment.
Figure 4: Market shares in mainstream and multi-MW markets
Source: BTM Consult – a part of Navigant – 2013, 53
7 In Germany, the up-scaling trend has been discontinued. A period of rapid up-scaling of wind turbines from small kW-turbines to MW-turbines occurred in the 1990s. These large turbines were called GROWIAN (GROsse WIndenergieANlagen – large wind energy turbines). Nevertheless, the massive up-scaling of turbine capacities failed in the 1990s. As a result, the wind energy industry took a step back and developed smaller turbines, then improved and perfected them step-by-step, until the technology and the industry were mature enough to gradually up-scale the turbine capacities.
GE Vestas Siemens Enercon Suzlon Sinovel
Mainstream-MW Multi-MW
2.2 Turbine reliability
Improvements in turbine reliability are an important feature of the innovation paths in Europe. While many interviewees highlighted the quality dimension, the latter is not easily subjected to empirical verification. This section examines ‘turbine quality’ primarily in terms of reliability of the turbine. Increased reliability is equal to the higher actual electricity yield of a turbine over its lifetime and hence to higher electricity output. On average, this creates lower costs of wind-generated electricity, although the effect depends on the related investment costs.
Wind energy is on the path to reach cost parity with conventional energy in the electricity market. In Denmark, the cost per kilowatt hour (kWh) has been driven down by 80% over the last 20 years (DWIA 2014).8 There are many contributing factors. In addition, the increased reliability of turbines means that O&M costs are reduced; hence it is necessary to take lifetime variable costs into account. O&M includes scheduled and unscheduled maintenance work as well as replacement costs for components including gearboxes, blades and generators. O&M costs typically constitute 20 to 25% of the total cost of wind energy (Kirkegaard / Hanemann / Weischer 2009). This issue is explored further in Section 2.6.
Here the focus is on the innovation process that increases the quality of the turbine and how it results in higher capacity factors.
In theory, large turbines increase power output per turbine and reduce the cost of energy because the number of turbines per project, foundations, and the number of O&M visits is reduced. However, in reality, the relationship is more problematic if larger turbines are less time-tried and because costs can increase compared to mature technologies if there is a higher incidence of faults and breakdowns.
While the point about the turbine quality/reliability was made by several interviewees, the data to back up the reliability claims are scarce and tend to be confidential. However, according to Bloomberg New Energy Finance, the O&M costs have come down rapidly in recent years.
“Average prices for operation and maintenance contracts in the wind sector have dropped 38% in the last four years, boosting the sector’s competitiveness significantly … The wind energy sector is making significant improvements not just in the capital cost and performance of its turbines, but also in the ongoing cost of operating and maintaining them once installed” (BNEF 2012, 1).
The Bloomberg data collected from project owners suggest that Enercon, Vestas and Siemens are the best O&M providers in terms of promptness and quality of service. The full service contract from Enercon was 20% below average market price. The European wind services market is expected to reach EUR 4.5 billion in 2020 from EUR 2.3 billion in 2011 (Deloitte / Touche 2012).
Some insight into the issue of turbine quality can be gained by examining capacity factors.
The capacity factor is an indicator of how much energy a particular wind turbine generates (WEC 2013). It is the actual net output as opposed to the nameplate capacity. To be more precise, the capacity factor of a wind farm is the ratio of its actual output over a period of
8 This trend is likely to continue and result in a fully competitive energy source within 10 years (DWIA 2014).
time, to its potential output if it were possible for it to operate permanently at full nameplate capacity.9
This is determined by wind conditions as well technological factors. Improvements on both the deployment side (siting of farms and micro-siting of turbines) and the core technology side have affected the net capacity factor of turbines over the years. Reflecting on prior average increases from 13% in 1985 to 24% in 2001 (in California), Boccard maintains:
“This is obviously due to technological progress in wind turbines design and possibly to better sitting [location and position]. This hard fact is proof that the learning curve was at work for WPG [wind power generators] during the 80s and 90s. Over the last decade, the wind power industry has noticed an even stronger development” (Boccard 2008, 5).
Figure 5 shows the capacity factors of offshore wind farms in Denmark. It demonstrates a clear trend: the average capacity factors have increased significantly since the early 1990s.
There is a big difference in the capacity factor of Horns Rev II at 48.4% (installed 2009) – for 2012 alone it was as high as 52.0% – when compared to Vindeby 23.5% (installed 1991). New wind projects and the turbines within them are now much more efficient, which has a significant impact on the levelised cost of wind energy. The newest turbines may regularly hit a 50%-capacity factor due to technological changes (Shahan 2012).
Figure 5: Danish offshore capacity factors
Note: The figure shows lifetime capacity factors at Danish offshore wind farms installed between 1990 and 2010. Lifetime capacity factors are the average annual capacity factors recorded from the time of installation until the present time (2013).
Sources: Calculation based on Energy Numbers 2013 and data from DEA 2013
9 To calculate the capacity factor, take the total amount of energy the plant produced during a period of time and divide by the amount of energy the plant would have produced at full capacity.
0%
10%
20%
30%
40%
50%
60%
1990 1995 2000 2005 2010
Life capacity factor
Year of installation
There seems to be no major difference in capacity factors between Danish and German offshore wind farms. While many farms are so new that capacity factors cannot yet be calculated, data show that for example Alpha Ventus and Horns Rev II have similar factors of around 50%. Alpha Ventus has a capacity factor of 50.8% (LORC 2014).
Interviewees suggested that there was little difference in the reliability of turbines between Denmark and Germany however it was not possible to obtain company-level data on the reliability of equipment. Even when it comes to commissioned projects (onshore) there is no readily available data to compare the two countries. However, the overall trend is one of increasing quality, as discussed in this section.
The quality drive was highly visible in all of the micro-level innovation cases. Even at the engineering stage, calculations were made based on cost-of-energy estimates that pinpoint the optimum technology in the trade-off between size and reliability. The cases show how increasing the reliability is a key focus area of equipment development and how European turbine developers factor in both the capital and operation costs in their design calculations.
The Vestas V112 example illustrates several of the paths discussed in this and the prior section. It is a part of the multi-megawatt group of turbines of 3MW and above and has been subject to the most comprehensive testing process in the industry performed to increase reliability. It is also an example of a ‘bundle of innovations’ which drives up efficiency and reliability (see Box 3). While originally built for the onshore market, it has now been developed further into different versions for different conditions, including for offshore deployment.
Box 3: Innovation case – Vestas V112
The V112-3.0MW wind turbine is currently the most popular one in the Vestas line-up. It was launched in the latter part of 2010 and has since been sold to more than 30 customers all over the globe. The V112- 3.0MW reflects the dominant ‘Danish’ design in the industry, a design that Vestas has fine-tuned over the years. This includes the blade design, nacelle design and cooling systems with thousands of components being tested to ensure highest reliability.
While the design cannot be tweaked significantly to suit the needs of different customers, the customer can choose different standardised ‘add-ons’ to meet local weather conditions or local legislation regarding height, etc. Continuous improvement is achieved through these add-ons: if new and better solutions are discovered, these are only implemented after internal verification in Vestas and take the form of minor improvements to the core design.
The V112 was developed over a two-and-a-half year period before the first prototype was erected in Lem, Denmark. Three further prototypes have been installed: one in Spain at a location with extreme weather conditions; one in Germany due to demand from a customer; and one was set up at an offshore location close to Aarhus, Denmark. After installing the V112 prototypes in western Denmark and Spain, small pilot projects were initiated. The turbines on these projects are still running.
Vestas seeks to distinguish itself by having the most advanced test facilities where every component can be tested extensively. Vestas maintains a database on every turbine sold and this enables the firm to identify what types of errors may occur, when they are likely to occur, and how to handle these errors.
The V112 turbine now covers all three wind classes (IEC I, II and III wind speeds) as well as offshore.
The potential market is therefore promising. It is different from another popular wind turbine also produced by Vestas, the V90-3.0MW, which is designed to operate in high wind speeds only. The V112 was developed to perform onshore in low (7.5m/s (metre per second) on average) to medium (8.5m/s on average) wind speeds. However it was soon discovered that the turbine could easily be altered to perform offshore within high wind speeds (10.5m/s on average) with only minor changes to the design.
Box 3 (cont.): Innovation case – Vestas V112
Another spin-off of the V112 turbine is the V126-3.0MW, which was designed to yield maximum power production in low-wind conditions. This turbine is almost identical to the V112: the only difference is a minor alteration to the gearing, some small design changes in the rotor, and the wider rotor diameter. The greater rotor diameter on the V126 makes it very efficient in low-wind settings. The similarity between the V112 and the V126 is as high as 99%.
The original V112-3.0MW has therefore enabled Vestas to introduce two new turbines (the V90-3.0MW and the V126-3.0MW) to the market in a relatively short period of time. The ‘design reserves’ of the V112 enabled Vestas to develop these additional turbines. ‘Design reserves’ for example stem from the fact that the gearbox is more robust than what was demanded in the original V112. It can therefore survive greater loads while the same gearbox, with minor alterations, can be installed in other turbines.
Sources: Interviews with company representatives, company documents and media reports
2.3 Turbine design
Wind turbines with gears are the dominant design in the wind power industry. Gear- model wind turbines are prevalent amongst the wind turbines installed in Denmark, while direct drive models form the majority in Germany with a market share above 60%
(IWES 2013).10 The ‘Danish Concept’ design originates from developments dating back to the 1890s when Danish scientist Paul la Cour received a grant from the Danish government to construct a turbine for electricity generation. With the help of government funding, he founded the Danish Wind Electricity Society (DVES) in 1903 and over the next years more than 30 turbine generators were introduced. The next wave came in the 1950s when the Gedser wind turbine was erected. This was a pioneering design, which laid the foundation for modern turbines.11
Researchers from Risø National Laboratory and firms such as Bonus and Vestas were central to the development of this turbine design:
“They perfected a heavy-duty version of the wind turbine – and it has become the Microsoft Windows of the wind power industry. … these sturdy Danish designs had little of the aerodynamic flash of the earlier U.S. wind turbines; they were simply braced against the wind with heavier, thicker steel and composite materials. They were tough, rugged – and they worked”
(Fairley 2002, 42).
The Danish design evolved during the 1990s with pitching of blades and power electronics and became embedded into the standard Danish drivetrain design. Even though several companies, including Enercon, Siemens Wind Power and GE Wind Energy are adopting direct drive wind turbines, the Danish design still remains the
10 Fraunhofer Institute for Wind Energy and Energy System Technology (IWES), Wind energy report, Germany 2011, 25.
11 The majority of turbines that are installed worldwide are based on the Danish design and contain gears.
Alternative lighter designs backed by US government research support were largely unsuccessful due to ‘over-engineering’ and, after the crisis due to the so-called 1980s ‘California gold rush’, the American lighter design vanished from the market landscape allowing the heavier Danish turbine to become dominant.