Supporting Information for ”Assessing Climate
Impacts and Risks of Ocean Albedo Modification in the Arctic”
N. Mengis1, T. Martin1, D.P. Keller1 and A. Oschlies1,2
Corresponding author: N. Mengis, Helmholtz Centre for Ocean Research Kiel (GEOMAR), D¨usternbrooker Weg 20, 24105 Kiel, Germany. (nmengis@geomar.de)
1Helmholtz Centre for Ocean Research Kiel (GEOMAR), D¨usternbrooker Weg 20, 24105 Kiel, Germany
2Kiel University, D-24098 Kiel, Germany
X - 2 MENGIS ET AL.: ARCTIC OCEAN ALBEDO MODIFICATION
Appendix A: Tracer Analysis
A virtual dye tracer was implemented in the whole Arctic basin north of 70◦N over all depth levels, where it was set to the value 1, at the beginning of the experiment in 2020. To calculate the mean temperature of the water masses that enter the Arctic Ocean, defined as the ocean area north of 70◦N, we started by tracking the dilution of the dye tracer. In order to being able to use this information we subtracted 1 from the tracer field and take the absolute value. This enables us to investigate where water masses entered the Arctic Ocean. The mean temperature of the water masses entering the Arctic Ocean, was then calculated as a weighted mean of all temperatures in the Arctic Ocean marked by the tracer with respect to the grid box volume and the dye tracer concentration.
Tmean,entering(x, y, z, t) =meanx,y,z[T(x, y, z, t)∗tinv(x, y, z, t)∗V(x, y, z)]/
meanx,y,z[t(x, y, z, t)∗V(x, y, z)]
T is the ocean temperature, tinv is the inverted tracer concentration with values in [0,1], and V is the volume of the grid box. Figure S5, shows the mean temperature of entering water masses in the Arctic Ocean over time. Note, that the deep convection events in the default RCP4.5 and RCP8.5 simulations are also detectable in this time series, since these events act to cool the entering water masses.
For the calculation of the vertical temperature profiles as shown in Figure 5b, we did not integrate over z.
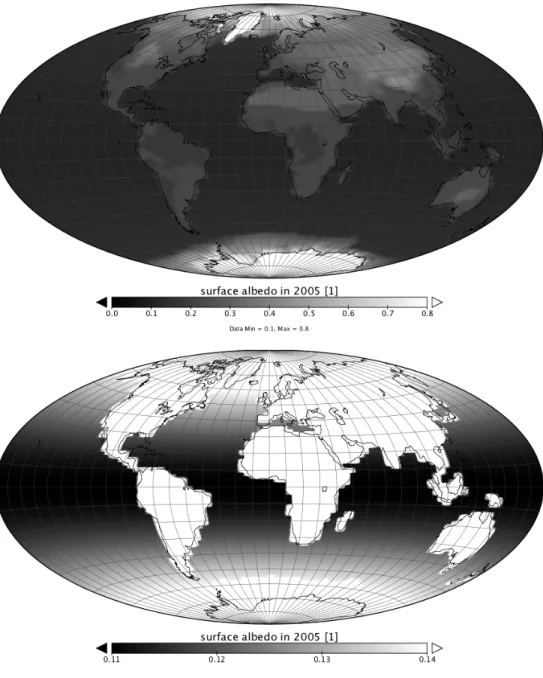
Figure S1. Regional distribution of the surface albedo in UVic ESCM in 2005. top: For a
X - 4 MENGIS ET AL.: ARCTIC OCEAN ALBEDO MODIFICATION
2020 2040 2060 2080 2100 0.8
1 1.2 1.4 1.6 1.8
a
potential energy lost due to convection
PE [10−3 W m−2 ]
2020 2040 2060 2080 2100 4.5
5 5.5 6 6.5 7 7.5
b
sea surface temperature
SST [degC]
2020 2040 2060 2080 2100 33.7
33.8 33.9 34
c
sea surface salinity
SSS [1]
2020 2040 2060 2080 2100 730
740 750 760 770 d
precipitation
P [mm yr−1 ]
RCP8.5 AOAM RCP8.5 RCP4.5 AOAM RCP4.5 noEmit AOAM noEmit
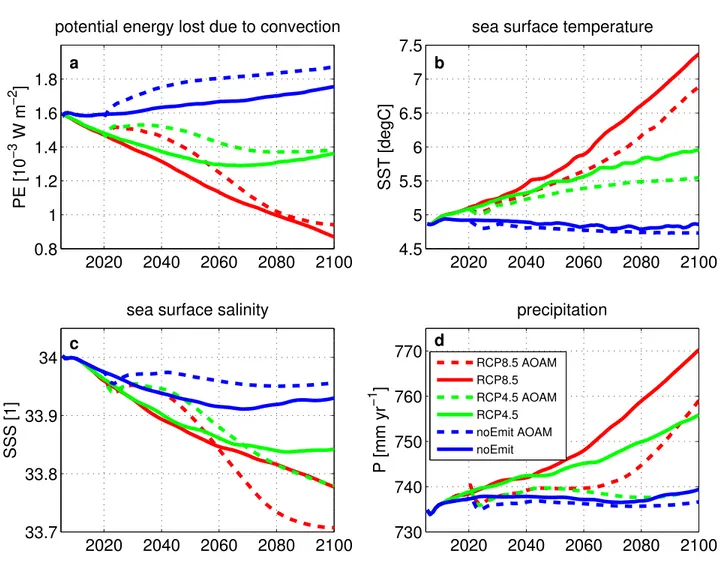
Figure S2. Annual average properties of the Atlantic ocean surface between 50 to 70◦N. a) Potential energy lost to convection; b) sea surface temperature; c) sea surface salinity; and d) precipitation.
Figure S3. left: Location of deep convection areas in 2055, when deep conception is starting to emerge north of 65◦N in the RCP8.5 experiment, as an exemplary temporal snap shots. Shown are annual mean sea ice edges for 2010 (green), 2055 (red) and 2090 (black), to show the ice edge location before and with fully developed deep convection.
right: The location of the newly formed continuous deep convection sites in the Nordic seas in the RCP8.5 simulation averaged over 2090-2100. Shading indicates the average number of convected levels and the black contour is the mean ice edge.
X - 6 MENGIS ET AL.: ARCTIC OCEAN ALBEDO MODIFICATION
depth
RCP8.5
2030 2040 2050 2060 2070 2080 2090 2100 0
500 1000 1500 2000 2500
depth
RCP4.5
2030 2040 2050 2060 2070 2080 2090 2100 0
500 1000 1500 2000 2500
depth
noEmit
2030 2040 2050 2060 2070 2080 2090 2100 0
500 1000 1500 2000 2500
Arctic tracer concentration [1]
0 0.2 0.4 0.6 0.8 1
depth
RCP8.5 AOAM − RCP8.5
2030 2040 2050 2060 2070 2080 2090 2100 0
500
1000
1500
depth
RCP4.5 AOAM − RCP4.5
2030 2040 2050 2060 2070 2080 2090 2100 0
500
1000
1500
depth
noEmit AOAM − noEmit
2030 2040 2050 2060 2070 2080 2090 2100 0
500
1000
1500
Arctic tracer difference [1]
−0.05 0 0.05
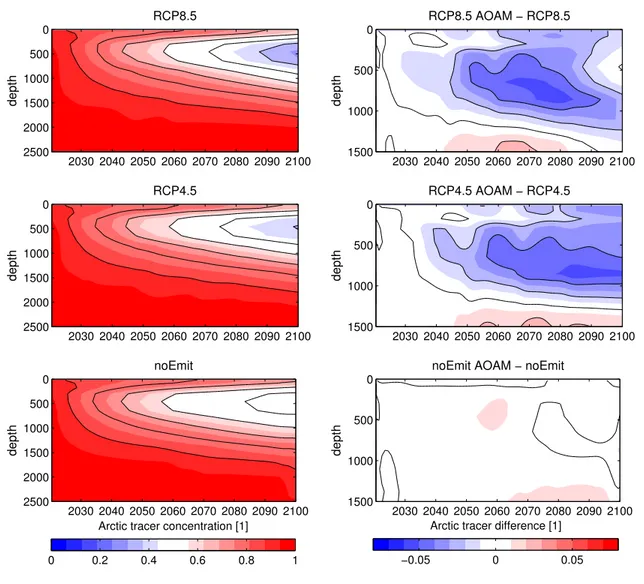
Figure S4. left: Hovm¨oller diagrams of the Arctic tracer for the three default scenarios;
right: Hovm¨oller diagrams of the impact of the AOAM implementation on the mean Arctic vertical tracer concentration.
2020 2030 2040 2050 2060 2070 2080 2090 2100 0.8
1 1.2 1.4 1.6
Mean temperature of tracers entering the Arctic [degC]
RCP8.5 AOAM RCP8.5
RCP4.5 AOAM RCP4.5
noEmit AOAM noEmit
Figure S5. Time series of mean temperature of traced water masses entering the Arctic Ocean, calculated as described in Appendix A. Note, that this display includes both, changes in the dye tracer volume as well as changes in the temperature of the traced water masses.
X - 8 MENGIS ET AL.: ARCTIC OCEAN ALBEDO MODIFICATION
2010 2020 2030 2040 2050 2060 2070 2080 2090 2100 0
1 2 3 4 5
sea ice extent [106 km2 ]
RCP8.5 AOAM RCP8.5
RCP4.5 AOAM RCP4.5
RCP4p5 AOAM t2040 RCP4p5 AOAM t2060 RCP4p5 AOAM t2080 noEmit AOAM
noEmit
Figure S6. Northern Hemisphere annual minimum sea ice extent for the different forcing scenarios, see legend. Same as Figure 2a of the main article, with the addition of three termination experiments in the RCP4.5 AOAM simulation starting in 2040 (RCP4p5 AOAM t2040), 2060 (RCP4p5 AOAM t2060) and 2080 (RCP4p5 AOAM t2080).