Journal of Health Psychology 2014, Vol. 19(7) 858 –868
© The Author(s) 2013 Reprints and permissions:
sagepub.co.uk/journalsPermissions.nav DOI: 10.1177/1359105313481075 hpq.sagepub.com
Introduction
Individual differences in evaluating an activi- ty’s risks and benefits play an important part in adopting healthy lifestyles, in reducing our vul- nerability to accidents and disease, and in ensuring the adherence to medical treatment (Comello and Slater, 2011). These differences are in part heritable traits (Roe et al., 2009) and in part acquired characteristics that may relate to birth order (Adler, 1925). Thus, firstborns would appear to avoid potentially dangerous sports and other dangerous activities (Casher, 1977; Jobe et al., 1983; Longstreth, 1970;
Nisbett, 1968; Nixon, 1981; Rees et al., 2008;
Sulloway and Zweigenhaft, 2010; Yiannakis, 1976) and to be more distrustful in investment games (Courtiol et al., 2009). When compared to laterborns, firstborns would also appear to be less attracted by traveling to distant destinations (Sulloway, 1996) and more reluctant to take financial risks (Gilliam and Chatterjee, 2011).
Despite a growing interest in environmental modulators of risk-taking, the role of birth order remains, however, disputed. On one hand, according to Adlerian theory, birth order imposes environmental constraints through parental expectations or feedback styles and sibling rivalry for parental investment in early childhood (Eckstein et al., 2010). Firstborns are said to be more conscientious, ambitious, academically oriented, conforming, conserva- tive, inclined toward leadership, and respectful of their parents than their laterborn siblings.
Children born later in the birth order would tend
Risk attitudes and birth order
Philipp Krause, Johannes Heindl, Andreas Jung, Berthold Langguth, Göran Hajak and Philipp G Sand
Abstract
Risk attitudes play important roles in health behavior and everyday decision making. It is unclear, however, whether these attitudes can be predicted from birth order. We investigated 200 mostly male volunteers from two distinct settings. After correcting for multiple comparisons, for the number of siblings and for confounding by gender, ordinal position predicted perception of health-related risks among participants in extreme sports (p < .01). However, the direction of the effect contradicted Adlerian theory. Except for alcohol consumption, these findings extended to self-reported risk behavior. Together, the data call for a cautious stand on the impact of birth order on risk attitudes.
Keywords
birth order, extreme sports, personality, risk perception, risk-taking
University of Regensburg, Germany Corresponding author:
Philipp G Sand, Department of Psychiatry and Psychotherapy, University of Regensburg, Universitaetsstrasse 84, 93053 Regensburg, Germany.
Email: philipp.sand@klinik.uni-regensburg.de
Article
to be more unconventional, flexible, and rebel- lious (Sulloway, 1997). On the other hand, crit- ics of the nurture hypothesis of risk-taking have argued that many facets of birth order dynamics remain difficult to control in empirical investi- gations, and methodological concerns have arisen from the failure to correct for sex, educa- tional background, and other confounding vari- ables in the past (Ernst and Angst, 1983).
As has been pointed out, the major challenge in estimating the attitude toward risk lies in the complexity of the trait (Brymer and Schweitzer, 2012; Wang et al., 2009; Willig, 2008). This implies that individuals may be risk-averse in one domain while they may still be willing to take risks in other domains (Hanoch et al., 2006). The present investigation was conceived to address the effect of birth order on five domains of risk perception and on self-reported risk behavior of young adults. To this avail, we examined two samples matched for age and sex that differed with regard to lifestyle and the level of risk exposure. By this approach, we sought to ensure that the measures used for evaluating risk perception were sensitive to the active engagement in everyday risk seeking.
Methods Study populations
Two hundred young adults were investigated between December 2009 and June 2010 in com- pliance with the Helsinki declaration as revised in Seoul 2008. The study protocol was reviewed and approved by the ethics committee at the University of Regensburg.
Sample A (low risk exposure) was com- posed of 100 students between the ages of 18 and 40 years, enrolled at the University of Regensburg. Students were recruited either by direct approach on the medical school campus or by word-of-mouth.
Sample B (high risk exposure) was com- posed of 100 young adults who engaged in extreme sports. Disciplines included free- style skiing, freeride snowboarding, down- hill mountain-biking, freeride kayaking, and
base-jumping. Volunteers were solicited at major competitions in the German, Austrian, Italian, and Swiss Alps and were matched for age and sex to sample A. By international rankings, all qualified as either high-level or top-level performers. Typically, potential participants were approached after register- ing for the event on the day before their respective race or challenge. As there are no official competitions for base-jumping, these participants were approached while preparing for jumps in the valley of Lauterbrunnen, Switzerland, a popular spot in the scene.
Procedure
A full description of the study was given, and each participant was handed an information sheet, which provided details about the nature of the study, what was expected of participants in the study, a guarantee of confidentiality, a reminder of the voluntary nature of his or her decision to participate, and where to obtain information regarding the results of the study when it was completed. All study participants provided written informed consent and received a cash incentive of €20. Participants were then handed an envelope with questionnaires and a key number, so that a buccal swab taken on the same occasion could be identified after ques- tionnaires were returned. Buccal swabs were obtained to test for putative biomarkers of risk- taking behavior and will be addressed else- where. Envelopes containing the filled-in questionnaires were collected by the investiga- tors immediately after completion.
Instrumentaria
Study participants were asked to provide anon- ymous sociodemographic information includ- ing the number of siblings and ordinal position (defined as the rank among all siblings in the index family) and completed the Domain- Specific Risk-Taking–German (DOSPERT-G) risk perception scale (Weber et al., 2002). In this instrument, a response is given to the degree
of risk associated with 40 behaviors (e.g. driv- ing a car without a seatbelt and telling a friend’s secret). Scores gauge an internal measurement of how risky each behavior is to a particular individual, and high scores stand for high esti- mates of risks. We supplemented DOSPERT with a structured form to sample risk-taking behavior in five domains, that is, drinking, drug-taking, risky sexual activity, reckless driving, and gambling, based on the Life Experiences Questionnaire (LEQ, Zuckerman and Kuhlman, 2000). Finally, Adult Attention- Deficit Hyperactivity Disorder Self-Report Scale Version 1.1 (ASRS V1.1) (Murphy and Adler, 2004) was used to screen for the pres- ence of attention-deficit hyperactivity disorder (ADHD), an important confounder in the assessment of risk-taking (Drechsler et al., 2008). Endorsement of four or more of these symptoms at a threshold level constitutes a pos- itive screen and is most predictive of a clinical diagnosis (Kessler et al., 2005).
Modeling of ordinal position effects and statistical analysis
Three models were used to examine ordinal position effects on risk perception and reported risk-taking. Model A tested for differences between firstborns and laterborns, model B tested for differences between middleborns and non-middleborns, and model C tested for differ- ences between lastborns and the remaining ordinal positions. We refrained from examining all possible differences between individual birth order subgroups to avoid trade-offs in sta- tistical power. Firstborns and only children were grouped together on the grounds of well- established similarities (Mellor, 1990). Data were analyzed by analysis of covariance (ANCOVA), correcting for the number of sib- lings and for the effect of gender (Gustafson, 1998). The significance level was set at p = .05.
A Bonferroni correction was applied to account for the number of models tested (pcorr = .05/3 = .016). All calculations were performed with Intercooled STATA V8.0 (Stata Corporation, College Station, TX, USA).
Results
Sample characteristics and summary statistics
Overall, 208 subjects were approached of whom one student and seven participants in extreme sports declined to participate (3.8%).
Characteristics of both samples are given in Table 1. Sample A was composed of 36 first- borns, 7 only children (counted as firstborns), 19 middleborns, and 38 lastborns. The number of siblings ranged from 0 to 7 (mean ± standard error of mean (SEM) = 1.6 ± 0.1) and was sig- nificantly larger in middleborns compared to firstborns and lastborns (p < .001, Table 1). One ASRS form was incomplete and was not counted.
No items were missing from DOSPERT-G forms.
In sample B, we counted 27 firstborns, 6 only children (counted as firstborns), 20 mid- dleborns, and 44 lastborns. Data on ordinal position were missing from three forms. The number of siblings ranged from 0 to 7 (mean ± SEM = 1.6 ± 0.1). All ASRS forms were com- plete but one DOSPERT form was returned blank by a middleborn participant. The respec- tive numbers of firstborns, middleborns, and lastborns included in samples A and B were not predefined and did not differ significantly (p >
.24). In sample B, educational level was not systematically assessed, but nine participants were unemployed.
Birth order effects on risk perception
DOSPERT total scores were distributed nor- mally (sample A: Shapiro–Wilk test: p > .27, median = 115; sample B: Shapiro–Wilk test: p >
.24, median = 109, Figure 1) and were lowest in firstborns (sample A: 114.8 ± 2.6, sample B:
104.9 ± 2.4), followed by middleborns (sample A: 115.5 ± 3.1, sample B: 110.7 ± 2.5), and last- borns (sample A: 118.6 ± 2.6, sample B: 113.1
± 2.5, Figure 1). In sample B, lastborns exhib- ited higher scores than others (p = .02), but the significance disappeared after corrections were applied for multiple testing.
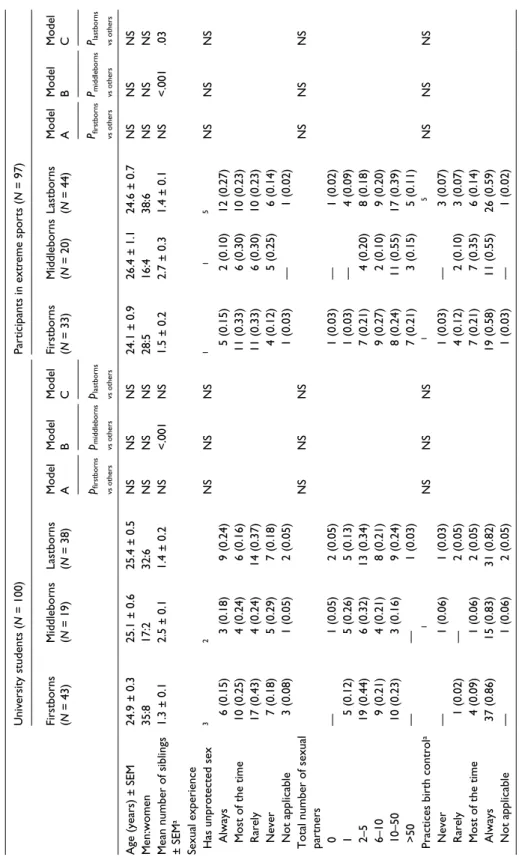
Table 1. Self-reported demographic characteristics, life experiences and ASRS scores of participants by birth order. University students (N = 100)Participants in extreme sports (N = 97) Firstborns (N = 43)Middleborns (N = 19)Lastborns (N = 38)Model AModel BModel CFirstborns (N = 33)Middleborns (N = 20)Lastborns (N = 44)Model AModel BModel C pfirstborns vs otherspmiddleborns vs othersplastborns vs othersPfirstborns vs othersPmiddleborns vs othersPlastborns vs others Age (years) ± SEM24.9 ± 0.325.1 ± 0.625.4 ± 0.5NSNSNS24.1 ± 0.926.4 ± 1.124.6 ± 0.7NSNSNS Men:women35:817:232:6NSNSNS28:516:438:6NSNSNS Mean number of siblings ± SEMa1.3 ± 0.12.5 ± 0.11.4 ± 0.2NS<.001NS1.5 ± 0.22.7 ± 0.31.4 ± 0.1NS<.001.03 Sexual experience Has unprotected sex32NSNSNS115NSNSNS Always6 (0.15)3 (0.18)9 (0.24)5 (0.15)2 (0.10)12 (0.27) Most of the time10 (0.25)4 (0.24)6 (0.16)11 (0.33)6 (0.30)10 (0.23) Rarely17 (0.43)4 (0.24)14 (0.37)11 (0.33)6 (0.30)10 (0.23) Never7 (0.18)5 (0.29)7 (0.18)4 (0.12)5 (0.25)6 (0.14) Not applicable3 (0.08)1 (0.05)2 (0.05)1 (0.03)—1 (0.02) Total number of sexual partnersNSNSNSNSNSNS 0—1 (0.05)2 (0.05)1 (0.03)—1 (0.02) 15 (0.12)5 (0.26)5 (0.13)1 (0.03)—4 (0.09) 2–519 (0.44)6 (0.32)13 (0.34)7 (0.21)4 (0.20)8 (0.18) 6–109 (0.21)4 (0.21)8 (0.21)9 (0.27)2 (0.10)9 (0.20) 10–5010 (0.23)3 (0.16)9 (0.24)8 (0.24)11 (0.55)17 (0.39) >50——1 (0.03)7 (0.21)3 (0.15)5 (0.11) Practices birth controla1NSNSNS15NSNSNS Never—1 (0.06)1 (0.03)1 (0.03)—3 (0.07) Rarely1 (0.02)—2 (0.05)4 (0.12)2 (0.10)3 (0.07) Most of the time4 (0.09)1 (0.06)2 (0.05)7 (0.21)7 (0.35)6 (0.14) Always37 (0.86)15 (0.83)31 (0.82)19 (0.58)11 (0.55)26 (0.59) Not applicable—1 (0.06)2 (0.05)1 (0.03)—1 (0.02)
University students (N = 100)Participants in extreme sports (N = 97) Firstborns (N = 43)Middleborns (N = 19)Lastborns (N = 38)Model AModel BModel CFirstborns (N = 33)Middleborns (N = 20)Lastborns (N = 44)Model AModel BModel C pfirstborns vs otherspmiddleborns vs othersplastborns vs othersPfirstborns vs othersPmiddleborns vs othersPlastborns vs others Drug experience Frequency of marijuana use in past yeara
1NSNSNS1NSNSNS Never23 (0.53)11 (0.58)21 (0.57)12 (0.36)6 (0.30)18 (0.41) Up to once per year13 (0.30)4 (0.21)9 (0.24)8 (0.24)4 (0.20)7 (0.16) Monthly3 (0.07)2 (0.11)5 (0.14)9 (0.27)4 (0.20)8 (0.18) Weekly3 (0.07)2 (0.11)2 (0.05)3 (0.09)2 (0.10)4 (0.09) Daily1 (0.02)——1 (0.03)3 (0.15)7 (0.16) Frequency of other drug use in past yearaNSNSNSNSNSNS Never38 (0.88)17 (0.89)33 (0.87)24 (0.72)11 (0.55)32 (0.72) Up to once per year5 (0.12)1 (0.05)3 (0.08)6 (0.18)7 (0.35)10 (0.23) Monthly—1 (0.05)2 (0.05)3 (0.09)2 (0.10)— Weekly—————1 (0.02) Daily—————1 (0.02) Total number of illegal drugs triedaNSNSNS1NSNSNS None14 (0.33)8 (0.42)14 (0.37)7 (0.21)4 (0.20)9 (0.20) 120 (0.47)9 (0.47)18 (0.47)12 (0.36)6 (0.30)18 (0.41) 2–39 (0.21)1 (0.05)2 (0.05)12 (0.36)6 (0.30)12 (0.27) More than 3—1 (0.05)4 (0.11)2 (0.06)4 (0.20)4 (0.09) Gambling experience Has gambled for money31 (0.72)17 (0.89)29 (0.76)1NS.03NS22 (0.67)16 (0.80)33 (0.75)NSNSNS Largest amount lost/day (€ mean ± SEM)a54.8 ± 22.019.4 ± 3.643.7 ± 20.0NSNSNS114.3 ± 41.946.7 ± 19.181.8 ± 30.2NSNSNS Largest amount won/ day (€ mean ± SEM)a132.5 ± 37.141.9 ± 8.7186.3 ± 97.8NSNSNS336.4 ± 172.972.3 ± 28.4474.8 ± 225.3NSNSNS (Continued)
Table 1. (Continued)
University students (N = 100)Participants in extreme sports (N = 97) Firstborns (N = 43)Middleborns (N = 19)Lastborns (N = 38)Model AModel BModel CFirstborns (N = 33)Middleborns (N = 20)Lastborns (N = 44)Model AModel BModel C pfirstborns vs otherspmiddleborns vs othersplastborns vs othersPfirstborns vs othersPmiddleborns vs othersPlastborns vs others Driving experience Has had driving license revoked or suspendeda2 (0.05)—3 (0.08)NSNSNS3 (0.09)5 (0.25)7 (0.16)NSNSNS Not applicable2 (0.05)—3 (0.08)——— Uses cell phone while driving32 (0.78)212 (0.63)24 (0.63)NSNSNS28 (0.85)117 (0.85)37 (0.84)1NSNSNS When approaching a yellow traffic light.04NS.0111NSNSNS Tends to slow down5 (0.12)4 (0.21)12 (0.32)8 (0.24)5 (0.25)13 (0.30) Tends to maintain speed7 (0.16)4 (0.21)9 (0.24)5 (0.15)3 (0.15)10 (0.23) Tends to accelerate31 (0.72)11 (0.58)17 (0.45)19 (0.58)12 (0.60)20 (0.45) Drinking experience Drives after having had two or more drinksaNSNSNS11NSNSNS Always2 (0.05)1 (0.05)—8 (0.24)2 (0.10)6 (0.14) Rarely18 (0.42)10 (0.53)23 (0.61)14 (0.42)13 (0.65)30 (0.68) Never23 (0.53)8 (0.42)15 (0.39)10 (0.30)5 (0.25)7 (0.16) Age at first intoxication by alcoholNSNSNSNSNSNS Before 14 years6 (0.14)—5 (0.13)7 (0.21)6 (0.30)9 (0.20) 14–16 years20 (0.47)13 (0.68)17 (0.45)13 (0.39)6 (0.30)23 (0.52) After 16 years15 (0.35)4 (0.21)15 (0.39)10 (0.30)6 (0.30)10 (0.23) Not applicable2 (0.05)2 (0.11)1 (0.03)3 (0.09)2 (0.10)2 (0.05)
Table 1. (Continued)
University students (N = 100)Participants in extreme sports (N = 97) Firstborns (N = 43)Middleborns (N = 19)Lastborns (N = 38)Model AModel BModel CFirstborns (N = 33)Middleborns (N = 20)Lastborns (N = 44)Model AModel BModel C pfirstborns vs otherspmiddleborns vs othersplastborns vs othersPfirstborns vs othersPmiddleborns vs othersPlastborns vs others Maximum number of drinks/day in past year
21NSNSNS11.01.01.006 02 (0.05)——2 (0.06)1 (0.05)1 (0.02) 1–57 (0.17)5 (0.26)8 (0.22)5 (0.15)6 (0.30)6 (0.14) 6–1022 (0.54)6 (0.32)17 (0.46)13 (0.39)6 (0.30)12 (0.27) 11–208 (0.20)7 (0.37)10 (0.27)8 (0.24)3 (0.15)18 (0.41) >202 (0.05)1 (0.05)2 (0.05)4 (0.12)4 (0.20)6 (0.13) ASRS score >35 (0.12)11 (0.05)8 (0.21)NSNSNS12 (0.36)8 (0.42)11 (0.25)NSNSNS Social backgroundNSNSNS2NSNSNS Unemployed———3 (0.09)2 (0.11)4 (0.09) ASRS: Adult Attention-Deficit Hyperactivity Disorder Self-Report Scale; ANCOVA: analysis of covariance; SEM: standard error of mean. P values are uncorrected and refer to ANCOVA results controlling for the number of siblings and for gender. aThe Shapiro–Wilk test indicated that these items may have deviated from normality (p < .01) (numerical superscripts denote the number of missing values).
Table 1. (Continued)
Figure 1. Distributions of DOSPERT total scores by ordinal position for university students (sample A: N = 100, median = 115) and for participants in extreme sports (sample B: N = 96, median = 109). The nominally significant difference between lastborns and other ordinal positions (p = .02, model C) in sample B disappeared after corrections for multiple testing. No other significant effects were observed for model A, B, or C.
DOSPERT: Domain-Specific Risk-Taking.
In the student sample, we noted a lower per- ception of risks associated with ethical deci- sions in firstborns relative to others (uncorrected p = .03, Table 2). Again, this p value became insignificant after Bonferroni correction. As for the remaining DOSPERT subscales, no major effects were noted (Table 2). Among partici- pants in extreme sports, firstborns scored low- est on the perception of health/safety risks (uncorrected p = .0033), and lastborns scored highest on the perception of social risks (uncor- rected p = .02). Participants without siblings achieved results similar to those of firstborns (DOSPERT total score for sample A: 114.4 ± 2.8, sample B: 105.6 ± 2.6). Pooling of only children with firstborns did not result in any noteworthy changes in either sample.
Birth order effects on risk-taking
Self-reported risk-taking was analyzed by ANCOVA, correcting for the number of sib- lings and gender (Table 1). With the exception of a significant effect of birth order on gam- bling for money in model B (uncorrected p = .04) and on driving behavior (approach to yel- low traffic lights) in models A (uncorrected p = .04) and model C (uncorrected p = .01), no other effects emerged in sample A. For the lat- ter item, lastborns reported the more cautious approach, that is, a tendency to slow down, whereas firstborns tended to accelerate more often. Assessments of additional items, for example, the use of mobile phones while driv- ing and a history of driving license revocation/
suspension were unremarkable. Similarly, birth
order had no significant impact on the number of sexual partners, the frequency of practicing unprotected sex, or on birth control. This also held true for experiences with drinking and experiences with drug-taking (Table 1).
Lastborn members of sample B reported a signifi- cant excess in the maximum number of alcoholic drinks consumed per day (uncorrected p = .006).
By ASRS scores, 14 subjects (14%) from sam- ple A and 31 subjects (31%) from sample B fulfilled the criteria for probable ADHD, but there was no evidence of an increased likeli- hood of ADHD in subjects belonging to any of the three ordinal positions under investigation.
Discussion
The aim of the present investigation was to quantitatively assess birth order effects on risk perception and actual risk-taking in two inde- pendent settings. Based on a validated measure of risk perception, and on self-reports of life experiences in multiple domains, we cannot confirm the notion of risk-averse firstborns and risk-prone lastborns. Instead, firstborns appeared less risk-aware by DOSPERT scores and mostly less risk-averse by accounts of their own experi- ence, when compared to laterborn subjects.
Perception of health-related risks was the only parameter to exhibit significant effects of ordi- nal position that survived corrections for mul- tiple testing. The direction of this effect was, however, opposite to the direction expected according to Adlerian theory.
While this is not the first investigation to challenge the concept of risk-loving lastborns (Cook and Bellis, 2001), only one prior study has used an operationalized approach to describe the relationship between risk percep- tion and birth order (Morgan, 2009). Results from the earlier study compare to our findings in that oldest siblings tended to perceive fewer risks than did laterborns. In the present study, the sampling of fewer firstborns and more last- borns in sample B did not exceed the numbers expected by chance. Information obtained on past exposure to risky situations corroborates behavioral implications of risk perception
and replicates recent data from a large survey (Dohmen et al., 2009): specifically, the differ- ences observed in risk perception mirror the level of engagement in everyday risk seeking activities of samples A and B. This implies that risk perception can serve as a predictor of high risk lifestyles.
Differences in educational level and social background inequalities may offer an explana- tion for differential effects of birth order on risk perception and behavior in the two samples under study (Lee et al., 2008). Higher levels of alcohol consumption and unemployment tended to cluster in sample B. There is consen- sus regarding an inverse correlation of ordinal position and educational achievement in young adults (Fergusson et al., 2006; Gorman, 2008).
Unfortunately, as we did not systematically record educational degrees and income levels, the relative weight of these factors remains dif- ficult to assess in retrospect.
With regard to individual domains of risk perception, others have concluded to a lack of ordinal position effects on financial risk toler- ance (Eckel and Grossman, 2008; Grable and Joo, 1999, 2000) or have been unable to con- firm a role of birth order in predicting recrea- tional risk-taking (Seff and Gecas, 1993; Sohi and Yusuff, 1991). Unless further factors such as the spacing or the gender of siblings (Elliott, 1992) impact strongly on the dependent varia- ble, our observations indicate that birth order is not positively correlated with risk perception.
Assuming that behavioral differences between siblings are genuine, independent traits, for example, competitiveness, may come into play (Carette et al., 2011). We acknowledge that the majority of participants in the present investiga- tion were men, and extrapolations to women are more tentative at this stage.
On the whole, our data advocate a cautious stand on the role of birth order in shaping risk perception or risk-taking behavior. In young men, the chances of observing an increase in risk perception with ordinal position are higher than the chances of observing a decrease. Part of the effect may be due to educational and social background. These issues will need to be
addressed in future studies with a balanced gen- der design and, preferably, using additional age groups.
Acknowledgements
The authors gratefully acknowledge Marvin Zuckerman for kindly providing the original version of the Life Experiences Questionnaire.
Funding
This research received no specific grant from any funding agency in the public, commercial, or not-for- profit sectors.
References
Adler A (1925) The Practice and Theory of Individ- ual Psychology. London: Routledge
Brymer E and Schweitzer R (2012) Extreme sports are good for your health: A phenomenological under- standing of fear and anxiety in extreme sport. Jour- nal of Health Psychology. Epub ahead of print 11 June 2012. DOI: 10.1177/1359105312446770.
Carette B, Anseel F and Van Yperen NW (2011) Born to learn or born to win? Birth order effects on achievement goals. Journal of Research in Personality 45: 500–503.
Casher BB (1977) Relationship between birth order and participation in dangerous sports. Research Quarterly 48: 33–40.
Comello MLG and Slater MD (2011) Effects of adverts from a drug and alcohol prevention campaign on willingness to engage in alcohol-related risky behav- iors. Journal of Health Psychology 16: 1268–1276.
Cook PA and Bellis MA (2001) Knowing the risk:
Relationships between risk behaviour and health knowledge. Public Health 115: 54–61.
Courtiol A, Raymond M and Faurie C (2009) Birth order affects behaviour in the investment game:
Firstborns are less trustful and reciprocate less.
Animal Behaviour 78: 1405–1411.
Dohmen T, Falk A, Huffman D, et al. (2009) Indi- vidual risk attitudes: Measurement, determinants and behavioral consequences. Journal of the European Economic Association 5517: 522–550.
Drechsler R, Rizzo P and Steinhausen HC (2008) Decision-making on an explicit risk-taking task in preadolescents with attention-deficit/hyperactiv- ity disorder. Journal of Neural Transmission 115:
201–209.
Eckel CC and Grossman PJ (2008) Forecasting risk attitudes: An experimental study using actual and forecast gamble choices. Journal of Economic Behavior & Organization 68: 1–17.
Table 2. Differences in risk perception by birth order (ANCOVA controlling for gender and the number of siblings).
DOSPERT Risk perception scale (items) Model A Model B Model C
University students (N = 100)
Firstborns
(N = 43) Middleborns
(N = 19) Lastborns
(N = 38) pfirstborns vs others
pmiddleborns vs others
plastborns vs others
Ethical decisions (8) 24.6 ± 0.8 26.5 ± 1.0 26.8 ± 0.7 .03 NS NS
Financial decisions (8) 24.4 ± 1.0 24.1 ± 1.3 25.9 ± 0.9 NS NS NS Health/safety decisions (8) 26.0 ± 0.7 25.6 ± 1.0 26.2 ± 0.7 NS NS NS Recreational decisions (8) 23.4 ± 0.8 23.5 ± 1.2 23.3 ± 0.8 NS NS NS
Social decisions (8) 16.3 ± 0.6 15.9 ± 0.6 16.4 ± 0.5 NS NS NS
Participants in extreme sports (N = 96) Firstborns
(N = 33) Middleborns
(N = 19) Lastborns
(N = 44) pfirstborns vs others
pmiddleborns vs others
plastborns vs others
Ethical decisions (8) 22.6 ± 0.7 23.7 ± 1.5 24.5 ± 0.8 NS NS NS
Financial decisions (8) 24.4 ± 1.0 24.3 ± 2.0 26.4 ± 0.8 NS NS NS Health/safety decisions (8) 22.2 ± 0.9 25.7 ± 1.1 24.3 ± 0.7 .003 .02 .01 Recreational decisions (8) 19.6 ± 0.9 19.6 ± 1.1 20.2 ± 0.7 NS NS NS
Social decisions (8) 16.1 ± 0.7 17.3 ± 1.0 17.7 ± 0.7 NS .05 .02
ANCOVA: analysis of covariance; DOSPERT: Domain-Specific Risk-Taking.
DOSPERT scores are given as mean ± standard error of mean (SEM).
Eckstein D, Aycock KJ, Sperber MA, et al. (2010) A review of 200 birth order studies: Lifestyle char- acteristics. Journal of Individual Psychology 66:
408–434.
Elliott BA (1992) Birth order and health: Major issues. Social Science & Medicine 35: 443–452.
Ernst C and Angst J (1983) Birth Order: Its Influence on Personality. Berlin: Springer.
Fergusson DM, Horwood LJ and Boden JM (2006) Birth order and educational achievement in ado- lescence and young adulthood. Australian Jour- nal of Education 50: 122–139.
Gilliam J and Chatterjee S (2011) The influence of birth order on financial risk tolerance. Journal of Business & Economics Research 4: 43–50.
Gorman SK (2008) Correlational study of birth order with educational attainment and transformational leadership. PhD Thesis, University of Phoenix, Phoenix AZ.
Grable JE and Joo S (1999) Factors related to risk tolerance: A further examination. Consumer Interests Annual 45: 53–58.
Grable JE and Joo S (2000) A cross-disciplinary examination of financial risk tolerance. Con- sumer Interests Annual 46: 151–157.
Gustafson PE (1998) Gender differences in risk per- ception: Theoretical and methodological per- spectives. Risk Analysis 18: 805–811.
Hanoch Y, Johnson JG and Wilke A (2006) Domain- specificity in experimental measures and partici- pant recruitment: An application to risk-taking behavior. Psychological Science 17: 300–304.
Jobe JB, Holgate SH and Scrapansky TA (1983) Risk taking as motivation for volunteering for a hazard- ous experiment. Journal of Personality 51: 95–107.
Kessler RC, Adler L, Ames M, et al. (2005) The World Health Organization Adult ADHD Self- Report Scale (ASRS): A short screening scale for use in the general population. Psychological Medicine 35: 245–256.
Lee JEC, Lemyre L, Turner MC, et al. (2008) Health risk perceptions as mediators of socioeconomic differentials in health behaviour. Journal of Health Psychology 13: 1082–1091.
Longstreth L (1970) Birth order and avoidance of dan- gerous activities. Developmental Psychology 2: 154.
Mellor S (1990) How do only children differ from other children? The Journal of Genetic Psychology 151: 221–230.
Morgan E (2009) The heir and the spare: Impact of birth order on risk attitudes, discount rates, and behaviors. PhD Thesis, Moore School of Busi- ness, University of South Carolina, Columbia, SC.
Murphy KR and Adler LA (2004) Assessing atten- tion-deficit/hyperactivity disorder in adults:
Focus on rating scales. Journal of Clinical Psy- chiatry 65(Suppl. 3): 12–17.
Nisbett RE (1968) Birth order and participation in dangerous sports. Journal of Personality and Social Psychology 8: 351–353.
Nixon HL (1981) Birth order and preferences for risky sports among college students. Journal of Sport Behavior 4: 12–23.
Rees DL, Lopez E, Averett SL, et al. (2008) Birth order and participation in school sports and other extracurricular activities. Economics of Educa- tion Review 27: 354–362.
Roe BE, Tilley MR, Gu HH, et al. (2009) Financial and psychological risk attitudes associated with two single nucleotide polymorphisms in the nic- otine receptor (CHRNA4) gene. Public Library of Science One 4: e6704.
Seff MA and Gecas V (1993) Birth order, self- concept, and participation in dangerous sports.
Journal of Psychology 127: 221–232.
Sohi AS and Yusuff KB (1991) Birth-order and par- ticipation in high and low dangerous sports among selected Nigerian elite athletes. Journal of Asian and African Studies 26: 276–283.
Sulloway FJ (1996) Born to Rebel: Birth Order, Family Dynamics, and Creative Lives. New York: Pantheon.
Sulloway FJ (1997) Birth order and personality. Har- vard Mental Health Letter 14: 5–7.
Sulloway FJ and Zweigenhaft RL (2010) Birth order and risk taking in athletics: A meta-analysis and study of major league baseball. Personality and Social Psychology Review 14: 402–416.
Wang XT, Kruger DJ and Wilke A (2009) Life his- tory variables and risk-taking propensity. Evolu- tion and Human Behavior 30: 77–84.
Weber EU, Blais A-R and Betz NE (2002) A domain-specific risk-attitude scale: Mea- suring risk perceptions and risk behaviors.
Journal of Behavioral Decision Making 15:
263–290.
Willig C (2008) A phenomenological investigation of the experience of taking part in “extreme sports”. Journal of Health Psychology 13:
690–702.
Yiannakis A (1976) Birth order and preference for dangerous sports among males. Research Quar- terly 47: 62–67.
Zuckerman M and Kuhlman DM (2000) Personality and risk-taking: Common biosocial factors.
Journal of Personality 68: 999–1029.