Hertie School of Governance - working papers, No. 32, May 2008
Partisanship, Social Capital, and Fiscal Federalism in the Italian Regions
Mark Hallerberg (Hertie School of Governance and Emory University) Francesco Stolfi (University College Dublin)
Hertie School of Governance – working papers, No. 32, May 2008
Partisanship, Social Capital, and Fiscal Federalism in the Italian Regions
Mark Hallerberg (Hertie School of Governance and Emory University) and Francesco Stolfi (University College Dublin)
About the HSoG Working Paper Series
The Working Paper Series of the Hertie School of Governance is intended to provide
visibility, internally as well as externally, to the current academic work of core faculty, other teaching staff, and invited visitors to the School. High-quality student papers will also be published in the Series, together with a foreword by the respective instructor or supervisor.
Authors are exclusively responsible for the content of their papers and the views expressed therein. They retain the copyright for their work. Discussion and comments are invited.
Working Papers will be made electronically available through the Hertie School of Governance homepage. Contents will be deleted from the homepage when papers are eventually published; once this happens, only name(s) of author(s), title, and place of
publication will remain on the list. If the material is being published in a language other than German or English, both the original text and the reference to the publication will be kept on the list.
Partisanship, Social Capital, and Fiscal Federalism in the Italian Regions
Mark Hallerberg * and Francesco Stolfi **
This Draft: May 9, 2008
Abstract
In this paper we analyze the determinants of fiscal performance in the regions of Italy, a country that has taken significant steps towards federalism in the past ten years. We test several hypotheses on the impact of financial autonomy, the electoral cycle, partisanship and social capital on the fiscal performance of sub-national units.
We also assess the determinants of transfers from the central government to the regions. We find that lobbying on the part of regional governments increases the amounts of transfers received, as does sharing the same partisan composition as the central government, in particular in proximity of regional elections.
KEYWORDS: Fiscal federalism, Italy, Lobbying, Social Capital
We would like to thank participants at the 2008 European Consortium for Political Research Conference in Rennes, France, for their comments on an earlier version of this paper.
* Hertie School of Governance and Emory University.
E-mail: hallerberg@hertie-school.org
** University College Dublin.
E-mail: fstolfi@ucd.ie
In the past ten years, there has been renewed interest in fiscal federalism among political scientists. The literature focuses on the fiscal consequences at the sub-national level after national governments decentralize expenditure and taxation powers. This concern has at least in part been driven by an apparent disconnect between theory and practice. On the one hand, influential theoretical arguments have made a case for federalism as a stimulant of economic efficiency (e.g., Weingast 1995, Inman and Rubinfield 1997); on the other hand, federal institutional arrangements seem to have led to sub-par economic and fiscal outcomes. This has especially been evident in developing countries, with the Argentine experience leading to cautionary tales about the “dark side of federalism,” (to quote the title of Saiegh and Tommasi’s (2000) paper). There is increasing consensus that the institutional form that such a decentralization takes affects whether the decentralization leads to good or bad fiscal consequences (Wibbels 2006). Rodden (2003) find that when regions rely on own-source taxation, regional spending tends to go down, while regional spending increases when regions do not rely on their own revenue to finance their expenditures. Similarly, high transfers from the national to the sub-national level also lead to bad outcomes--Rodden and Wibbels (2002) find that the more a given region relies on national transfers, the more it spends.
In this paper, we examine fiscal federalism in Italy. The country was highly centralized until the mid-1990s, when it started to develop many federal features. It is an especially good case for a study of incipient fiscal federalism for several reasons. First, its twenty regions provide significant variation in one of the key institutional determinants of regional spending, namely vertical imbalance, or the extent to which regional expenditure is funded by transfers from the central government rather than taxes raised by the regional government. In 2004, for instance, the ratio between own taxes and total regional revenues varied between 14% (Sardinia) and 88% (Lombardy). Second, there remains an interesting game that is playing between the national and regional levels on the level of transfers.
Following on the insights from Rodden and Wibbels (2002), we model why some regions receive larger transfers than others. Third, Italy provides a case to examine the possible impact of political culture. The Italian regions were the focus of Putnam’s (1993) influential study on social capital. In this paper we use one of Putnam’s original measures to test whether regional fiscal performance is affected by their relative level of social capital.
The paper is structured as follows. The next section describes the federalization of the Italian polity over the last decade. Section three introduces a set of hypotheses for the Italian case. Section four presents the empirical analysis. We present an original dataset that brings
together economic, institutional, political and social capital variables. The dataset covers the twenty Italian regions between 1999, the time by which many of the federal features were in place, and 2004, the last year for which ISTAT, the national statistical office, made regional fiscal data available to the public. We find evidence of real inertia in spending patterns, with no political or economic variables in our model, including vertical imbalance, explaining the spending side of the budget. In terms of debt as well as transfers of funds from the national to the regional level, however, there are some notable political effects. When governments at the regional level have the same parties in government as at the national level, they have higher debt burdens. There are also clear electoral cycles--when there are elections, partisans on both sides of the political divide reduce debt. A similar dynamic exists for transfers--governments from the parties in power receive more transfers than opposition-controlled regions in electoral years. Section five concludes.
Italy’s Regions: A Primer
Italy is composed of twenty regions.1 The political unification of the country, only completed after the First World War, has not erased major economic and cultural differences among across them. The biggest divide is undoubtedly an economic one between north and south.
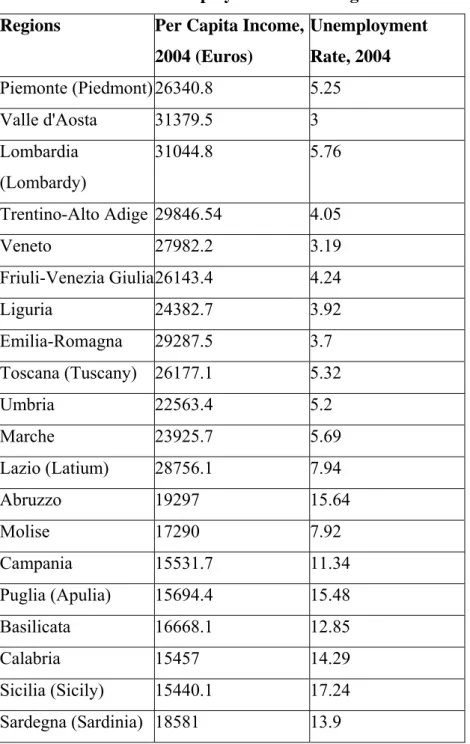
Table 1 reports regional differences in terms of per capita income and unemployment rate.
The per capita income of the richer part of the country (center-north – Piedmont through Latium) is about 60% higher than that of the poorer regions, with a peak difference between the richest and the poorest region of about 100%. In terms of interregional income inequality Italy is slightly above the West European average, and is just below Austria and above Belgium (European Commission, 1999, p. 201).2
1 Five regions are technically “autonomous”--Valle d’Aosta, Trentino-Alto Adige, Friuli- Venezia Giulia, Sicily and Sardinia. They have special prerogatives and powers because they qualify as border regions with significant linguistic minorities or because they are islands.
They vary from region to region and reflect considerations of political opportunity and – in the case of Trentino-Alto Adige – international treaties (Macciotta, 2006). In the analysis that follows, we include dummy variables in all specifications for autonomous regions in
unreported results, but the variable never approaches statistical significance.
2 Setting the average GDP per capita in the “old “European Union member states (EU-15) at 100, in 1996 the regional standard deviation in GDP per capita in the EU-15 was 26.9. In Italy it was 27.2, which put it between Belgium (26.0) and Austria (28.6) (European Commission, 1999, p. 201)
Table 1: Income and Unemployment across Regions Regions Per Capita Income,
2004 (Euros)
Unemployment Rate, 2004 Piemonte (Piedmont)26340.8 5.25
Valle d'Aosta 31379.5 3
Lombardia (Lombardy)
31044.8 5.76
Trentino-Alto Adige 29846.54 4.05
Veneto 27982.2 3.19
Friuli-Venezia Giulia26143.4 4.24
Liguria 24382.7 3.92
Emilia-Romagna 29287.5 3.7
Toscana (Tuscany) 26177.1 5.32
Umbria 22563.4 5.2
Marche 23925.7 5.69
Lazio (Latium) 28756.1 7.94
Abruzzo 19297 15.64
Molise 17290 7.92
Campania 15531.7 11.34
Puglia (Apulia) 15694.4 15.48
Basilicata 16668.1 12.85
Calabria 15457 14.29
Sicilia (Sicily) 15440.1 17.24 Sardegna (Sardinia) 18581 13.9
Sources: Income : ISTAT. Various years. Conti economici regionali. ISTAT: Rome Unemployment rate: ISTAT. 2007. Health for All. ISTAT: Rome
In political terms, although the 1948 democratic constitution provided for the creation of regions, ordinary statute regions (namely all aside from the five special statute regions mentioned above) were only established in 1970. The primary reason for the delay was the fear among those in national government that the Italian Communist Party (Dente, 2007) would dominate several regional governments. Even after their creation, until the mid-1990s their decision-making role was marginal and their financial autonomy was minimal. Although
the central government gave the regions important policy areas to manage (in particular the provision of health services), the areas where they had legislative power were very limited:
the central government had competence on all policy areas aside from a well-circumscribed list assigned to the regions and covering issues such as inland navigation, hunting, agriculture and forestry, and mining. Fiscally, the regions almost entirely depended on (mostly earmarked) transfers from the central government (Hine, 1993). David Hine could describe the pre-reform position of the regions as follows (Hine, 1993, p. 269):
The affairs of regional government have thus tended to divide into two categories – a modest sector of real regional responsibility, and a much larger sector in which grandiose regional budgets and policy plans are a fiction, because spending is determined by, and ultimately covered by, national taxpayers.
In sum, the regional system of government was modelled on the national one. The government was “parliamentary,” in that voters would vote for the regional assembly, which then elected the regional government. Just as in the national electoral system, the regional electoral system was based on an extremely proportional electoral formula. This system meant that the regions replicated the features of the national government: fragmented party systems, weak executives and little connection between the voters’ choices and government formation, since government coalitions were agreed by the parties after the elections. By the late 1980s, however, pressure from political movements advocating greater regional autonomy if not outright secession began to mount (Dente, 2007), and this affected the political, fiscal, administrative and eventually constitutional position of the regions.
The Federalization of Italy
Before explaining the particular features of Italian federalism, it is important to establish what
“federalism” is. Federalism is notoriously hard to define, not least because in reality it is a continuum on which countries can be placed rather than a binary (federalism v. centralized government) concept (Rodden, 2004, p. 190). However, some distinctive features can be identified that are present to some degree in most federations. First, a federation has a constitutional order in which the subnational units (the regions) are not subordinated to the national government (Elazar, 1997, p. 1997) – namely they have “some activities on which [they make] final decisions” (Riker, 1975, p. 101) – and a system of judicial review that
defends the prerogatives of the regions (Riker, 1975, p. 145; Rodden, 2004, p. 189-190).
Second, a federation has locally elected legislatures and political representation of the regions at the national level (Rodden, 2004, pp. 190-191; Wibbels, 2006, p. 172).
Both these elements have fiscal implications, since locally elected politicians will have priorities that do not necessarily coincide with national ones. At heart, this is due to the disconnect between spending decisions made locally based on the accountability of local politicians to regional voters, and funding decisions made nationally (Wibbels, 2005, p. 63- 64). This gap will be more significant as the scope of constitutionally-sanctioned and judicially-protected regional activities increases, and as regional politicians have greater ability to influence the decision-making process at the national level (Wibbels, 2006, p. 173).
Moreover, the more local politicians are independent of the national party system – as it often happens in federal states (Riker, 1975, p. 133-134) – the more difficult will it be for central decision-makers to discipline regional ones (Wibbels, 2005, p. 8).
In fiscal terms, fiscal arrangements that give regions a degree of autonomy from the central governments are often integral elements of the way federal governments actually operate (Rodden, 2004). In particular, in many federations regions have access to unconditional national-apportioned grants, which maximizes the ability of local decision- makers to diverge from the goals set at the national level (Gramlich, 1977). Furthermore, the degree of fiscal decentralization is increased by the use of transparent revenue-sharing mechanisms (Garman et al., 2001, p. 207). First, these mechanisms tend to provide unconditional grants (Oates, 1999, p. 1128); second, where the rules for the distribution of grants from the central government to the regions are institutionalized, the dependence of regional policy-makers on the central government is reduced, as this makes it more difficult for the latter to withhold or re-direct funds across regions or to different uses (Garman et al., 2001, p. 219; Wibbels, 2005, 42-43). Finally, in some federal systems regions have a measure of fiscal autonomy proper, namely a measure of control over tax rates and tax bases:
this gives regional politicians some leeway to decide how much to tax, and indeed who to tax, so that they can be held politically responsible by local voters for how they use locally raised taxes (Rodden, 2002; Rodden & Wibbels, 2002).
In all these areas, Italy has taken significant steps towards federalism, though we contend that the move has not been complete. In political terms, since 2000 the presidents of the regional governments have been directly elected, giving them greater democratic
legitimacy and greater autonomy from the national party organizations. The details of the regional electoral system strengthened the hand of the regional leaders. Law 43/1995 mandated the creation of pre-electoral coalitions and introduced a seat premium for the winning coalition. Constitutional law 1/1999 mandated that the presidents of the regions are directly elected and the electoral coalition supporting them receives 60% of the seats in the regional assembly. This has increased the cohesiveness of the regional executives and given the regional president new political relief in the voters’ eyes (the presidents are now popularly known as “governors,” following the terminology used in the United States). At the same time, like in many established federations, voters tend to hold the national and not the regional governments responsible to general economic conditions (Gelineau & Remmer, 2005). Thus, in the last years of the center-left government coalition (1996-2001), the national malaise about the perceived economic costs of the Euro meant that regional elections went to the center-right; similarly, the widespread disappointment with the Berlusconi center-right government (2001-2006) translated into a significant shift of regional governments from the center-right to the center-left.
As for the broad institutional relations between center and periphery, from the late 1990s on the institutional “table” bringing together the central and regional governments has broadened its jurisdiction, thus considerably strengthening the institutional representation of the regions. In 2001, a constitutional reform recognized the regions as the constituent units of the polity and given them a large sphere of autonomy from the national government.3 Fitting another institutional feature of federalism, over time the Constitutional Court has been called more and more frequently to adjudicate jurisdictional disputes between the regional and national governments, thus acting as a guarantor of the stability of the power distribution between different levels of government.
3 According to the 2001 constitutional revision, the regions, alongside municipalities,
provinces and metropolitan areas, constitute the fundamental political units of the country on a par with the central government. Only the regions and the central government, however, have legislative authority. The constitutional changes of 2001 have also given the regions autonomous legislative authority on all policy areas that the constitution does not explicitly assign to the central government – such as defense, international relations, and social security – or defines as the shared competence of the regions and the central government – such as relations with the European Union, education, and health. Even in the policy areas where the regional governments share competence with the central government, however, the latter can only define the general legal framework, leaving it to the regions to legislate in more detail.
In the fiscal area, during the 1990s the funding system of the twenty regions changed significantly: transfers from the central governments were transformed from earmarked to block grants, while the regions achieved a measure of control over regional tax rates and tax bases. The details of the change in funding are important. In the period 1992-95 the regions simply increased the share of non-earmarked funds at their disposal as they were given direct control of the funds generated by certain taxes raised on their territory (ISAE, 2003, p. 22).
Crucially, however, these were still central government taxes, and thus these reforms did not yet give regions the ability to set tax rates or define their tax base.
In 1997 regional financial autonomy made a qualitative break from the past. Since that year regions have been given a measure of control over the tax rate through their control of a regional tax on productive activities -the rate can vary between 3.5% and 5.5% and is applied to the valued added produced in the region (Ministero Del Tesoro, del Bilancio e della Programmazione Economica, 1997, 72). Regions can also impose an additional rate of between 0.5% to 1% on national income tax. The breadth of the tax base to which these taxes are applied means that they have the potential to generate significant revenue, and, as Table 1 indicates, some regions moved to a reliance on these tax forms of up to 80% of total revenue.
The close of the 1990s (law 113/99 and legislative decree 50/2000) also saw a change in the approach to transfers from the center to the regions, from a majority of ear-marked grants to a majority of general grants (Bordignon & Emiliani, 2001).
Also on the fiscal side, in 2000 a mechanism was set up for the distribution of fiscal resources among the regions based on a German-style solidaristic federalism (law 113/99 and legislative decree 56/2000). Regional resources would derive from their own taxes and the participation in national taxes levied in the region. These resources would then be complemented by an equalization fund to be distributed based on a combination of factors:
population, size of the region, health expenditure and fiscal capacity (ISAE, 2003, p. 24).
The greater financial autonomy of the regions accompanied an extension in the administrative tasks assigned to them (law 59/97 and legislative decrees 143/97, 422/97, 469/97 and 112/98), which is the last way that Italy has become more federal. The administrative functions devolved covered three broad areas: development and economic activities, infrastructure and environment, and services (labor market, schools, administrative police). Early estimates indicated that the reform would transfer 23,000 employees from the central government to the regions and – excluding the funds for the personnel – entail a one-
off transfer of 8.1 billion euros and 8.8 billion euros annually from the central government to the regions (ISAE, 2003, p. 20). Despite the major steps taken towards federalism, it would however be wrong to conclude that fiscal federalism has moved in parallel with political federalism. In spite of the measures introduced to reform regional funding, in reality the system is no longer fully centralized, but not yet federalized.
One of the sources of friction between the regions and the center has indeed been the extent of the regions’ financial autonomy we described above (ISAE, 2005). Legislative decree 56/2000 was supposed to be gradually implemented over a period of more than ten years, which would have changed the mechanism for granting transfers from a system based on the past levels of expenditure to an essentially automatic mechanism. In reality, and in spite of the decree’s intended extreme gradualism, it has never been implemented due to the opposition in particular of the poorer regions of the South (Macciotta & Zanardi, 2006;
Zanardi, 2006). The actual distribution of funds has thus continued to be decided based on the past levels of regional expenditure and – our own analysis below will suggest – ad-hoc and non-transparent deals between the government and the regions.
Starting in 1999 the central government has also introduced a Domestic Stability Pact (DSP) to keep regional spending under control, first in terms of budget balance and later – with the center-right government (2001-2006) – of spending limits. In particular, the imposition of spending limits constituted a significant interference in the regions’ budgetary autonomy, which was compounded by the limits the central government also imposed on their ability to adjust the rates of the regional taxes (ISAE, 2004, p. 55), the government’s purpose being to force the regional governments to cut their spending by first cutting their revenues (Bordignon, 2002).
Moreover, the regions and the national government do have an institutionalized forum in which to meet. In 1997, a reform (Law 59/97) greatly increased the scope of the State- Region Conference (Conferenza Stato-Regioni ). This Conference, originally set up in 1983, brings together the central government (the Prime Minister or another minister delegated by him) and the presidents of the regions and of the two autonomous provinces that make up the Trentino Alto-Adige region. The law stipulates that the regions must be consulted on all central government decisions that affect them (ISAE, 2003, p. 140). Even though the government can eventually decide against the opinion of the Conference, it must – as per a
decision of the Constitutional Court (ISAE, 2004) – justify why it did not take into account the position of the regions.
In terms of outcomes, Graph 1 presents information on the average debt levels in the regions both in absolute numbers and as a percent of GDP. The figures indicate that the debt burden has been increasing over the period we study.
Graph 1: Local Government Debt (Million Euros and Share of GDP, 1999-2006)
Source: Banca d’Italia, Relazione Annuale, various years
Theories of Fiscal Federalism: Hypotheses
As several scholars note, there exists a large gap between the actual behaviour of federations and the expectations of economic efficiency and fiscal prudence raised by work on federalism (Wibbels 2000, 2006; Oates, 1993; Tiebout, 1956; Weingast, 1995). In fact, much of the initial research was based on the experience of the United States, and as scholars have expanded the scope of their research, they have been able to identify a number of institutional and political factors that might not be relevant in the US case but that can have a significant effect on the fiscal behaviour of sub-national and national actors. A first and widespread finding is that the fiscal profligacy of regional governments tends to increase with the extent to which their expenditure is funded through grants rather than own revenues, namely with
the extent of vertical imbalance (Jones et al., 2000; Rodden, 2005; Rodden & Wibbels, 2002).
The basic rationale for this is the operation of the common resource pool problem (Weingast, Shepsle, & Johnsen, 1981): while spending benefits a certain territorially defined constituency, the costs are not entirely borne by it but are spread nationally. Since politicians are elected from territorially defined constituencies (this is the case of regional governments but also can apply to members of national legislatures), they will tend to support more spending for their constituency than what they would if the constituency had to finance regional expenditure in its entirety through their region’s own taxes and fees.4
Hence, a first hypothesis is that regions with lower financial autonomy will have less fiscal discipline than regions with higher financial autonomy. In operational terms, this means that a lower ratio of own revenues to grants from other levels of government will lead a given region to spend more, have greater deficits, and/or incur in more debt.5
H1: The lower the financial autonomy of a region, the lower its fiscal discipline
A second political factor is co-partisanship between regional and national governments, since co-partisanship might affect the incentives of regional political actors.
Inasmuch as the success of politicians competing for regional elections depends in part on the voters’ assessment of their party’s policies at the national level – the coattails effect – regional politicians might have an incentive to minimize the macroeconomic “bads” – such as inflation or high central government debt – that might result from regional overspending and central government’s bailouts (Rodden, 2005, pp. 125-126; Wibbels, 2006, pp. 175-176). Hence, regional governments with the same party composition as the national government can be
4 Moreover, this tendency to overspend is reinforced by the fact that the more a region is dependent on grants, the weaker is the intertemporal constraint on how much it spends. This is because regions that are largely dependent on intergovernmental transfers have stronger expectations of a bailout – in the form of further transfers, arrangements for access to bank credit and so on - from the central government (Rodden, 2002, 671).
5 Even in the presence of a common resource pool problem, actors might face political incentives to internalize the costs of their constituency’s fiscal choices. In particular, a strong national party system might lead national legislators to internalize the costs of district
spending (Inman & Fitts, 1990). However, proper testing of this hypothesis requires variation in the degree of party discipline within the country being studied, and as such cannot be tested within the short time series (six years) used in this paper. Similarly, because the composition of the center-left and center-right coalitions remained stable over the period, this paper does not test for the possible impact of regional government fragmentation on fiscal discipline (Alesina & Drazen, 1991; Franzese, 2002), which is another possible source for an exacerbated common pool resource problem.
expected to be more fiscally conservative than those regional governments that have a different partisan make-up, an expectation substantiated by findings from Argentina (Jones et al., 2000).
However, in order for coattails effects to tighten regional fiscal discipline it is necessary that there be awareness in the national discourse of the negative macro-economic impact of regional fiscal indiscipline (Rodden, 2005, p. 170). If the connection between regional overspending and macro-economic performance is not recognized, then regional governments might be tempted to be more fiscally profligate precisely if they have a co- partisan central government, since they might expect easier access to bailouts from the central government. Empirical work on India (Khemani, 2007) and Germany (Rodden, 2005) shows that those regional governments that are co-partisan of the central government tend to run higher deficits. Italy potentially falls in this case; an empirical study of regional health expenditure shows that co-partisanship only increased fiscal discipline when there was a major national political goal at stake, namely in the run-up to Economic and Monetary Union (Bordignon & Turati, 2005). This leads us to formulate the following hypothesis:
H2: Fiscal discipline will be lower for regional governments that are copartisan of the central government than for those that are not.
A third potential factor is the role of elections. Regional governments are elected like national ones, and, as their fiscal autonomy increases, one would expect that they would be more likely to use spending and taxation to improve the lots of their voters in the run-up to elections. In Brazil, for example, personnel spending has traditionally increased prior to provincial elections in a phenomenon that was common even when the national government was a dictatorship (Ames, Hiroi and Renno 2005). 6
6 We also investigated a straight partisanship argument in the very first draft of the paper.
The political economy literature has long studied the spending preferences of the left and the right (Hibbs, 1977), mostly with regard to national governments but also with regard to sub- national governments (Alt & Lowry, 1994). There is however no consensus view as to the impact of partisanship on the government’s fiscal stance. In contrast with an earlier view that left-wing governments are more fiscally profligate than conservative ones (Buchanan &
Wagner, 1977), later work has argued that left-wing governments might actually be more fiscally prudent that conservative ones (Cameron, 1985; Cusack, 1999) We did include a measure for “Left” regional governments in first analyses, but it was never significant.
H3: Fiscal discipline will deteriorate in election years.
We would also like to examine one variable that does not generally appear in empirical tests of fiscal federalism, namely social capital. Although the fiscal federalism literature assumes that regional governments have strong incentives not to be good stewards of the taxpayers’ money, it has limited its analysis to the impact of institutional and political factors. In regions with higher levels of social capital, local administrators might pursue more transparent and less corrupt practices, with positive effects on regional finances. The concept of social capital refers to the prevailing system of expectations individuals hold about other people’s and their own behaviour. On the one hand, it refers to the trust people put in others;
on the other hand, it refers to the goals individuals pursue. In particular, individuals should not only be after their own personal and short-term interest, but have among their ends the broader good of their community, namely have “civicness” or “civic virtue“ (Putnam, 1993, p. 88).
Going back to the debt practices that opened this paper, in Emilia-Romagna – one of the foremost examples of a highly civic region according to Putnam – a number of cities have joined together in a consortium to negotiate better deals with the banks, while the province of Treviso in Veneto (another highly civic region) has created a financial task force which assesses all the proposals made by the banks and is able to ensure that the financial risk is not borne by the provincial administration (Rimini, 2007). In contrast, the above-mentioned financial contract subscribed by the region Campania – an uncivic region in Putnam’s work – was negotiated by the son of the region’s president, who is responsible for relations with the Italian public sector for UBS, and who made a 28 million Euro profit for UBS from the deal (Rimini, 2007). To generalize from these anecdotes, which are consistent with Putnam’s argument, the paper posits the following:
H4: regions with greater social capital will have more fiscal discipline
To anticipate some of the results of our analysis, we have found that regional spending does not appear to be influenced by either political, economic or demographic variables. To address this rather surprising result, we have turned to the analysis of the determinants of transfers of the regions. As we have seen in the previous section, although transfers were
supposed to be gradually decoupled from expenditure, in reality they have continued to depend on past levels of expenditure, which means that regions might continue to base their spending decisions on the amounts of transfers (in turn based on past expenditure) that they receive.
The literature on fiscal federalism argues that intergovernmental transfers should serve to mitigate externalities and to equalize the fiscal capacity of the subnational units (Oates, 1993), and indeed the funding of the health service and the equalization of financial capacity were the main criteria for the allocation of funds to the region according to the mechanism set up by law 1133/99 and legislative decree 56/2000 (Bordignon & Emiliani, 2001, p. 75)
However, the lack of a transparent mechanism for the allocation of these transfer opens the door to the possibility that they might depend not only on the objective needs of the regions but also on other factors. Specifically, we are interested in assessing whether the amount of transfers from the central government to the regions might be influenced by the lobbying activity of the regional governments. Rune Sorensen, for instance, finds that in Norway regional governments that engage in more lobbying of the central government receive a proportionally higher fraction of intergovernmental grants (Sorensen, 2003).
By its nature, lobbying is difficult to measure. In the Italian case, however, we have attendance data on every meeting of the State-Region Conference between 2001 and 2004.
Given the central role this institution plays in bringing together central and regional politicians, attendance might provide a relatively unbiased indicator of the extent of personal contact between politicians at the two levels of government:
H5: The more frequent a regional government attends the State-Region Conference, the larger the transfers from the central government.
Consistently with the Norwegian case, we in fact find that the regions that engage in more frequent meetings with the central government receive more transfers from the government.7
7 To be sure, the activity of the regional executives is open to some interpretation. We have labelled it “lobbying,” which has a whiff of impropriety; however, one might also see it as a form of advocacy, perhaps of the type described for the United States by Aberbach (1990), although in that case the influence is in the opposite direction, i.e. from the central level (Congress committees) to the state level.
Moreover, the direct influence of the regional governors is not the only possible political source of influence on the distribution of transfers. Within the fiscal federalism literature, the study of party political factors affecting the amount of transfers from the central to the local governments has tended to focus on the different weight of regional representation in Parliament (e.g. Porto & Sanguinetti, 2001 for Argentina; Sorensen, 2003 for Norway; Atlas et al., 1995 for the United States).
However, while regional representation at the center generally occurs in Parliament, it does not need to take this form. In some federal systems (such as Russia) it is the regional governors that carry out this function (Wibbels, 2005, p. 7). In the Italian case, it is the State- Region Conference (and thus the regions’ presidents) that represents the regional interests.
Extending to the transfer side the logic about fiscal discipline of hypothesis H2, we focus on the potential role of political congruence between the central and regional governments. Just as the central government might be willing to accept greater spending and debt by copartisan regional governments because of the expected positive political impact of fiscal expansion, the central government might be more willing to transfer funds to copartisan regional governments than to regions governed by the opposition. Hence, our final hypothesis is:
H6: Copartisanship has a positive impact on the amount of transfers from the central government
Empirical analysis
With Hypotheses 5 and 6 to be examined later in the paper because they require a different empirical model, Hypotheses H1-H4 will be tested together based on the following model:
FISCAL DISCIPLINE = α + β1(FINANCIAL AUTONOMY) + β2(COPARTISANSHIP) + β3(ELECTION) + β4(SOCIAL CAPITAL) + Σβi(CONTROLSi) + ε
We perform a cross-section time-series analysis across the twenty Italian regions for the 1999-2004 period. We use three different operationalizations for FISCAL DISCIPLINE:
new debt per capita, per capita expenditure (net of interest payments to control for the size of
debt pre-existing our period of analysis), and per capita personnel expenditure.8 There were technically some restrictions on debt generation, such as a requirement that debt be used for
“development” purposes, but in practice all regions could generate new debt, and, as Table 1 indicated, most did.9 One of the main spending items the regions have responsibility over is health care, and one would expect there to be variation in this expense depending upon the age structure of the region. Finally, We focus on personnel expenditure as a typical form of clientelistic spending (Wibbels, 2005b, p. 164-165). The data are from the regional budgets (ISTAT, Various years-b).10
The variables that follow from our hypotheses are as follows. FINANCIAL AUTONOMY is operationalized as own taxes/(own taxes + transfers). Taxes are considered part of a region’s “own taxes” only if a region has at least some control over the relevant tax rate.11 Following Rodden (2002), taxes that are levied by the central government and automatically transferred to the region – based on a tax-sharing mechanism – are not considered own taxes and are counted as transfers. The coefficient’s sign is expected to be negative. COPARTISANSHIP is a dummy variable with a value of 1 if the regional and central governments are copartisan and 0 otherwise. In the period under analysis the bipolarization of the national party system also operated locally, so that the party composition of the regional governments coincided with that of the national government (the only exceptions where some of the autonomous regions, where regional parties were in government that were not in the central government; these case have been coded as 1, namely
8 We also investigated a fourth dependent variable, namely new debt as a percentage of total revenue. The results were quite close to what we find for new debt per capita. The results are available upon request.
9 Until the constitutional revision of 2001 regional debt was regulated by an ordinary law, which allowed it for “development” purposes (Giarda, 2001). The constitutional reform of 2001 has restrained the regions’ access to debt by limiting it to the funding of capital spending and has mandated that the central government cannot guarantee regional debt.
Increases in the stock of debt may in fact be the most precise gauge of fiscal discipline, however, since the other measures are more easily the object of accounting tricks (Hallerberg, Strauch, & von Hagen, 2009). We also caution that the classification of what is capital and what is current spending is notoriously flexible (Rodden, 2005).
10 Given the special nature of Trentino Alto-Adige, which is composed of two autonomous provinces that carry out most of the region’s functions, the data for this region are the sum of the values for the regional and provincial governments.
11 We have used the Tributi Propri (“own taxes”) section of the Title I of the regional budgets. The only exception is Sicily, where revenues from tax-sharing are budgeted as own taxes (Bordignon, 2002). For this region we have therefore detracted the income tax revenues from the own taxes.
as copartisan) . The coefficient’s sign is expected to be positive. ELECTION measures the number of electoral campaign months in a given region for each year (Rodden, 2005, p. 172).
The measure of SOCIAL CAPITAL updates to the period of analysis one of the indices of government performance used by Putnam in his original study on social capital:
lateness in the approval of the regional budget.12 We thus operationalize social capital indirectly, namely through a measure of government performance – although correlated to social capital (Putnam, 1993) – rather than through a measure of social capital. The original connection Putnam made between the civicness of a community and government performance has been criticized for the lack of a clear mechanism linking trust within the community and the efficiency of the government (Levi, 1996). We try to overcome this problem by using one of Putnam’s original concepts that taps into the actual behaviour of the administrators, namely the importance they attribute to respecting a legally mandated deadline.
LATE is measured as the number of days between the legal deadline for the approval of the regional budget (December 31) and the actual approval date (the approval dates are taken from the regional laws approving the budget). If the budget is approved on or before December 31 the variable is coded as 0. The expectation is that in regions with low social capital the regional administrators will reflect this lack of civicness (Boix & Posner, 1998) and will tend to use public money in a non-transparent manner, thus leading to less fiscal discipline. Thus, the coefficient’s sign is expected to be positive.
As for the controls, we use per capita income (both as a level and a first difference measure), age structure (proportion of population above 65), unemployment rate, and population size (in terms of logged population).13 Differences in income imply different spending capacities on public goods for the same tax rates (Oates, 1993, p. 82). The age structure affects health expenditure, which on average absorbs more than 70% of regional
12 This variable is part of an “index of institutional performance” created by Putnam; its correlation with the entire index is 0.58 (Putnam, 1993, appendix C). The index’s correlation with a measure of civicness is 0.86 (Putnam, 1993, p. 151)
13 We also included a dummy variable for the autonomous regions origins. Their funding is overwhelmingly based on transfers and not on own taxes. For historical reasons, they have also been provided with funding “in excess” of the functions that they are called to perform, and thus have more funds to spend per capita than the other regions (Giarda, 2001). This variable was never significant in the cross section regressions, however, and, because it does not vary, it could not be included in the GMM specifications that follow.
expenditure (ISAE, 2004, p. 39).14 In terms of economic factors, we include the unemployment rate.15 Finally, we consider the population size of the regions for the following reasons. First, it is one of the determinants of the distribution of government grants. Second, a region’s size might affect how efficient it is in fulfilling its policy mandates due to economies of scale (Pereira, 1996). Moreover, the population size of a region might affect the leeway it has in its spending: on the one hand, certain regions might be “too big to fail,” so that they might expect to be bailed out by the central government if they overspend; on the other hand, especially small regions might also be able to overspend because their small size limits the negative macro-economic effects their behavior might have on the national economy (Rodden, 2005).
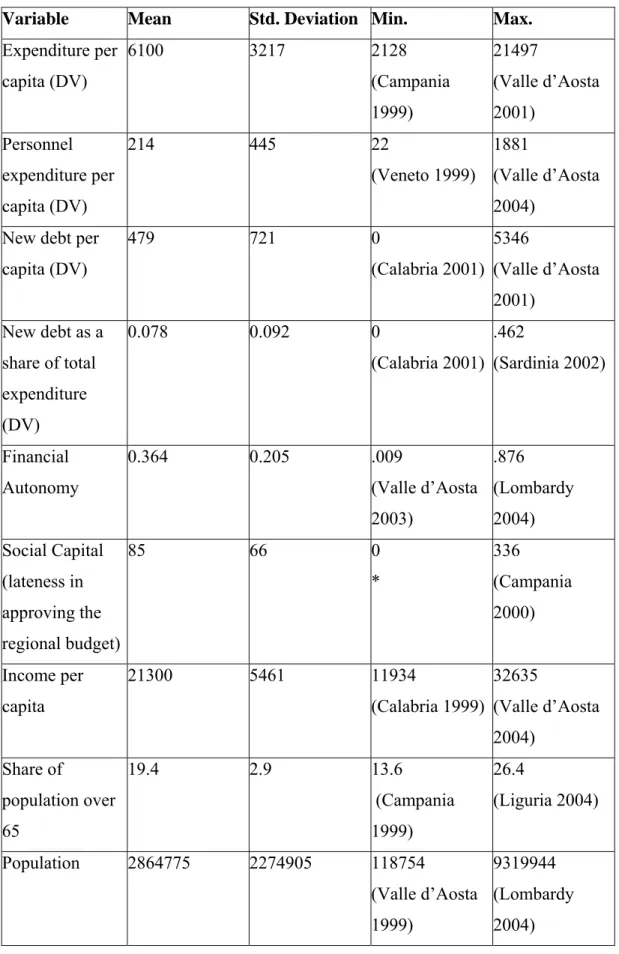
The following two tables summarize our variables:
14 Age structure is also the variable used by the Health Ministry to assess the health needs of the regions (Bordignon & Emiliani, 2001, p. 76).
15 Using first difference unemployment leads to similar, generally statistically insignificant, results and are not reported here.
Table 2: Summary of Variables
Variable Mean Std. Deviation Min. Max.
Expenditure per capita (DV)
6100 3217 2128
(Campania 1999)
21497
(Valle d’Aosta 2001)
Personnel expenditure per capita (DV)
214 445 22
(Veneto 1999) 1881
(Valle d’Aosta 2004)
New debt per capita (DV)
479 721 0
(Calabria 2001) 5346
(Valle d’Aosta 2001)
New debt as a share of total expenditure (DV)
0.078 0.092 0
(Calabria 2001) .462
(Sardinia 2002)
Financial Autonomy
0.364 0.205 .009
(Valle d’Aosta 2003)
.876 (Lombardy 2004) Social Capital
(lateness in approving the regional budget)
85 66 0
*
336
(Campania 2000)
Income per capita
21300 5461 11934
(Calabria 1999) 32635
(Valle d’Aosta 2004)
Share of
population over 65
19.4 2.9 13.6
(Campania 1999)
26.4
(Liguria 2004)
Population 2864775 2274905 118754 (Valle d’Aosta 1999)
9319944 (Lombardy 2004)
* Too many region-years to report
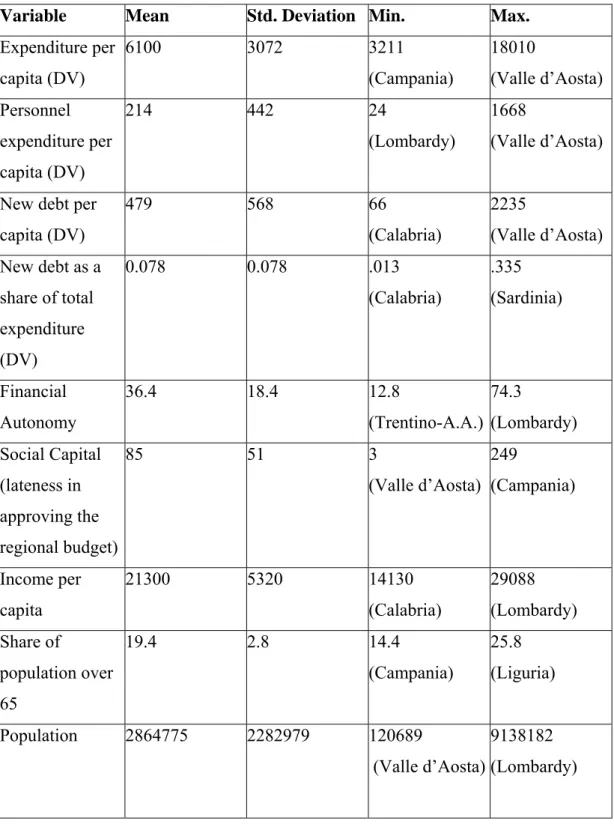
Table 3: Summary of Variables (mean values)
Variable Mean Std. Deviation Min. Max.
Expenditure per capita (DV)
6100 3072 3211
(Campania)
18010
(Valle d’Aosta) Personnel
expenditure per capita (DV)
214 442 24
(Lombardy)
1668
(Valle d’Aosta)
New debt per capita (DV)
479 568 66
(Calabria)
2235
(Valle d’Aosta) New debt as a
share of total expenditure (DV)
0.078 0.078 .013
(Calabria)
.335 (Sardinia)
Financial Autonomy
36.4 18.4 12.8
(Trentino-A.A.) 74.3
(Lombardy) Social Capital
(lateness in approving the regional budget)
85 51 3
(Valle d’Aosta)
249
(Campania)
Income per capita
21300 5320 14130
(Calabria)
29088 (Lombardy) Share of
population over 65
19.4 2.8 14.4
(Campania)
25.8 (Liguria)
Population 2864775 2282979 120689
(Valle d’Aosta)
9138182 (Lombardy)
A brief perusal of these tables already prompts some observations. First, Valle d’Aosta appears to be an outlier on several dimensions. It is the largest spender in general and on personnel and has added the largest amount on debt per capita. It is also the smallest region, suggesting that size might indeed matter, in the sense that smaller regions might be freer to pursue a looser fiscal policy. It is also an autonomous region, and autonomous
regions in general rely less on own-source revenues. Lombardy, in contrast, tends to be an outlier in the other direction. It is the largest region, it has the highest level of financial autonomy, and it spends the least per capita on personnel. This latter finding is consistent with the expectations of the impact of financial autonomy on regional spending decisions, and also with the hypothesis that larger regions might be more efficient. Lombardy is also the richest region (in terms of mean per capita income between 1999 and 2001), suggesting a point that has so far not been emphasized, but which has significant political relevance in Italy, namely that richer regions have greater financial autonomy than poorer ones. Among other things, this entails greater latitude of choice: in the face of cuts on grants or of insufficient central government grants to perform all the regional functions, richer regions may have an easier time raising more local revenues rather than reducing the level of services or increase debt.
In fact, income might also increase regional flexibility by affecting the ability of regions to resort to debt: while Valle d’Aosta (with a per capita income only a few euros below that of Lombardy) had the largest new per capita debt in the period of this study, Sardinia,, one of the poorest regions, had the largest new debt as a share of regional expenditure, suggesting that poorer regions might see debt as the only way to fund their functions. Finally, it is interesting to note that Campania, one of the “uncivic“ regions in Putnam’s study, is also the one that has the worst measure of government performance in our study: on average, its budget was approved in August of the fiscal year of reference, making it a dubious instrument for the choice of regional spending priorities.
Analysis
More precise conclusions, of course, can only be drawn through a more systematic analysis of the data, to which we now turn. We have reliable data for the period 1999, or from the time that the regions have increased powers, to 2004. The twenty regions vary on many possible dimensions, and our goal is to identify everything that makes a particular region “unique”
(Przeworski and Teune 1970). Our dataset includes information on twenty fixed units over five years, so our initial inclination was to do a fixed effects regression with the level version of the dependent variable. 16While the results with fixed effects are largely the same and we report them for comparison’s sake, we have reason to doubt this empirical specification. It includes a lagged dependent variable with a small number of periods, and in this case the estimator should be biased. To get at this, we use the generalized method-of-moments estimator (Arellano and Bond 1991),17 and we focus on this specification in the discussion of the results.18
16 The dependent variable appears in level, instead of first difference, terms in this
specification. Graph 1 presented earlier indicated that debt appears to be non-stationary, as it increases every year. Note, however, that our measurement for debt is “new debt,” so it
approximates a first difference. There is no similar pattern for the four dependent variables we care about here with the exception of transfer payments; see more about that analysis below.
17 See Scheve and Slaughter (2004) for an example of an empirical application. In practice, we use Arellano-Bond if equation passes Sargan test, while we use the Arellano-
Bover/Blundell-Bond procedure if the initial Sargan test suggests the standard model’s overidentifying restrictions were not valid. Hence, all equations reported passed a Sargan test.
18 We checked the results for sensitivity to particular cases. An analysis of leverage statistics indicates that the region of Valle d’Aosta consistently was influential. As we noted before, it also is an outlier in several dimensions, such as size, financial autonomy, and, to a lesser degree, financial wealth. We reran the results excluding the cases from this region. In general,the statistical significance of the variables we find important here increases. We therefore focus on the full dataset because they do include the more conservative estimates.
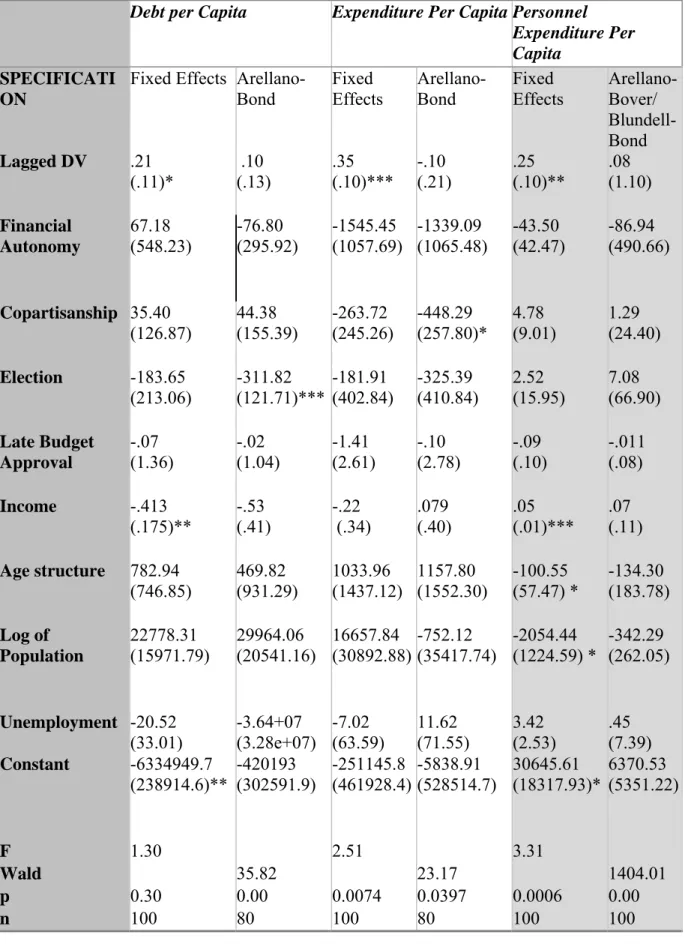
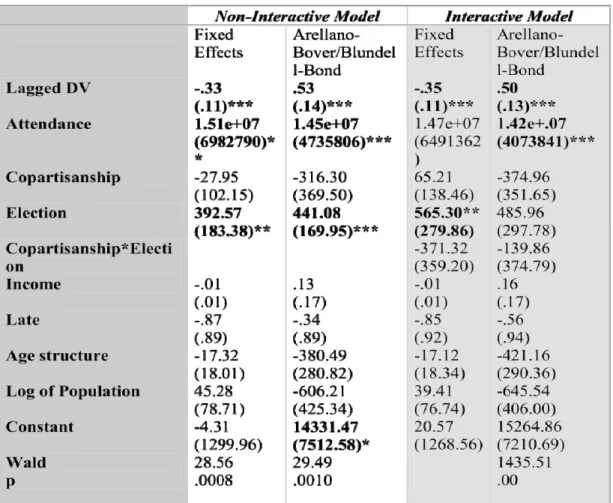
Table 4: Determinants of Fiscal Discipline
Debt per Capita Expenditure Per Capita Personnel Expenditure Per Capita
SPECIFICATI ON
Fixed Effects Arellano- Bond
Fixed Effects
Arellano- Bond
Fixed Effects
Arellano- Bover/
Blundell- Bond Lagged DV .21
(.11)* .10
(.13) .35
(.10)*** -.10
(.21) .25
(.10)** .08 (1.10) Financial
Autonomy
67.18 (548.23)
-76.80 (295.92)
-1545.45 (1057.69)
-1339.09 (1065.48)
-43.50 (42.47)
-86.94 (490.66)
Copartisanship 35.40 (126.87)
44.38 (155.39)
-263.72 (245.26)
-448.29 (257.80)*
4.78 (9.01)
1.29 (24.40) Election -183.65
(213.06) -311.82
(121.71)*** -181.91
(402.84) -325.39
(410.84) 2.52
(15.95) 7.08 (66.90) Late Budget
Approval
-.07 (1.36)
-.02 (1.04)
-1.41 (2.61)
-.10 (2.78)
-.09 (.10)
-.011 (.08) Income -.413
(.175)** -.53
(.41) -.22
(.34) .079
(.40) .05
(.01)*** .07 (.11) Age structure 782.94
(746.85)
469.82 (931.29)
1033.96 (1437.12)
1157.80 (1552.30)
-100.55 (57.47) *
-134.30 (183.78) Log of
Population
22778.31
(15971.79) 29964.06
(20541.16) 16657.84
(30892.88) -752.12
(35417.74) -2054.44
(1224.59) * -342.29 (262.05)
Unemployment -20.52
(33.01) -3.64+07
(3.28e+07) -7.02
(63.59) 11.62
(71.55) 3.42
(2.53) .45 (7.39) Constant -6334949.7
(238914.6)** -420193
(302591.9) -251145.8
(461928.4)-5838.91
(528514.7) 30645.61
(18317.93)* 6370.53 (5351.22)
F 1.30 2.51 3.31
Wald 35.82 23.17 1404.01
p 0.30 0.00 0.0074 0.0397 0.0006 0.00
n 100 80 100 80 100 100
Standard Errors in parentheses; year dummies omitted, ***p< .01; **p< .05; *p< .10
One of the findings is a non-result--little seems to affect either per capita spending or per capital personnel spending in these regions. None of the political variables matter. In fact, standard control variables that one would expect to have an impact on expenditures, such as the age of the population and economic indicators like income and unemployment, do not impact expenditures either. This suggests either that Rome continues to play a dominant role in deciding upon any increases in spending regardless of local conditions or that simple inertia from the past determines present spending.
Across the specifications, there are no significant findings for either fiscal autonomy or for our measure of social capital (namely the lateness of the budget). We would like to be careful about what we read into this result. If one does a specification without fixed effects, fiscal autonomy is significant in the expenditure and personnel regressions. This suggests that there may be another variable correlated with the level of autonomy. As we note elsewhere, wealthier regions tend to have more autonomy. We have already included wealth as one independent variable, however, and once one uses fixed effects the standard error on fiscal autonomy increases. Similarly, our result for social capital does not preclude the possibility that social capital might have an impact on fiscal discipline; our result might be due to the proxy we chose for social capital, namely a measure of government – and in particular procedural – performance. While this is consistent with Putnam’s original argument, more recent work has shown that the connection between social capital and government performance might be more complex than what Putnam thought; in particular, work done on Germany and the United States shows that social capital is indeed connected with government activism (namely its promptness to respond to citizens’ demands), but not with measures of procedural performance such as the one used in this paper (e.g., Tavits, 2006).
The most interesting findings come from the analysis of new debt across the regions.
The main finding relates to the impact of elections. New debt drops 311 euros per person below what it would have been in non-electoral years. This is a surprising result. The idea that Italian voters would be sensitive to, and react with punishment for, incumbents who dare to increase debt does not seem, on the face of it, to be accurate--at the national level, Italy has one of the highest debt levels as a percent of GDP in the European Union. An analysis of the determinants of transfers, however, might offer a possible explanation for this somewhat incongruous result.
Hypotheses H5 and H6 – that the transfers to the regions in part depend on the extent of they lobbying activities and on copartisanship – are tested separately, since they focus on a different dependent variable – transfers per capita – than the other hypotheses. They are tested on a shorter dataset (2001-2004) based on the availability of data for the most important independent variable (attendance at the meetings of the Conferenza Stato-Regioni). The hypotheses are tested based on the following model:
TRANSFER PER CAPITA = α + β1(ATTENDANCE) + β2(COPARTISANSHIP) + β3(ELECTIONS) + β4(LATEELECTION)+Σβi(CONTROLSi) + ε
Compared to the model used to test Hypotheses H1 through H4, this equation uses a variable (ATTENDANCE) that measures the number of times in a year representatives of the region attended the Conferenza Stato-Regioni, the institutional locus where the regions and the government negotiate the distribution of fiscal resources among the regions (ISAE, 2003, pp. 138-139).19 The idea is to measure the extent of regional lobbying through their participation in the main forum where the central government and the regional governments meet. Participation in Conferenza is voluntary, so it offers the opportunity to directly observe the behaviour of the regional governments, while other work done on the effect of regional lobbying on transfers from the central government is based on surveys (Sorensen, 2003).
Table 5 gives a summary description of the dependent variable and of the main theoretical variable; table 6 provides the results of the regression analysis. Note that attendance is weighted by regional population. While this makes the coefficient somewhat awkward to interpret (as it represents the change in per capita transfers for one “attendance per capita”), it does capture that intuition that the presidents of larger regions might be more able to attend the meetings simply because the regional government is larger and thus can devote more time to contacts with the central government. As with the previous analysis, we use both panel regressions with fixed effects as well as a GMM estimator, although we focus on the GMM estimator when interpreting results.
The results show that the extent to which regions participate in the regular meetings with the central government does have an impact on the amount of transfers they receive from
19 based on the minutes of the meetings, available at
http://www.governo.it/Conferenze/c_stato_regioni/index.html
the government.20 This forum is not irrelevant despite the fact that attendance is voluntary.
This finding would seem to validate the argument that lobbying the central government affects the funds that a given region receives. Yet one must be careful in how one interprets the statistical relationship. One rival explanation would be that regions that receive more funds feel they have a greater obligation to appear in the forum. Given the type of data that we have, we cannot differentiate between a lobbying explanation and one that would claim that there is merely an association between the two variables rather than a direct causal relationship.
Moreover, we find that elections positively affect the amount of transfers to the regions. This might explain our previous finding that regions tend to resort to debt less before an election: since the creation of the regions, the central government’s transfers have systematically been below the level needed to carry out the regions’ functions, chief among them the provision of health services (Della Cananea 2004), and indeed it seems that these electoral transfers go to fund part of the ordinary spending of the regions. In sum, regions may resort to debt instead of new taxes to fund their ordinary functions, and they have less need to do so close to the elections simply because they receive more funds at those times.
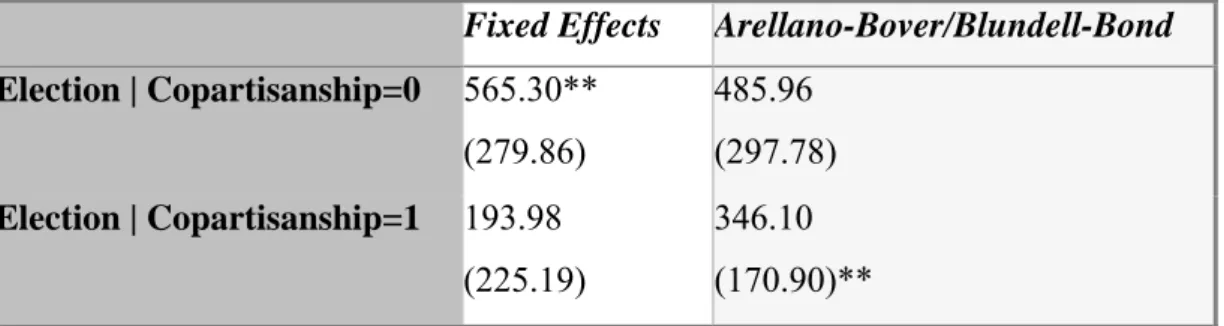
There is also an interesting finding regarding copartisanship and transfers (hypothesis H6). At first glance, it would appear that all regions get a big dollop of transfers per capita whenever there is a regional election. It could be that national governments cannot target specific regions when it gives out transfers, but to be sure we ran another analysis that includes interaction terms for co-partisanship and election. Table 7 presents the conditional coefficients for election given co-partisanship. The results are not consistent across the panel model with fixed effects and the GMM estimator. Assuming that the GMM estimator is the more conservative of the two, however, the results indicate that regions with co-partisans in Rome get an average of 346 euros more per capita in electoral years than regions that have opposition parties up for re-election.
20 Beside the number of times, weighted by regional population, a region attended the Conferenza meetings, we also ran a regression using the number of regional representatives attending the meetings, also weighted by regional population. The results are very similar to those presented in the text.
Table 5: Transfers per capita and Attendance of the Conferenza Stato-Regioni (mean values)
Variable Mean Std. Deviation Min. Max.
Transfers per capita (DV)
1879.18 1744.09 493.07 (Lombardy)
7445.88
(Valle d’Aosta)
Attendance 10.1 4.2 2.4
(Campania) 17.2 (Emilia- Romagna)
Table 6: Determinants of Change in Per Capita Transfers
(More Notes: A Sargan test under a standard GMM estimator indicated that the overidentifying restrictions were not valid; our guess is the reason is that the variance between the panel-level effect and the idiosyncratic error was too large. This modified technique uses moment conditions of lagged differences in addition to the usual lagged levels for the differenced equation, and a Sargan test (without robust standard errors—this test does not work with robust errors) indicated one could not reject the hypothesis that the overidentifying restrictions were valid.
There is no evidence of problems with autocorrelation based on an Arellano-Bond test for zero autocorrelation at t=2.)
Table 7: Conditional Coefficients For the Effect of Elections given Copartisanship Fixed Effects Arellano-Bover/Blundell-Bond Election | Copartisanship=0 565.30**
(279.86)
485.96 (297.78) Election | Copartisanship=1 193.98
(225.19)
346.10 (170.90)**
***p< .01; **p< .05; *p< .10, two-tailed tests.
Conclusions
The purpose of this paper was to test some of the most important hypotheses from the fiscal federalism literature on a newly federalizing country like Italy, namely a country that has many but not all of the political and fiscal features of a full-blown federation. The regions have a much broader policy role than in the past, but they still lack direct representation in Parliament.
As regards the fiscal arrangements, the country’s constituent units – the regions – have since the late 1990s moved towards much great fiscal autonomy, both in consideration of the shift of regional funding from earmarked to block grants and – more importantly based on the premises of is paper – of the introduction of regional taxes, namely taxes over which regions have some significant control (in particular through their ability to set or partially set the tax rates). At the same time, however, the move toward fiscal federalism has also suffered setbacks, in particular with the central government-imposed limits on regional spending and regional tax rates, and with the non-implementation of a transparent mechanism for the redistribution of funds among the regions.
Combining the different analyses, the following picture emerges. Regional expenditure does not depend on regional-level factors, which probably reflects the persisting importance – in spite of the attempts to set up a more transparent mechanism with law 56/2000 – of past levels of expenditure as determinants of intergovernmental transfers and thus of future expenditure There is, however, an interesting debt dynamic. Debt drops in electoral years, and this happens regardless of which party controls the regional government.
At the same time, assuming we put more confidence in the GMM results, transfers increase in electoral years also regardless of the political congruence between regional and central
governments, but the increase is greater if the regional government is from the same coalition as the one in Rome.
There is another result from the analysis of transfers per capita that should receive more attention. While it stands to reason that lobbying might matter, for obvious reasons it is difficult to measure it. This paper takes a new approach to this problem by making use of the actual attendance records at the meetings between the regional and central governments in the 2001-2004 period. The results confirm the expectation that lobbying – or at least attending meetings with the government – pays off: the more assiduous participants receive more transfers from the government. This suggests that there should be more work on the effects of the institutions that intermediate between the national and the sub-national level.
At the same time, we did not find empirical support for other hypothesis common in the literature. To our surprise, fiscal autonomy, or the percentage of own-source revenue, did not affect fiscal discipline. We want to be careful reading too much into this result. The sign on this variable across specifications was that correct one, that is, more autonomy was associated with more “discipline” depending upon the measure, but it was not statistically significant. It may be that it takes time for the common pool resource problem to have tangible effects on fiscal outcomes. Similarly, we did not find support for a “social capital”
explanation.
References
Aberbach, J. (1990). Keeping a Watchful Eye. Washington: Brookings.
Alesina, A., & Drazen, A. (1991). Why are Stabilizations Delayed? American Economic Review 81, 1170-1188.
Alt, J. E., & Lowry, R. C. (1994). Divided Government, Fiscal Institutions, and Budget Deficits: Evidence from the States. American Political Science Review, 88(4), 811- 828.
Atlas, C., Gilligan, T., Henderschott, R., & Zupan, M. (1995). Slicing the Federal Net Spending Pie:Who Wins, Who Loses, and Why. American Economic Review, 85, 624–629.
Ames, B., Hiroi T, and Renno L. 2005. “The political economy of personnel expenditures:
Brazilian states, 1965-1994.” Brazilian Journal of Political Economy, 25 (1): 50-69 Arellano, M., and S. Bond. 1991. "Some Tests of Specification for Panel Data: Monte Carlo
Evidence and an Application to Employment Equations." Review of Economic Studies.
58: 277-97.
Arellano, M., and O. Bover. 1995. "Another Look at the Instrumental Variable Estimation of Error-Components Models." Journal of Econometrics. 68: 29-51.
Beck, N., & Katz, J. (1995). What to do (and not to do) with Time-Series Cross-Section Data.
American Political Science Review, 89(3), 634-647.
Bird, R., & Tarasov, A. (2004). Closing the Gap: Fiscal imbalances and Intergovernmental Transfers in Developed Federations. Environment and Planning C: Government and Policy, 22, 77-102.
Blundell, R., and S. Bond. 1998. "Initial Conditions and Moment Restrictions in Dynamic Panel-data Models." Journal of Econometrics. 68: 29-51.
Boix, C. (2000). Partisan Governments, the International Economy, and Macroeconomic Policies in Advanced Nations, 1960–93. World Politics, 53(October), 38-73.
Boix, C., & Posner, D. N. (1998). Social Capital: Explaining Its Origins and Effects on Government Performance. British Journal of Political Science, 28, 686-693.
Bordignon, M. (2002). Federalismo e Finanziaria: Un'intervista a Massimo Bordignon [Federalism and the Financial Law: An Interview to Massimo Bordignon]. La Voce (www.lavoce.info).