The Impact of Fiscal Decentralisation
on Education and Other Types of Spending
Marius R. Busemeyer
Max Planck Institute for the Study of Societies, Cologne May 2007
MPIfG Discussion Paper ISSN 0944-2073 (Print) ISSN 1864-4325 (Internet)
© 2007 by the author(s)
Marius R. Busemeyer is researcher at the Max Planck Institute for the Study of Societies.
busemeyer@mpifg.de
MPIfG Discussion Papers are refereed scholarly papers of the kind that are publishable in a peer-reviewed disciplinary journal. Their objective is to contribute to the cumulative improvement of theoretical knowl- edge. The papers can be ordered from the institute for a small fee (hard copies) or downloaded free of charge (PDF).
Downloads www.mpifg.de
Go to Publications / Discussion Papers
Max-Planck-Institut für Gesellschaftsforschung Max Planck Institute for the Study of Societies Paulstr. 3 | 50676 Cologne | Germany
Tel. +49 221 2767-0 Fax +49 221 2767-555 www.mpifg.de info@mpifg.de
for a long time without coming to any firm theoretical and empirical conclusions. In contrast to earlier studies, this paper looks at the impact of fiscal decentralisation across different types of spending. It is argued that the impact varies and can be positive or negative, depending on the distribution of spending across levels of government. A sim- ple model is developed to show that local competition in the provision of local/region- al public goods (e.g. education) can result in higher spending. However, when public goods are provided at the national level (e.g. pension policies), fiscal decentralisation encourages local policy pre-emption, thus lowering spending. The model is tested em- pirically by means of a pooled time series analysis of education, social spending and public spending in OECD countries from 1980 to 2001.
Zusammenfassung
Die Debatte um den Einfluss von fiskalischer Dezentralisierung auf öffentliche Aus- gaben wird schon seit geraumer Zeit geführt, jedoch sind eindeutige und belastbare theoretische oder empirische Befunde schwer zu erzielen. In Abgrenzung und Fortent- wicklung vorangegangener Studien untersucht das vorliegende Papier den Einfluss fis- kalischer Dezentralisierung auf verschiedene Typen öffentlicher Ausgaben. Es zeigt sich, dass der Einfluss je nach betrachtetem Ausgabentypus positiv oder negativ sein kann.
Präsentiert wird ein einfaches Modell, das diese unterschiedlichen Befunde erklärt.
Es wird argumentiert, dass ein lokaler Überbietungswettbewerb in der Bereitstellung öffentlicher Güter bei fiskalischer Dezentralisierung zu insgesamt höheren Ausgaben führen kann, wenn diese öffentlichen Güter vorrangig auf der lokalen Ebene bereit- gestellt werden (z.B. Bildung). Im Gegensatz dazu führt fiskalische Dezentralisierung bei nationalen öffentlichen Gütern (z.B. Rentenausgaben) zu „local policy pre-emption“
und damit zu einem insgesamt negativen Ausgabeneffekt. Das Modell wird durch eine gepoolte Zeitserienanalyse von OECD-Ländern der Jahre 1980 bis 2001 empirisch ge- testet.
Contents
1 Introduction 5
2 Fiscal decentralisation: The state of the debate 5
3 A model of local competition in the provision of regional public goods 8
4 Empirics 16
5 Conclusion 27
Appendix: Data sources and definitions 28
References 29
1 Introduction
The debate on fiscal decentralisation and its impact on public spending is not new. At least since the early 1970s, scholars have argued about the theory underlying this as- sociation as well as its empirical implications, but up to now no consensus on the mag- nitude and direction of the impact of fiscal decentralisation on spending has emerged (Feld/Kirchgässner/Schaltegger 2005: 5–6). This paper aims to enrich both the theoreti- cal and empirical debates. Borrowing from and building on established public choice theories of fiscal competition and decentralisation, this paper argues that fiscal decen- tralisation does not necessarily lead to lower spending per se. The contention is that this hypothesis is largely based on assumptions about voters’ preferences, which scholars (of economics, but also of public choice) have not challenged enough. Using building blocks of established theories of public finance, it is shown that slightly different, but maybe more realistic, assumptions about voters’ preferences can alter the predictions of the impact of fiscal decentralisation on spending: instead of decreasing spending, fiscal decentralisation can increase aggregate spending, depending on the respective type of spending. This perspective, i.e. analysing the impact of fiscal decentralisation on differ- ent types of spending, is also the empirical contribution of this paper. Surprisingly, all of the studies of the association between fiscal decentralisation and spending (which will be introduced in more detail below) look at total public spending, thereby neglect- ing the possibility that different types of spending might be affected differently. This is because certain types of spending like social spending tend to be concentrated on the national level, while the distribution of others (e.g. education spending) is often tilted towards lower levels of government.
The remainder of the paper is organised as follows. Before we present our model in greater detail, a quick recap of the debate on fiscal decentralisation is given (section 2).
Section 3 outlines a model of local competition, which is tested empirically in the fol- lowing section (section 4) in a pooled time series analysis of 21 OECD countries from 1980 to 2001. The final section concludes.
2 Fiscal decentralisation: The state of the debate
The public choice literature on the relationship between fiscal decentralisation and spending that is the preferred theoretical point of departure even for political science work in this area (e.g. Rodden 2003) comes in two flavours:
I would like to thank Achim Görres, Philip Manow, Wolfgang Streeck and Hendrik Zorn as well as the research group of Wolfgang Streeck for very helpful comments and suggestions. Part of the research for this paper was conducted in the project on ‘Education Spending in International Comparison’, directed by Manfred G. Schmidt from the Institute for Political Science, University of Heidelberg. I would like to thank Manfred Schmidt for his support as well.
The competition thesis1
Based on the seminal contribution of Brennan and Buchanan (1980), the competition thesis has also been called the ‘Leviathan’ thesis (Oates 1985; Zax 1989). Government is portrayed as a monolithic actor whose interest is revenue maximisation (Brennan/
Buchanan 1980: 29). To Buchanan, the growth of the public sector in the second half of the twentieth century is indicative of a process he calls ‘politics for profit’ (Bucha- nan 1977: 13), in which politicians expand public spending to maximise their ‘political income’ and increase their chances of re-election. In an ideal democracy, the electoral process should be a sufficient restraint on government, but fiscal constraints can sub- stitute as efficient restraints on the power of government to tax in a less-than-ideal set- ting (ibid.: 8). Fiscal federalism in a decentralised polity can be seen as ‘market analogy’
(Buchanan 1995: 21), introducing interstate competition and effectively limiting the power of constituent governments to raise spending.
The decentralisation thesis
The decentralisation thesis goes back to Oates (1972) and is more concerned with the connection between the policy-maker and the electorate than with interstate relations.
The core assertion of the ‘decentralisation theorem’ (as Oates called it) is that it will be more efficient (in terms of overall welfare and Pareto-efficiency) to provide public goods locally and in different quantities than to provide a uniform level of a given pub- lic good through a centralised state polity (Oates 1972: 11, 35). In other words, in a cen- tralised setting, outcomes will be close to the ‘overall’ median voter’s position whereas, in a decentralised setting, outcomes may vary in accordance with the positions of local median voters (Oates 1985: 749), minimising the sum of discrepancies between the policy positions of voters and the actual outcomes. Interestingly, Oates, too, emphasises the analogy between his model and a competitive market (Oates 1972: 127) but, un- like Brennan and Buchanan, he stresses the Tiebout (1956) quality of a decentralised setting, in which the ‘consumer’ of public goods (the voter) is offered a wider range of price/local public good bundles. Consequently, the benefits of decentralisation increase with the degree of heterogeneity found in the voter population. According to Oates, the direction of the impact of fiscal decentralisation at the aggregate level of spending remains unclear at the theoretical level because one would have to know ‘both the dis- tribution of tastes and the location of the populace’ (Oates 1985: 749). For Kirchgässner (2001: 12), the strengthening of the connection between voters and politicians implies lower spending because he assumes that voters want to limit government spending in any case.
1 The terminology ‘competition thesis’ and ‘decentralisation thesis’ is taken from Kirchgässner (2001).
Both the decentralisation and the competition theses have normative undertones. They portray fiscal decentralisation as a means to increase competition, to lower spending, to strengthen the connection between voter and politicians, to limit fiscal illusion, to in- crease social trust, etc. Most of these claims have to be put to an empirical test, but, even at a theoretical level, potential disadvantages of fiscal decentralisation can be identified.
Decentralisation can result in the loss of ‘economies of scale’ (Oates 1985: 749), i.e. in- creased costs of administration. Delegation of power to local authorities can result in the ‘capture’ of public institutions by local political elites – a problem which is found to be more relevant for developing countries (Bardhan/Mookherjee 2000; Jing/Zou 2001:
273–274).
Since the days of Brennan, Buchanan and Oates, the theory of fiscal decentralisation has made some important advances. More recent models try to integrate the welfare economics and the public choice perspectives of the decentralisation and competition theses. The Oates/Tiebout logic of enhanced closeness of interests of voters and gov- ernmental actors is likely to be portrayed as the ‘good side’ of fiscal decentralisation, whereas increased tax competition is expected to lead to an underprovision of public goods (i.e. the ‘bad side’ of decentralisation) (Hange/Wellisch 1998; Wellisch 2000: 14–
18; cf. Brueckner 2004: 133–134). In this vein, today’s scholars follow Oates’ normative assessment of the deleterious consequences of tax competition (Oates 1972: 142–143) and not that of Brennan and Buchanan. The challenge for these integrated models is to identify ‘conditions’ under which the benefits outweigh the costs of decentralisation (Hange/Wellisch 1998). In Breton’s concept of ‘competitive governments’, competition between governments acts as a preference-revelation mechanism, strengthening the connection between taxing and spending decisions (Breton 1996: 3).
Another line of inquiry sets out from a further theoretical weakness of the early models.
Despite much theorising about it, not much effort had been put into the operationalisa- tion of the term ‘fiscal decentralisation’. Sketching out later developments, Brennan and Buchanan (1980: 185–186) mentioned ‘collusion’ between separate governmental units as a potential counterweight to fiscal decentralisation. This ‘collusion thesis’ was taken up by Grossmann (1989) and Grossmann/West (1994). More generally, Jonathan Rod- den (2003) has argued that the ‘nature’ of fiscal decentralisation is hugely important.
When decentralisation of the spending authority is not accompanied by respective de- centralisation of the revenue authority, but funded through revenue-sharing and inter- governmental grant schemes, the overall impact on spending is more likely to increase than decrease. While public choice scholars (Grossmann, Brennan and Buchanan) sus- pect ‘collusion’ of government units, Rodden points to the collective action problem underlying this constellation. When increased demand for spending at the local level is not funded from its own sources, but through intergovernmental grants, decentralisa- tion does in fact aggravate the problem by multiplying the number of individual ac- tors involved. What is more, in systems in which decision-making at different levels of government is heavily intertwined, it is hard to establish credible ‘no bail-out’ commit- ments at the central level in the face of mounting debt on the part of subnational units
(Rodden/Eskeland 2003: 440–441). In other words, when fiscal decentralisation entails
‘vertical imbalances’ between the delegation of spending and revenue authority, it is not to be expected that this will result in lower spending.
This leads to the discussion of the empirical findings in the literature so far, which remain inconclusive. Most of the earlier studies report a negative association between fiscal decentralisation and public spending (Nelson 1987; Marlow 1988; Grossmann 1989; Grossmann/West 1994; Ebel/Yilmaz 2004), but others warn of preliminary con- clusions and find no robust effect of fiscal decentralisation on spending (Oates 1985;
Zax 1989; Anderson 1998; Kirchgässner 2001). The fact that decentralised systems with a high degree of vertical imbalance between delegated spending and revenue authority spend more emerges as one of the few robust findings (Grossmann 1989; Grossmann/
West 1994; Stein 1999; Jin/Zou 2001; Rodden 2003). Scholars have also studied the as- sociation between fiscal decentralisation and economic growth and development (Da- voodi/Zou 1998; Feld/Kirchgässner/Schaltegger 2005), governance (De Mello/Baren- stein 2001) and social capital (De Mello 2004), with tentative results at best. Treisman (2000a) and Wibbels (2000) show that decentralised systems have a harder time adapt- ing to macroeconomic changes and establishing coherent macroeconomic policies.
What are the ‘blind spots’ in the state of the debate on fiscal decentralisation and spend- ing? Firstly, a sound theoretical concept of a positive relationship between fiscal de- centralisation and spending is missing. Rodden’s and Grossmann’s contribution ema- nate from a public choice perspective, assuming self-interested politicians and voters.
A model capturing the association between decentralisation and spending could also take the Oates argument as its point of departure. According to this approach, higher spending can actually reflect preferences for higher spending and not externalities of the actions of purely self-interested political actors. Secondly, instead of focussing on total public spending only, we look at different types of spending, which vary in terms of their policy-field specific degree of fiscal decentralisation (cf. OECD 2003: 146; World Bank 2004). Accordingly, general fiscal decentralisation should have a different impact on spending types as well.
3 A model of local competition in the provision of regional public goods The argument
The political science and economic literature on the relationship between public spend- ing and decentralisation suffers from one major deficiency: it relies on aggregate data of total spending and thus fails to recognise that the distribution of spending across dif- ferent levels of government varies strongly. But what is the impact of fiscal decentrali-
sation on different types of spending, given that these types vary with regard to their distribution across levels of government?
In a certain sense, using aggregate data is a useful approach and the present paper will not break with it completely. The basic structure of the argument underlying conven- tional theories of fiscal decentralisation is that the institutional structure of a given pol- ity has an impact on the total level of spending in this polity because institutions shape actors’ preferences and actions at the lower levels of decision-making, so that there is a discernible effect on spending at the aggregate level. However, this argument neglects the fact that there are not one, but two dimensions of variation which might signifi- cantly alter the implications of the assumed relationship between fiscal decentralisation and spending.
First, competencies for different types of spending are distributed unequally across lev- els of government. Some spending programmes are regulated by national legislation, resulting in uniform standards of distribution and uniform eligibility criteria. For ex- ample, pension policies are usually regulated at the national level. The contribution rate, the pension formula, the level of benefits and the retirement age are examples of policy parameters that are the same for the whole population in a given polity.2 We will there- fore refer to these as national public goods (NPGs) from hereon, which, for the sake of simplicity, are defined as those spending items or programmes where the spending authority lies with national institutions.3 Social insurance schemes are good examples of NPGs, because they entail large sunk costs and need a large number of participating individuals in order to function.4
In contrast, some policies are localised further down the ladder of levels of government.
In the present paper, education policy and spending will be utilised as an example of a regional public good (RPG). In contrast to NPGs, RPGs are usually provided by locali- ties or regional governmental bodies, and there is a greater variety in terms of quality and general levels of spending. Therefore, RPGs can be defined as those spending items or programmes where the spending authority lies with the local or regional level of government. In reality, almost every spending programme will entail some degree of interdependence between different levels of government. Therefore, in the definition 2 Some pension policy regimes retain different social insurance institutions, depending on the oc- cupation. Nevertheless, even if policy parameters vary slightly across different occupations, the rules are set at the national level so that they are uniform for all persons in a given occupation and living in the given polity. There is usually no leeway for different settings of policy param- eters across different territories.
3 The term ‘public good’ is not used here in the purely economic sense (non-excludability in con- sumption). Instead, it captures policies, spending programmes or other government action.
4 Theoretically, the optimal size for social insurance schemes can be smaller (or larger) than the nation state. This is most obvious in the case of public health insurance, where occupational social insurance schemes can help with the exclusion of ‘expensive risks’. In practice, the size of social insurance schemes is an empirical issue and, in the case of pension policies, all OECD countries under study here have nationalised systems.
of NPGs and RPGs, the decisive characteristic is whether a certain type of spending is more tilted towards the local/regional level or the national level. For instance, when comparing the cases of education and pension policies, it becomes clear that the vari- ation in the provision of education policies (quality of teaching, infrastructure, build- ings, teacher wages) is usually greater than in the case of pension policies, where policy parameters are uniform, or dependent on occupation at most.
However, and this is the second dimension of variation alluded to above, the degree of variation in the provision of RPGs varies between countries. Some countries strive for uniform standards in the provision of education policy across the nation, whereas oth- ers allow greater variety and more autonomy at lower levels of government. The core argument of the present paper is that part of the variation along this second dimension is captured by the variable ‘fiscal decentralisation’. Because fiscal decentralisation cap- tures features of the system of public finance, the effects of fiscal decentralisation will be traced on the ‘output’ side of the public finance system, i.e. spending. So, in a nutshell, the research question is: Given that different types of spending are distributed differ- ently across levels of government, what is the impact of differences in the distribution of fiscal autonomy on the revenue side on the dynamics of these types of spending?
Besides considerations of public spending, it is possible to think of other factors that vary across countries. For example, some countries may pursue policies of administra- tive decentralisation like strengthening the decision-making autonomy of local educa- tional institutions without delegating respective fiscal autonomy to these institutions.
More importantly, the relative degree of decentralisation per spending type might differ between countries. In the USA, for example, the setting of policy parameters for the unemployment insurance scheme is largely left to the individual states, whereas it is in the hands of the national administration in most other countries.
To study the impact of fiscal decentralisation on different types of spending, I have therefore selected spending types for which it can be assumed that the assignment of responsibilities to different levels of government will be roughly similar in different sys- tems. Even in centralised systems, the provision of education policy is delegated to local and regional bodies. And, even in decentralised systems, the design and implementa- tion of pension policies is left to national bodies. Without taking into account interven- ing variables, data for OECD countries from the World Bank Fiscal Decentralisation In- dicators Dataset (based on the Government Finance Statistics [GFS] dataset) shows that the share of education spending in subnational expenditures (20.8 per cent) is greater than the share of spending on health (13.8 per cent) and social security (14.7 per cent).
This ordering remains intact when the general share of subnational spending (of total expenditures) is taken into account.5 In the empirical section, I will look at the impact of fiscal decentralisation on a variety of spending types, including education, pension, health, general social expenditure and general public expenditure.
5 The dataset can be found at <www1.worldbank.org/publicsector/decentralization/Indicators.xls>.
To sum up, to study the impact of fiscal decentralisation on spending, we should look at two dimensions of variation: the degree of fiscal decentralisation (variation across countries) and differences in the distribution of spending across levels of government (variation across spending types).
Table 1 summarises the expected impact of fiscal decentralisation on public spending, depending on the regime type and the type of the public good in question. In the fol- lowing, I will briefly comment on each of the cells. However, it is important to empha- sise that the main contribution of this paper lies in achieving a better understanding of the ‘race to the top’ (bottom left cell in Table 1).
With regard to national public goods, there is an extensive literature on the impact on public spending of state structure (Huber/Ragin/Stephens 1993; Huber/Stephens 2001), veto points (Immergut 1992; Schmidt 2002) and federalism (Leibfried/Castles/Obinger 2005). These studies generally find that a centralisation of decision-making compe- tencies is associated with higher levels of public spending (Cameron 1978), whereas a strong constitutive veto structure accompanies a smaller public sector. This is in line with the general implications of the public choice theories that are in the tradition of Brennan and Buchanan. In contrast to public choice theory, the relevant political sci- ence literature emphasises the impact of power struggles between political elites from different levels of government and changes in the political environment associated with centralisation of authority.
Of course, fiscal decentralisation is not the same as veto points or federalism. In fact, as I will argue below, federalism and fiscal decentralisation are not necessary correlates of each other. However, the general gist of the argument about veto points and public spending can also be applied to fiscal decentralisation. The small, but important differ- ence is that for the present paper we distinguish between NPGs and RPGs.
In a decentralised public finance system, localities have more authority to raise rev- enue and to take decisions on spending. Assuming that voters’ willingness to pay has some natural upper limit, tax revenue and the provision of public goods has to be split across different levels of government. In a decentralised system, the expansive provision of public goods at the local level leads to ‘local policy pre-emption’ (Leibfried/Castles/
Obinger 2005: 323), effectively attenuating the demand for nationally provided public goods. In addition, local governments exert their ‘veto power’ and try to slow down the establishment of fiscal authority at the national level (Leibfried/Castles/Obinger 2005:
Table 1 The impact of fiscal decentralisation on spending
Decentralized systems Centralized systems National public goods Local policy pre-emption Expansionary effect
Regional public goods Race to the top Indeterminate
318–319). The cases of Canada, the USA and Switzerland are picture book examples of this mechanism, and the Canadian Provinces, US States and Swiss Cantons have retained an outstanding degree of fiscal autonomy until today (Rodden 2003: 717). A high degree of centralisation of authority in the hands of the national government, in contrast, facilitates lobbying efforts by interest organisations such as trade unions be- cause they can realise economies of scale, since they do not have to lobby a multiplicity of local governments for spending increases, but can concentrate on the national deci- sion-making bodies (Cameron 1978). In the period of welfare state construction, these lobbying efforts were generally directed at the expansion of the public sector and thus resulted in higher spending in centralised systems.6
In sum, the impact of decentralisation on spending at the national level is relatively well understood. What is less well understood is the impact of fiscal decentralisation on the provision of RPGs – more so because the empirical work on fiscal decentralisation has so far largely neglected the fact that some types of spending are more in the hands of local and regional governments than others. But, obviously, it makes a huge difference if we look at the impact of fiscal decentralisation on total spending or if we look at spending on RPGs for which the entity that enjoys greater fiscal autonomy has a higher responsibility.
The ‘competition thesis’ (see above, section 2) emphasises the increased level of compe- tition between localities in the case of decentralisation, while the ‘decentralisation thesis’
stresses the enhanced possibilities for differentiated provision of public good bundles.
In what follows, the core ideas of these theories will be used to show that – with a slight modification of the underlying assumptions about voter behaviour – decentralisation will contribute to a ‘race to the top’ instead of a ‘race to the bottom’.
At first, we will approach the problem from the perspective of the voter. Some economic theories implicitly or explicitly (see Kirchgässner 2001 for an example) assume voters care mostly, or even solely, about lower tax rates and/or lower spending.7 From this perspective, increases in public spending result directly in welfare losses for the private individual, because taxation amounts to expropriation and thus limits the individual’s discretionary power over her property. This idea has its roots in the libertarian school of thought, of which Brennan’s and Buchanan’s Leviathan theory is one example.
6 In the era of welfare state retrenchment and the ‘new politics’ of the welfare state (Pierson 2001), scholars have pointed out that a strong veto structure can actually have the opposite effect (Hu- ber/Stephens 2001; Siegel 2002; Leibfried/Castles/Obinger 2005). Because a high density of veto points generally slows down policy change, so the argument goes, it slows down welfare state retrenchment as well. From this perspective, public sector retrenchment proceeds further and more forcefully in highly centralised states, just as welfare state expansion proceeded faster.
7 In economic terms, the assumption is that voters have lexicographic preferences for lower taxes/
spending.
It is also possible (and maybe more realistic) to assume, however, that voters face a trade- off between welfare losses due to higher taxation and welfare gains due to the increased provision of public goods. Voters seek to minimise the difference between their demand for a given amount of a public good and the price they have to pay for it in the form of taxes. Thus, voters are not looking for the lowest tax rates, but the best combination of a public good and its tax price, given their intrinsic demand for a certain amount of the public good (Tiebout 1956: 418).
Let us now move to the perspective of the local or regional decision-maker. In a de- centralised setting, each local community offers a certain combination of the public good and its price in the form of taxes (Tiebout 1956). ‘Citizen mangers’ organise the community and react to the demands of the ‘consumer-voters’ (Tiebout 1956: 419). In an ideal Tiebout world, consumer-voters sort themselves into the communities which provide the desired combination of public goods and the respective tax price. In a Bren- nan/Buchanan world, decentralisation leads to a race to the bottom in tax rates and public spending/public good provision. However, if voters care not only about tax rates but also about public goods, we will find a multitude of local or regional communities with different levels of taxation and spending. But, as Oates (1985) has argued, whether this increase in the diversity of public good provision actually leads to higher overall spending levels is an open question. For Oates, decentralisation leads to a greater variety in the provision of public goods (and is therefore welfare-enhancing), but it may well be that preferences for spending above and below the national (centralised) average ‘cancel each other out’, so that on aggregate there is no discernible effect of decentralisation on spending.
At this point, my argument goes one step further: I argue that competition between localities to attract consumer-voters is fierce. In this, the competition thesis is right.
Where it goes awry is the assumption that communities compete solely at the level of taxes.
While it might be true that communities try to attract business through lower capital or corporate tax rates, competencies for the taxation of mobile production factors have moved up the ladder of levels of government, with the result that corporate tax compe- tition takes place between nations and not between communities.8 Therefore, commu- nities mainly compete for consumer-voters (citizens). On the margin, citizen managers have an incentive to attract consumer-voters to spread the costs of providing a given public good over a larger number of taxpayers. The crucial point is that this competi- tion is not fought on the basis of tax rates, but is primarily driven by the combination of a public good and its tax price (or even by the levels of public goods provided alone).
This is because, even in a decentralised system like the Swedish one, a complex web of
8 The US system is an exception in granting federal states far-reaching powers to establish differ- ent taxation regimes. The German system of trade taxes (Gewerbesteuer), which operates at the local level, is another exception.
intergovernmental fiscal relations exists and the leeway for tax competition is limited.9 Furthermore, for the consumer-voters, the relatively abstract benefit of a slightly lower tax rate stands against the concrete benefit of being able to consume certain public goods. The means of competition between subnational units are not (only) lower tax rates, but better schools, better hospitals, nicer swimming pools, a safer neighbourhood, etc.
In sum, we assume, firstly, that consumer-voters (citizens) care at least equally about the provision of certain RPGs and the tax rate and, secondly, that citizen mangers are engaged in competition with other localities for consumer-voters. Then, citizen manag- ers can try to attract consumer-voters by increasing the provision of RPGs. This mecha- nism has a reinforcing quality, because the more the citizen manager increases public spending, the stronger is the incentive to attract more consumer-voters to spread the costs. The empirically observable outcome of such a ‘race to the top’ at the local level is increased levels of spending on RPGs in decentralised systems.
Finally, I will comment on the expected impact of centralisation on the provision of RPGs (the last, bottom right cell in Table 1). Here, the distinction between different notions of fiscal decentralisation is crucial. In section 2, I mentioned the problems of defining and measuring fiscal decentralisation that have been discussed in the relevant literature. One, if not the most crucial, question discussed is whether to measure fiscal decentralisation in terms of revenue or spending authority. Rodden (2003) has shown that the delegation of spending autonomy alone leads to increased spending because lower levels of government have an incentive to free-ride. Volden (2005) has argued that when different levels of government are jointly responsible for the provision of a given public good, the resulting ‘horizontal’ competition will lead to overspending.
Thus, when fiscal centralisation is defined in terms of revenue autonomy (as it is in this paper), it is still possible that national governments will delegate spending authorities to lower levels of government, possibly resulting in overspending (the Rodden mecha- nism). However, when national-level governments retain a high level of revenue and spending authority, it can be expected that local levels of government will be deprived of competencies, which results in lower spending on RPGs (merely because there are less of them).
The model of local competition in the provision of RPGs presented in this paper is com- patible with these approaches, but goes further. First, when Rodden (2003: 704–707) develops his argument about why a high degree of fiscal imbalance (strong reliance on intergovernmental grants instead of ‘own source’ revenue for subnational government expenditure) is associated with higher public spending, he seems to assume that subna-
9 In Sweden, the personal income tax is the most important county and local tax. And while there is evidence of tax competition, it is limited to a certain range of tax rates (among municipalities:
15.4 to 22.8 per cent; among counties: 9.13 to 10.71 per cent) (OECD 1999: 70).
tional governments have an interest in higher spending per se. This is largely a remnant of thinking along the lines of public choice theory. My argument about local competi- tion provides a more fine-grained and more political rationale for why it is that local governments want to increase spending: because citizen managers face competition for consumer-voters from other localities.
Second, and more importantly, the empirical section of this paper will show that the logic of a local ‘race to the top’ holds even when fiscal decentralisation is measured in terms of revenue autonomy. In this instance, Rodden (2003: 713) still finds a negative as- sociation between spending and decentralisation, but this, as my argument goes, is also due to the fact that he looks at total spending and not spending on RPGs.
Additions and limitations of the model: The demand for public goods as a function of the dominant level of decision-making
John Wallis (quoted indirectly and without specific reference in Oates [1985: 749]) sees a relationship between the voters’ willingness to pay taxes and the most important level of decision-making:
He [John Wallis] contends that since individuals have more control over public decisions at the local than at the state or national level, they will wish to empower the public sector with a wider range of functions and responsibilities where these activities are carried out at more localized levels of government. (Oates 1985: 749)
From this perspective, a more decentralised system fosters closer connections between the voters and their local politician. The principal-agent problem between voter and politician is allayed because, at the local level, voters have enhanced monitoring ca- pabilities. They also have certain sanctioning mechanisms at their disposal: not only local elections, first of all, but also social pressure through personal contacts. Improved monitoring and sanctioning capabilities (a higher level of social trust) lead to reduced scope for politicians to engage in rent-seeking behaviour. As a consequence, voters will be willing to pay more taxes because they can make sure that the money is not misused by politicians and that they have a more direct impact on the types of public goods to be acquired.
The relevance of the Wallis argument is difficult to assess, not least because it requires
‘hefty assumptions about the quality of the local democratic process and the informa- tion available to voters’ (Rodden 2003: 701). After all, the delegation of decision-mak- ing powers to the local level could also lead to higher levels of corruption because of increased opportunities for obfuscation. However, this argument should be more im- portant in systems with a high degree of fiscal imbalance, where local voters do not have any influence on local revenue decisions, but spending autonomy is delegated to the lower levels. The empirical evidence for a relationship between federalism (the closest
‘relative’ to fiscal decentralisation in this literature) and corruption is weak (Treisman 2000b; Serra 2006: 249).
Another strand of literature talks about the relationship between levels of social capi- tal/social trust and public spending/the universal welfare state (Rothstein 1998, 2001, 2003). The general causal direction of the argument runs from public spending to social capital, i.e. a large welfare state contributes to the growth of social trust and thus helps to strengthen its own foundations. If we only look at the second part of this feedback process, it is possible to argue that high levels of social trust, encouraged by a high degree of fiscal decentralisation, lead to increased public spending because of the elec- torate’s higher willingness to pay. The analysis of such a claim, however, lies beyond the scope of this paper. The only consolation is that if the Wallis mechanism were relevant it would strengthen the general argument of the ‘local race to the top’, because citizens have even stronger preferences for the provision of RPGs.
4 Empirics Hypotheses
The most important hypothesis to be tested is whether spending on RPGs is higher in states with a high degree of fiscal decentralisation. However, the model entails a dy- namic component because it makes an argument about competition. In other words, we should also expect higher spending increases for RPGs in fiscally decentralised coun- tries. From a certain perspective, cross-country differences are merely differences in dynamics observed at a certain point in time. If competition in the provision of RPGs is at work, we should find different dynamics at work as well as different levels of spend- ing in a cross-section of countries.
Education spending is chosen as an example of a RPG because it is about the only type of spending that meets two important criteria: first, internationally comparable data should be available (from the OECD Education at a Glance database) and, second, it can be assumed that, relative to other types of spending, education spending will be more concentrated on lower levels of government. 10
10 Ideally, it would be useful to show that education spending is really confined to the local level in countries with fiscal decentralisation. Unfortunately, there are few data sources that provide internationally comparable data on the distribution of spending across levels of government.
From the IMF Government Finance Statistics, it is possible to construct a rough picture of the distribution of types of spending across levels of government (OECD 2003: 146 and <www1.
worldbank.org/publicsector/decentralization/Indicators.xls>). Some countries (Canada, USA, Germany, France, Norway, UK) fit the expectation (high/low degree of fiscal decentralisation accompanies high/low share of education and health expenditure in total local expenditure),
In addition, it will also be tested whether fiscal decentralisation leads to lower spending on NPGs (the counter hypothesis to the first one). Public pension spending (from the OECD Social Expenditure database) is used as the prime example of a NPG but, because of better data availability, other types of spending will also be looked at (public social spending and health spending). The impact of fiscal decentralisation on total public spending will also be tested to make the results obtained here comparable to other studies.
Data and methods
The empirical test of the model outlined in section 3 uses pooled time series data on 21 OECD countries for the period 1980 to 2001.11 Due to data limitations, the period of observation has been shortened to 1991 to 2001 both for spending on primary and secondary education and for spending on higher education. Sources and definitions of variables are provided in the appendix.
The dependent variables in the present analysis are different types of public spending.
Fisher stationarity tests indicate that non-stationarity is a greater problem for some types of spending (i.e. social spending) than for others (i.e. education spending).12 Consequently, the model will be tested using a variety of model specifications to ensure the robustness of the findings. The types of spending that are analysed are: total pub- lic education spending, spending on primary and secondary education, spending on tertiary education, total public social spending, public spending on health care, public spending on pensions, and total public spending. All spending data is initially defined in percentages of GDP.
The most important independent variable is, of course, fiscal decentralisation. Much of the empirical discussion in the literature referred to in section 2 centres on the measure- ment of fiscal decentralisation. Early studies use spending shares of subnational gov- ernmental units to measure fiscal decentralisation. However, this neglects the fact that spending might be mandated by higher levels of government or funded through grants instead of own revenues. Most international comparisons rely on the Governmental
while others (Denmark) do not. However, data availability is very limited and confounding factors blur the picture of the connection between fiscal decentralisation and local education expenditure. In addition, our theoretical model does not only predict higher local expenditure, but also higher total expenditure in certain categories of expenditure.
11 The countries are: Australia, Austria, Belgium, Canada, Denmark, Finland, France, Germany, Greece, Ireland, Italy, Japan, Netherlands, New Zealand, Norway, Portugal, Spain, Sweden, Swit- zerland, UK, USA.
12 On the basis of Fisher tests for stationarity in panel data (using the xtfisher command in Stata), it was possible to reject the null hypothesis of non-stationarity with a high level of statistical confidence for education spending, but with a lower level of statistical confidence for social spending and total public spending.
Finance Statistics provided by the IMF, which does not account for the aforementioned problems and therefore tends to ‘overestimate’ the degree of decentralisation (Ebel/Yil- maz 2004).13 This fact has led to repeated calls for better measures of fiscal decentrali- sation (Nelson 1987; Rodden 2003: 709; Feld/Kirchgässner/Schaltegger 2005: 6). First of all, it is apparent that it is inadequate to measure fiscal decentralisation as spending shares of lower levels of government without taking revenue autonomy into account (Rodden 2003: 709–710). Secondly, the commonly used Government Finance Statistics provided by the IMF is criticised because of the sketchiness of its classification of ‘own source’ revenue (Ebel/Yilmaz 2004: 6; Rodden 2003: 709) along with its misclassifica- tion of countries (Stegarescu 2004: Fn 15, 46).14
The measure of choice for this analysis is given by Stegarescu (2004), who presents a measure of ‘own tax revenue’ of ‘sub-central governments’ (Stegarescu 2004: 6, 28).15 The focus of this measure is on the revenue side (ibid.: 5), since it is reasonable to as- sume that subnational governments with revenue autonomy have spending autonomy as well (which does not hold vice versa). The correlation between the Stegarescu indi- cator and the common spending-share based GFS indicator is relatively strong (about 0.8), suggesting that both indicators measure similar, if not the same, things. Stegarescu (2004: 7) presents a typology of different degrees of revenue autonomy, depending on whether the subnational government can determine the tax rate and base, whether it can retain the revenue or whether it has to share this with higher levels of government.
The specific measure in the present analysis is the subnational government’s own tax revenue (as a share of general government revenue), in which the subnational unit can at least set the tax rate or the tax base autonomously and does not have to share the revenue obtained (ibid.: 28).
In this context it is important to note that fiscal decentralisation is different from po- litical decentralisation: federal countries do not necessarily have higher degrees of fis- cal decentralisation. As Stegarescu (2004: 9–11) and others have shown (Braun 2000), some federal states like Germany and Austria have complex systems of intergovernmen- tal redistribution and thus a low degree of fiscal decentralisation, while some unitarian countries (Scandinavian countries, Netherlands, UK) grant a high degree of autonomy to the local level.
13 Even the IMF category of ‘own source’ revenue does not capture the full effect of tax autonomy, because it does not account for revenue-sharing schemes or central regulation of tax rates and bases (Rodden 2003: 709).
14 According to Stegarescu (2004: Fn 15, 46), GFS data classifies the expenditure of Belgian regions and communities as central government expenditure, which underestimates the degree of fiscal decentralisation after 1989.
15 This term covers localities in unitary states and regions/states plus localities in federal states: ‘In the case of federal states where local taxes or regional/local revenue-sharing are determined by regional or state governments, these are classified as autonomous taxes, since we now focus on the degree of fiscal autonomy vis-à-vis the central government. In doing so, local governments are treated as an integral part of the intermediate level of government.’ (Stegarescu 2004: 7)
The statistical models presented below also include some control variables.16 Firstly, the level of economic development of a country (measured by GDP per capita) is included.
The expectation is that spending levels will rise with increasing levels of economic development (Wagner’s law). Secondly, we control for the demographic demand for spending by adding the ratio of the population share of those aged 65 and above to those aged 5 to 29. The expectations of the direction of the impact of the demographic variable vary in accordance with the type of spending analysed. For education spend- ing, a higher ratio of the elderly to the young is expected to have a negative effect. For the other types of spending, we expect a positive association because a greater share of the elderly in the voting population will increase demand for health care and pension spending. Thirdly, when analysing different subcategories of public spending, it is im- portant to control for the size of the welfare state and the public sector in general. States with a large public sector will exhibit higher spending levels in different subcategories as well, because of intrinsic cross-country differences in the division of labour between the state and markets in the provision of (semi-)public goods.17 Fourthly, a measure of the veto player density of political institutions is included. This controls for that part of the restraining impact of the constitutional veto structure that is unrelated to fiscal decentralisation (Leibfried/Castles/Obinger 2005). Fifthly, the level of spending from the previous year is included as an independent variable to control for autocorrelation.
It also shows that spending converges on a long-term average (in the first-differences specifications) and that current spending levels are positively associated with last year’s levels (in the levels specifications, respectively).
As indicated above, the basis for this analysis is a pooled data set of 21 OECD countries from 1980 to 2001. The method of choice is pooled time series analysis, using panel- corrected standard errors (PCSE) as advised by Beck and Katz (1995, 1996). Recent discussions in the field allude to the difficulties of including country (unit) fixed effects in the model when the researcher is equally interested in the impact of variables that are largely time-invariant (Kittel/Winner 2005; Plümper/Troeger/Manow 2005). On the one hand, the inclusion of country fixed effects eliminates cross-sectional variation that is invariant over time, thus transforming the model from a ‘pooled’ or a ‘between effects’
model to one which captures over-time variation only (‘within estimator’). Independ- ent variables that are largely time-invariant (for example, political institutions) tend to be absorbed by the country fixed effects (Plümper/Troeger/Manow 2005: 331–332).
On the other hand, abstaining from using a fixed-effects specification entails the risk of omitted variable bias and biased conclusions, because variance in the dependent vari- able (levels of spending) is explained by variance in the independent variables within 16 The vast literature on the determinants of spending has identified a large number of potential determinants. To keep the analysis parsimonious and to concentrate on the original contribu- tion of this paper, we abstain from a full discussion of the various theories of the determinants of spending.
17 By including social or total public spending in the regression equations, it is ensured that the fiscal decentralisation variable does not capture differences in welfare state arrangements that are in turn related to decentralisation (prevention of omitted variable bias).
the period of analysis, although the dependent variable captures differences that existed prior to the period under observation (Plümper/Troeger/Manow 2005: 332). The use of a dynamic specification with changes in spending as the dependent variable circum- vents many of these problems (cf. Kittel/Winner 2005: 278–283).
Still, it has to be decided whether to use a fixed-effects specification or not. This ques- tion is important, because the central explanatory variable – fiscal decentralisation/sub- national tax autonomy – is largely invariant over time (cf. Stegarescu 2004: 17). Plümper and Troeger (2004) offer a way out of the dilemma: they propose a vector decomposi- tion procedure that allows the estimation of the impact of time-invariant variables in a fixed-effects setting. The Plümper/Troeger approach is chosen as the preferred estima- tion technique. The variables ‘GDP per capita’, ‘veto index’, and ‘fiscal decentralisation’
were treated as largely time-invariant variables. Alternative model specifications using more conventional estimation techniques were used to test the robustness of the find- ings (see below).
To estimate the impact of the different independent variables, two general specifications were used.18 The first one is a specification using levels of spending in the independent and dependent variables. The second specification is an error-correction model (ECM) as applied by Iversen and Cusack (2000) and Kaufman/Segura-Ubiergo (2001), among others. The strength of this model is that it allows long-term effects to be separated from short-term effects of independent variables.19 The dependent variables are given in changes (first differences) in this specification.
Finally, all variables have been z-transformed before estimating the models to allow a comparison of the relative impact of fiscal decentralisation on different types of spend- ing. The downside of this transformation is that coefficient estimates are not interpret- able directly.
18 The use of multiple model specifications serves two purposes. Firstly, it shows the robustness of the findings. Secondly, the model of public good competition is taken seriously with respect to both its prediction on differences in spending levels between countries and its prediction on differences in the dynamics of spending. However, it should be borne in mind that the model specification in levels includes a lagged dependent variable. Therefore, the coefficients of the independent variables capture more ‘within’ than ‘between’ variation. Given the econometric constraints, a ‘pure’ level specification is not feasible in a pooled time-series framework.
19 Independent variables enter the model as levels and changes. The coefficient estimates of levels of independent variables capture the long-term ‘equilibrium’ relationship between this variable and the dependent variable. The coefficient estimates of changes of independent variables cap- ture the short-term effects. The coefficient of the lagged level of the dependent variable should be between 0 and –1 ‘to ensure that the incremental effects of a shock to any exogenous variable are progressively reduced over time, causing spending to converge to a long-term equilibrium’
(Iversen/Cusack 2000: 330).
Findings
Table 2 contains the results for different types of education spending.20 The control variables largely behave as expected:21 the ratio between the elderly and the young is 20 The coefficient ‘eta’ is a ‘leftover’ from the second stage of the three-stage procedure of vector decomposition (Plümper/Troeger 2004: 9) and can be ignored for the purpose of this analysis.
21 In addition to the control variables discussed above, several other variables discussed in the literature have been tested for statistical significance. Public debt levels, current fiscal balances, GDP growth, unemployment and inflation have been included to test for the impact of current economic problem pressure on spending. It could be argued that some types of spending (e.g.
Table 2 The impact of fiscal decentralisation on education spending
(1) (2) (3) (4)
Dependent variable Public education spending (% of GDP)
Public spending on primary and second- ary education
(% of GDP)
Public spending on tertiary
education (% of GDP)
Public spending on primary and secondary educa- tion per student Public education
spending (lagged level)
0.468 (7.87)**
Public spending on primary and secondary education (lagged level)
0.299 (2.56)*
Primary spending on tertiary education (lagged level)
0.137 (0.72)
Public spending on primary and secondary education per student (lagged level)
0.267 (3.25)**
Age ratio −0.207 −0.013 0.188 0.252
(4.81)** (0.20) (2.03)* (8.20)**
Public social spending 0.410 0.265 −0.266 0.046
(6.38)** (2.54)* (1.59) (1.14)
GDP per capita −0.033 0.096 0.267 0.534
(1.27) (2.32)* (5.61)** (17.67)**
Veto index −0.092 −0.194 0.322 −0.120
(4.23)** (4.21)** (6.02)** (6.19)**
Fiscal decentralisation 0.271 0.183 0.280 0.134
(13.15)** (5.80)** (6.57)** (6.48)**
Eta 1.000 1.000 1.000 1.000
(15.05)** (14.53)** (14.41)** (22.97)**
Constant −0.000 −0.121 −0.208 −0.381
(0.01) (2.34)* (2.42)* (10.04)**
Observations 412 186 187 186
R-squared 0.86 0.88 0.80 0.96
t statistics in parentheses.
* significant at 5%; ** significant at 1%.
All variables have been z-transformed prior to the regression estimation. The coefficient ‘eta’ is a ‘leftover’
from the second stage of the three-stage procedure of vector decomposition (Plümper/Troeger 2004: 9) and can be ignored for the purpose of this analysis.
negatively associated with public spending on education (which is in line with Buse- meyer 2006, 2007). Interestingly, the age ratio is positively associated with public spend- ing on tertiary education, indicating that a high population share of the elderly can be a concomitant of large-scale public expenditure on higher education. Public social spending has a positive impact on education spending, which exhibits the strong rela- tion between a country’s commitment to the public provision of education services and its general welfare state arrangement. GDP per capita, the indicator of economic development, is positively associated with most spending categories, confirming Wag- ner’s law. The veto index is negatively associated with all types of education spending, suggesting that a strong veto structure is detrimental to high levels of public spending in general, and education spending in particular (see also Busemeyer 2006, 2007).
Most importantly, the indicator of fiscal decentralisation is significantly and positively associated with education spending. This finding can be interpreted as evidence of local competition following the logic of a ‘race to the top’, because education spending is – to a varying degree – delegated to lower levels of government and the positive coefficient shows that the provision of RPGs is greater in countries with higher degrees of fiscal decentralisation. In comparison to the other coefficients, the estimate of the fiscal de- centralisation indicator in model 1 is quite large: the impact of a change of one standard deviation in fiscal decentralisation is greater than the impact of a similar change in the economic well-being or the demographic composition in a given country.
The impact of fiscal decentralisation on higher education spending (model 3) is even greater than the impact on total education spending, whereas the impact on primary and secondary education spending is smaller (model 2). This is somewhat surprising because it could have been expected that primary and secondary education would be influenced more by fiscal decentralisation since this type of education tends to be less centralised than higher education. One possible explanation is that opportunities for differentiation in the quality of provision are fewer in the case of primary and second- ary education than in the case of higher education spending. Opportunities for improv- ing school fittings are naturally limited (unless policy-makers would want to furnish every school with marble and mahogany) and circumscribed by translocal standards.
Universities and other higher education institutions, in contrast, can differ greatly in terms of resource endowment, research specialisation or equipment availability. How- ever, the opportunity to visit a specific university is less dependent on residential choice than the opportunity to visit a specific school. In sum, fiscal decentralisation has a posi- tive impact on education spending, whether one looks at total, sectoral or per student expenditure (model 4).
education spending) are more vulnerable to cutbacks in times of hardship than others (e.g. so- cial spending). While a lot of the variables mentioned here are associated with plausible hypoth- eses and probably have concrete empirical relevance, they could not be identified as significant determinants of spending in the current analysis. A comprehensive discussion of the impact of these variables and the theories behind them is certainly beyond the scope of this paper.
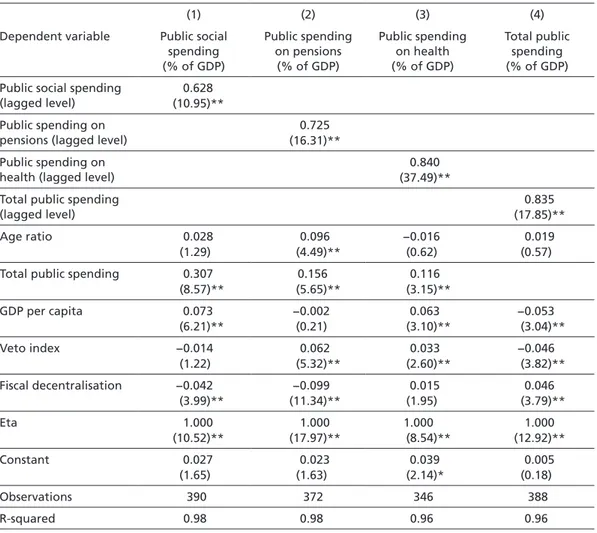
Table 3 presents estimates of the effect of fiscal decentralisation on different types of so- cial spending. Again, the control variables are statistically significant and behave as ex- pected: the demographic variable changes signs because social spending is expected to rise with a higher population share of the elderly. The size of the public sector and GDP per capita continue to be positively associated with changes in spending. The veto index is negatively associated with social spending and total public spending, but positively associated with spending on pension and health care. This can be explained by the fact that a strong constitutional veto structure slows down the expansion of the welfare state and the public sector in general, but autonomous social insurance institutions are often part of this veto structure. Therefore, social spending is biased towards classical social insurance policies, whose expansion is less hindered by this institutional structure.
The indicator of fiscal decentralisation is negatively associated with social spending (model 1). This confirms the above hypothesis that fiscal decentralisation has different effects on different types of spending. In line with this argument is the finding that the
Table 3 The impact of fiscal decentralisation on social and total public spending
(1) (2) (3) (4)
Dependent variable Public social spending (% of GDP)
Public spending on pensions
(% of GDP)
Public spending on health (% of GDP)
Total public spending (% of GDP) Public social spending
(lagged level)
0.628 (10.95)**
Public spending on pensions (lagged level)
0.725 (16.31)**
Public spending on health (lagged level)
0.840 (37.49)**
Total public spending (lagged level)
0.835 (17.85)**
Age ratio 0.028 0.096 −0.016 0.019
(1.29) (4.49)** (0.62) (0.57)
Total public spending 0.307 0.156 0.116
(8.57)** (5.65)** (3.15)**
GDP per capita 0.073 −0.002 0.063 −0.053
(6.21)** (0.21) (3.10)** (3.04)**
Veto index −0.014 0.062 0.033 −0.046
(1.22) (5.32)** (2.60)** (3.82)**
Fiscal decentralisation −0.042 −0.099 0.015 0.046
(3.99)** (11.34)** (1.95) (3.79)**
Eta 1.000 1.000 1.000 1.000
(10.52)** (17.97)** (8.54)** (12.92)**
Constant 0.027 0.023 0.039 0.005
(1.65) (1.63) (2.14)* (0.18)
Observations 390 372 346 388
R-squared 0.98 0.98 0.96 0.96
t statistics in parentheses.
* significant at 5%; ** significant at 1%.
All variables have been z-transformed prior to the regression estimation.
negative impact of fiscal decentralisation on public spending on pensions is even great- er in scale than that on total social spending (model 2). Pension policies are an example of NPGs administered at the national level, provided according to uniform standards and leaving little room for interregional competition. Public spending on health care (model 3) is a different case. In most advanced democracies (with the possible excep- tion of Canada and the USA), the administration and financing of health care is organ- ised at the national level. However, there is room for differentiation at the local level in the form of the quality of health care provided or of hospital outfits (cf. OECD 2003:
146). The positive coefficient of the indicator of fiscal decentralisation in model 3 shows that, in the case of spending on health care, the positively operating fiscal decentralisa- tion effect is stronger than the negatively operating pre-emption effect. In other words, local competition in the provision of public goods increases aggregate spending when localities can act in a fiscally autonomous manner.
The impact of fiscal decentralisation on changes in total public spending (model 4) is positive. This finding is significant as it stands in contrast with previous empirical results. Even the most recent findings by Rodden (2003) indicate a negative associa- tion between spending and fiscal decentralisation when it is appropriately measured in terms of ‘own source’ revenue (Rodden 2003: 713). The present analysis does not sup- port this result. One possible explanation of this finding is that the effects of the local
‘race to the top’ are stronger than the restraining effects of fiscal decentralisation on total public spending, controlling for constitutional veto structure. This argument is plausi- ble because it is reasonable to assume that the restraining effects of the constitutional veto structure are stronger than the restraining effects of fiscal decentralisation alone.
However, further research should clarify the relationship between these two variables.
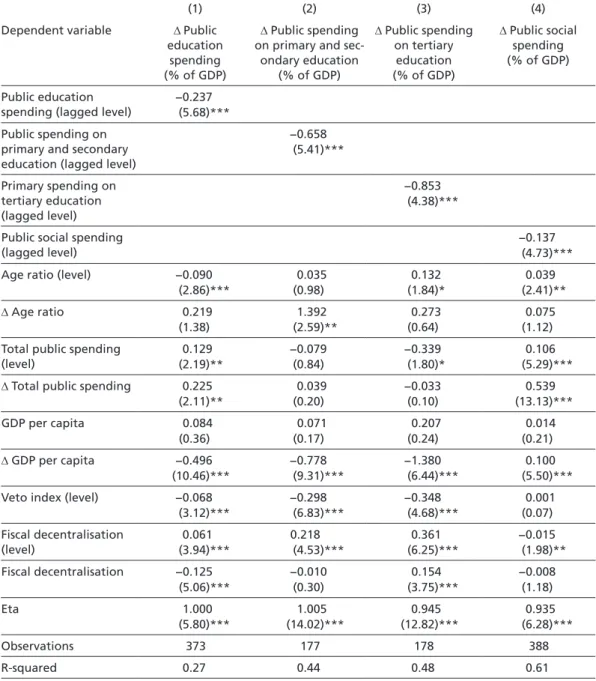
In Table 4, we present the regressions in the form of error-correction models (ECM).
Thus, it is possible to distinguish long-term from short-term effects.22 Generally, fiscal decentralisation exhibits both short and long-term effects (almost all coefficient es- timates are statistically significant at the 1 per cent level). The signs of the estimates confirm the findings from above: fiscal decentralisation has a positive long-term ef- fect on total education spending as well as on public spending on primary/secondary education and higher education. The long-term impact on social spending, however, is negative. In line with the findings from above, the impact of fiscal decentralisation on spending on higher education is the greatest in scale. The only surprising result is the negative coefficient on the change variable of fiscal decentralisation in model 1.
Robustness
Table 5 displays different specifications of model 1 of Table 1. For reasons of space, robustness tests are limited to models using public education spending as dependent 22 In this specification, the dependent variables are given in changes (first differences).