Edited by:
Amos Tiereyangn Kabo-Bah, University of Energy and Natural Resources, Ghana Reviewed by:
Yanhui Wang, Tianjin University, China Shuxin Wang, Tianjin University, China
*Correspondence:
Pierre Testor testor@locean-ipsl.upmc.fr
Specialty section:
This article was submitted to Ocean Observation, a section of the journal Frontiers in Marine Science
Received:31 October 2018 Accepted:05 July 2019 Published:02 October 2019
OceanGliders: A Component of the Integrated GOOS
Pierre Testor1*, Brad de Young2, Daniel L. Rudnick3, Scott Glenn4, Daniel Hayes5, Craig M. Lee6, Charitha Pattiaratchi7, Katherine Hill8, Emma Heslop9, Victor Turpin1, Pekka Alenius10, Carlos Barrera11, John A. Barth12, Nicholas Beaird4, Guislain Bécu13, Anthony Bosse14, François Bourrin15, J. Alexander Brearley16, Yi Chao17, Sue Chen18, Jacopo Chiggiato19, Laurent Coppola20, Richard Crout21, James Cummings18, Beth Curry6, Ruth Curry22, Richard Davis23, Kruti Desai24, Steve DiMarco25, Catherine Edwards26, Sophie Fielding16, Ilker Fer14, Eleanor Frajka-Williams27, Hezi Gildor28, Gustavo Goni29, Dimitri Gutierrez30, Peter Haugan14,31, David Hebert32, Joleen Heiderich33,34, Stephanie Henson27, Karen Heywood35, Patrick Hogan36,
Loïc Houpert27,37, Sik Huh38, Mark E. Inall37, Masso Ishii39, Shin-ichi Ito40, Sachihiko Itoh40, Sen Jan41, Jan Kaiser35, Johannes Karstensen42, Barbara Kirkpatrick43, Jody Klymak44, Josh Kohut4, Gerd Krahmann42, Marjolaine Krug45, Sam McClatchie46, Frédéric Marin47, Elena Mauri48, Avichal Mehra49, Michael P. Meredith16, Thomas Meunier50, Travis Miles4, Julio M. Morell51, Laurent Mortier52, Sarah Nicholson45, Joanne O’Callaghan53,
Diarmuid O’Conchubhair54, Peter Oke55, Enric Pallàs-Sanz50, Matthew Palmer27, JongJin Park56, Leonidas Perivoliotis57, Pierre-Marie Poulain58, Ruth Perry59,
Bastien Queste35, Luc Rainville6, Eric Rehm13, Moninya Roughan60, Nicholas Rome24, Tetjana Ross61, Simon Ruiz62, Grace Saba4, Amandine Schaeffer60, Martha Schönau63, Katrin Schroeder19, Yugo Shimizu63, Bernadette M. Sloyan55, David Smeed27,
Derrick Snowden64, Yumi Song56, Sebastian Swart65,66, Miguel Tenreiro50,
Andrew Thompson67, Joaquin Tintore68, Robert E. Todd34, Cesar Toro69, Hugh Venables16, Taku Wagawa70, Stephanie Waterman71, Roy A. Watlington72and Doug Wilson72
1CNRS-Sorbonne Universités (UPMC Univ. Pierre et Marie Curie, Paris 06)-CNRS-IRD-MNHN, UMR 7159, Laboratoire d’Océanographie et de Climatologie (LOCEAN), Institut Pierre Simon Laplace (IPSL), Observatoire Ecce Terra, Paris, France,
2Department of Physics and Physical Oceanography, Memorial University, Memorial University of Newfoundland, St. John’s, NL, Canada,3Scripps Institution of Oceanography, San Diego, CA, United States,4Department of Marine and Coastal Sciences, Rutgers University, New Brunswick, NJ, United States,5Oceanography Centre, University of Cyprus (OC-UCY), Nicosia, Cyprus,6Applied Physics Laboratory, University of Washington, Seattle, WA, United States,7Oceans Graduate School, The University of Western Australia, Perth, WA, Australia,8World Meteorological Organization, Geneva, Switzerland,
9UNESCO, Paris, France,10Finnish Meteorological Institute, Helsinki, Finland,11Oceanic Platform of the Canary Islands, Telde, Spain,12College of Earth, Ocean, and Atmospheric Sciences, Oregon State University, Corvallis, OR, United States,
13Takuvik, Quebec, QC, Canada,14Geophysical Institute, University of Bergen, Bergen, Norway,15CEFREM, Perpignan, France,16British Antarctic Survey, Cambridge, United Kingdom,17Seatrec, Monrovia, CA, United States,18Naval Research Laboratory, Monterey, CA, United States,19CNR- Institute of Marine Sciences (ISMAR), Venice, Italy,20Laboratoire d’Océanographie de Villefranche (LOV), UMR7093 (Sorbonne Université/CNRS), Institut de la Mer de Villefranche (IMEV), Villefranche-sur-Mer, France,21Naval Research Laboratory, Stennis, MS, United States,22Bermuda Institute of Ocean Sciences, Saint George, Bermuda,23Department of Oceanography, Dalhousie University, Halifax, NS, Canada,
24OceanLeadership, Washington, DC, United States,25Department of Oceanography, Texas A&M University, College Station, TX, United States,26Skidaway Institute of Oceanography, University of Georgia, Athens, GA, United States,
27National Oceanography Centre, Southampton, United Kingdom,28Institute of Earth Sciences, The Hebrew University of Jerusalem, Jerusalem, Israel,29NOAA Atlantic Oceanographic and Meteorological Laboratory, Miami, FL, United States,
30Institute of the Sea of Peru, Callao, Peru,31Institute of Marine Research, Bergen, Norway,32Department of Fisheries and Oceans, Bedford Institute of Oceanography, Dartmouth, NS, Canada,33Massachusetts Institute of Technology, Cambridge, MA, United States,34Woods Hole Oceanographic Institution, Woods Hole, MA, United States,35School of Environmental Sciences, Centre for Ocean and Atmospheric Sciences, University of East Anglia, Norwich, United Kingdom,36United States Naval Research Laboratory, Washington, DC, United States,37Scottish Association for Marine Science, Oban,
United Kingdom,38Korea Institute of Ocean Science and Technology, Ansan-si, South Korea,39Meteorological Research Institute, Tsukuba, Japan,40Atmosphere and Ocean Research Institute, The University of Tokyo, Chiba, Japan,41Institute of Oceanography, National Taiwan University, Taipei, Taiwan,42GEOMAR Helmholtz Center for Ocean Research Kiel, Kiel, Germany,43Gulf of Mexico Coastal Ocean Observing System, College Station, TX, United States
44Ocean Physics Group, University of Victoria, Victoria, BC, Canada,45Council for Scientific and Industrial Research, Cape Town, South Africa,46FishOcean Enterprises, Auckland, New Zealand,47LEGOS/IRD, Toulouse, France,48Istituto Nazionale di Oceanografia e di Geofisica Sperimentale, Trieste, Italy,49NOAA National Centers for Environmental Prediction, College Park, MD, United States,50Ensenada Center for Scientific Research and Higher Education, Ensenada, Mexico,
51Department of Marine Sciences, University of Puerto Rico at Mayagüez, Mayagüez, Puerto Rico,52ENSTA/LOCEAN, Palaiseau, France,53National Institute of Water and Atmospheric Research, Wellington, New Zealand,54Marine Institute, Galway, Ireland,55CSIRO, Oceans and Atmosphere, Hobart, TAS, Australia,56KUGON, Kyungpook, South Korea,57Hellenic Center for Marine Research, Heraklion, Greece,58Centre for Maritime Research and Experimentation, La Spezia, Italy,
59Shell, Houston, TX, United States,60School of Mathematics and Statistics, University of New South Wales, Sydney, NSW, Australia,61Department of Fisheries and Oceans, Institute of Ocean Sciences, Sidney, BC, Canada,62Instituto Mediterráneo de Estudios Avanzados, CSIC-UIB, Esporles, Spain,63Applied Ocean Science, Fairfax Station, VA, United States,64National Oceanic and Atmospheric Administration, Washington DC, United States,65Department of Marine Sciences, University of Gothenburg, Gothenburg, Sweden,66Department of Oceanography, University of Cape Town, Cape Town, South Africa,
67California Institute of Technology, Pasadena, CA, United States,68SOCIB and IMEDEA (CSIC-UIB), Palma de Mallorca, Spain,69IOC-UNESCO, IOCARIBE, Paris, France,70Japan Fisheries Research and Education Agency, Yokohama, Japan,
71Department of Earth, Ocean and Atmospheric Sciences, University of British Columbia, Vancouver, BC, Canada,
72Caribbean Coastal Ocean Observing System, Mayagüez, Puerto Rico
The OceanGliders program started in 2016 to support active coordination and enhancement of global glider activity. OceanGliders contributes to the international efforts of the Global Ocean Observation System (GOOS) for Climate, Ocean Health, and Operational Services. It brings together marine scientists and engineers operating gliders around the world: (1) to observe the long-term physical, biogeochemical, and biological ocean processes and phenomena that are relevant for societal applications; and, (2) to contribute to the GOOS through real-time and delayed mode data dissemination. The OceanGlidersprogram is distributed across national and regional observing systems and significantly contributes to integrated, multi-scale and multi-platform sampling strategies.
OceanGlidersshares best practices, requirements, and scientific knowledge needed for glider operations, data collection and analysis. It also monitors global glider activity and supports the dissemination of glider data through regional and global databases, in real- time and delayed modes, facilitating data access to the wider community.OceanGliders currently supports national, regional and global initiatives to maintain and expand the capabilities and application of gliders to meet key global challenges such as improved measurement of ocean boundary currents, water transformation and storm forecast.
Keywords:in situocean observing systems, gliders, boundary currents, storms, water transformation, ocean data management, autonomous oceanic platforms, GOOS
INTRODUCTION
The ocean is an important component of the global earth system influencing the global/regional climate, weather, ecosystems, living resources and biodiversity. The ocean plays a major role in many human activities including coastal protection, tourism, search and rescue, defense and security, shipping, aquaculture and fisheries, offshore industry and marine renewable energy.
Ocean observation serves to enable us to better understand ocean functions and to meet the societal needs related to these activities. The Intergovernmental Oceanographic Commission (IOC of UNESCO) developed the Global Ocean Observing System (GOOS) more than two decades ago to coordinate the different national efforts in terms of sustained ocean observations throughout the world and to maximize the societal benefits of ocean observations. The GOOS has three observation panels for the development of observing
strategies for climate, biogeochemistry and biology/ecosystems and the Observation Coordination group (OCG) of the World Meteorological Organization (WMO)/Intergovernmental Oceanographic Commission (IOC) Joint Commission on Oceanography and Marine Meteorology (JCOMM) for technical coordination of on-going observations. GOOS also serves as the ocean component of the Global Climate Observing system (GCOS). It is implemented through GOOS Regional Alliances and supported by a wide range of bodies, such as the Committee on Earth Observing Satellites (CEOS), the Partnership for Observation of the Global Ocean (POGO) and the GEO Blue Planet initiative.
The OceanObs’99 conference stimulated the first design of the GOOS and 10 years later, the OceanObs’09 conference assessed the progress made in implementing the GOOS. At that time, an international consensus was reached on how the GOOS should continue to evolve. Discussions around the GOOS highlighted
the tremendous potential value for physical, biogeochemical, and biological observations, particularly in the transition between the open ocean and the coastal environment, which is a key area for societal issues, economical applications and at the same time is a prime area for autonomous underwater glider (Davis et al., 2002) observations. Gliders were considered in this global framework from the very beginning. Developed in the 1980–1990s (Lee and Rudnick, 2018), they arose from the vision that a network of small, intelligent, mobile and cheap observing platforms could fill sampling gaps left by the other ocean observing platforms (Stommel, 1989). This idea was first discussed at OceanObs’99 (see Conference Statement1), when the technology was immature, and further developed at OceanObs’09, when the technology was still maturing but poised to make a substantial contribution to global ocean observing (Testor et al., 2010). It was agreed that gliders could fill important gaps left by other observing systems and thus greatly enhance the GOOS if fully integrated into the system, and recommendations were made for the next decade.
Progress Over the Last Decade
Since OceanObs’09, autonomous underwater gliders have reached a mature state and are now operated routinely. They offer persistent fine resolution observations in the coastal and open ocean, even at high latitudes (at least during summer months). Typically, gliders profile from the surface to the bottom, or to 200–1,000 m depth, taking 0.5–6 h to complete a cycle from the surface to depth and back. During that time they travel 0.5–6 km horizontally at speeds of about 1 km/h, even during very severe weather conditions. Deployments of about a year are now possible, with deployments of 3–6 months now routine, and survey tracks extending over 1,000s kilometers. Sensors on gliders measure physical variables such as pressure, temperature, salinity, currents, turbulence and wind speed (Cauchy et al., 2018), biological variables relevant to phytoplankton and zooplankton, and ecologically important chemical variables such as dissolved oxygen, irradiance, carbon dioxide, pH (Saba et al., 2018), nitrate and hydrocarbon. Gliders have been developed to sample under-sea ice and ice shelves (Webster et al., 2015; Nelson et al., 2016; Lee et al., 2017), to recover data from other deep instruments via acoustic telemetry and send them to land while at the surface (Send et al., 2013), to detect acoustic tags on fishes (Oliver et al., 2013, 2017) and marine mammals. Improved gliders have reached depths of up to 6,000 m (Osse and Eriksen, 2007). All these improvements greatly open up the range of possible applications.
Their unique sampling capacities (high resolution and long term) are especially suitable for some key oceanic phenomena.
They have yielded major scientific breakthroughs, revealing new insights into ocean physical, biogeochemical and biological processes. In particular, there are new results on (1) high latitudes oceanography, air-sea-ice interactions and intermediate/deep convection, (2) the variability of boundary currents, (3) (sub)mesoscale processes, (4) phytoplankton phenology and biogeochemistry, (5) higher trophic levels and biology, (6) shallow and marginal seas, (7) climate and variability of the
1http://www.oceanobs09.net/work/oo99.php
water column, (8) internal waves, turbulence, tides, diffusivity and vertical mixing, and (9) particles fluxes and sedimentology (seeTable 1).
Glider data are used for many applications in ocean physics, chemistry and biology (Rudnick, 2016). Glider data management by the scientific community has made data available to the public in real time for classical measured variables. Ocean numerical modeling and forecast activities already benefit from these data (Table 1). Models of ocean circulation, particularly for regional and coastal domains, have benefited from glider data in terms of validation and data assimilation, particularly in regional and coastal models. Glider data can improve hurricane intensity forecast models and has led to major results in ocean forecasting, weather forecasting including hurricane intensity, climatologies, and state estimates.
Underwater gliders will enable us to enter a new era of ocean observation and state estimates more effectively, meeting the needs of society and marine researchers. Gliders are a vital component in the portfolio of ocean observing platforms for most of the national ocean observation agencies. These agencies have invested in developing glider observing capability, and there are now about 400–500 gliders in the world actively being used to better observe the ocean (it is difficult to have exact numbers but based on our community knowledge we estimate∼250 gliders in the USA;∼100 in Europe;∼50 in China;∼30 in Australia;
∼30 in Canada; 9 in Mexico; 9 in South Korea; 5 in South Africa; 3 in Israel; 3 in Peru; 2 in New Zealand; 2 in India, 2 in Taiwan, etc.). Glider technology has also been used by the private sector during the last decade for applications in pollution events, defense, environment, and the offshore industry (Fragoso et al., 2016).
The Evolution of a Glider
Observing Community-OceanGliders
Today, underwater gliders are operated by many teams around the world that have developed end-to-end systems able to steer their gliders and collect their data through their own facilities and Iridium satellite-based communications. Glider deployments are challenging because they must be managed in real-time throughout their deployment with the two-way communications needed for active piloting by the different operating teams.
Glider technology requires a high level of expertise on the scientific and technological aspects in order to effectively operate the vehicles. Thanks to networking, coordination and capacity- building, training, liaison between providers and users, advocacy, and provision of expert advice, the global glider community has become more organized, grown rapidly, and responded to some of the system challenges. The idea for a glider community emerged in October 2005 at the first “EGO (Everyone’s Gliding Observatories) Workshop and Glider School” and since then, collaborations have further developed. EGO Workshops and Glider Schools have been organized on an annual basis, to present and discuss scientific and technological issues, and to train and engage new users and countries worldwide. The formation of a user group and global coordination has improved glider operational reliability and data management, and resulted in improved glider monitoring, ocean observing and developments of the glider platform. Over the last decade, this coordination
TABLE 1 |Highlights on results during the past decade using the glider technology.
High latitudes oceanography, air-sea-ice interactions, or intermediate/deep convection
Beszczynska-Möller et al., 2011; Frajka-Williams et al., 2011; Beaird et al., 2012, 2013; Evans et al., 2013; Fan et al., 2013;
Høydalsvik et al., 2013; Kohut et al., 2013; Queste et al., 2013; Guihen et al., 2014; Heywood et al., 2014; Carvalho et al., 2016;
Houpert et al., 2016; Nelson et al., 2016; Azaneu et al., 2017; Couto et al., 2017; Jones and Smith, 2017; Lee et al., 2017;
Timmermans and Winsor, 2013; Weingartner et al., 2013; Thompson et al., 2014; Ullgren et al., 2014; Venables and Meredith, 2014; Schofield et al., 2015; Swart et al., 2015; Thomalla et al., 2015; Testor et al., 2018; Våge et al., 2018; Viglione et al., 2018 Variability of boundary currents Pascual et al., 2010; Pattiaratchi et al., 2010, 2017; Ramp et al., 2011; Todd et al., 2011a,b, 2016, 2018; Albretsen et al., 2012;
Davis et al., 2012; McClatchie et al., 2012; Sherwin et al., 2012; Høydalsvik et al., 2013; Johnston et al., 2013; Lien et al., 2014, 2015; Pietri et al., 2014; Schaeffer and Roughan, 2015; Schönau et al., 2015; Yang et al., 2015; Lee et al., 2016; Mensah et al., 2016; Schaeffer et al., 2016a; Zaba and Rudnick, 2016; Andres et al., 2017; Anutaliya et al., 2017; Durand et al., 2017; Todd, 2017; Todd and Locke-Wynn, 2017; Aulicino et al., 2018; Houpert et al., 2018; Krug et al., 2018; Seim and Edwards, 2019 Mesoscale and submesoscale
processes
Bouffard et al., 2010, 2012; Baird et al., 2011; Baird and Ridgway, 2012; Heslop et al., 2012; Mahadevan et al., 2012; Ruiz et al., 2012; Todd et al., 2012, 2013; Alvarez et al., 2013; Pelland et al., 2013, 2014, 2016, 2018; Pietri et al., 2013; Piterbarg et al., 2013; Timmermans and Winsor, 2013; Caldeira et al., 2014; Hristova et al., 2014; Bosse et al., 2015, 2016; Everett et al., 2015; Farrar et al., 2015; Omand et al., 2015; Schönau and Rudnick, 2015, 2017; Sherwin et al., 2015; Borrione et al., 2016;
Caballero et al., 2016; Freitas et al., 2016; Mauri et al., 2016; Thompson et al., 2016; Thomsen et al., 2016; Brannigan et al., 2017; Buffett et al., 2017; Du Plessis et al., 2017; Gourdeau et al., 2017; Itoh and Rudnick, 2017; Karstensen et al., 2017;
Kokkini et al., 2017; Krug et al., 2017; Mancero-Mosquera et al., 2017; Margirier et al., 2017; Morrow et al., 2017; Pascual et al., 2017; Ruan et al., 2017; Yu et al., 2017; Zacharia et al., 2017; Gula et al., 2019
Phytoplankton phenology and biogeochemistry
Asper et al., 2011; Briggs et al., 2011; Martin et al., 2011; Xu et al., 2011; Alkire et al., 2012, 2014; Cetini ´c et al., 2012, 2015;
Pierce et al., 2012; Gower et al., 2013; Zhao et al., 2013; Foloni-Neto et al., 2014; Kaufman et al., 2014, 2017; Olita et al., 2014, 2017; Biddle et al., 2015; Evans et al., 2015; Hemsley et al., 2015; Nicholson et al., 2015; Queste et al., 2015; Seegers et al., 2015; Adams et al., 2016; Cotroneo et al., 2016; Fiedler et al., 2016; Jacox et al., 2016; Loginova et al., 2016; Pizarro et al., 2016; Porter et al., 2016; Schaeffer et al., 2016b; Schuette et al., 2016; Thomsen et al., 2016; Bosse et al., 2017; Hemming et al., 2017; Mayot et al., 2017; Ross et al., 2017; Thomalla et al., 2017; Little et al., 2018
Higher trophic levels and biology Kahl et al., 2010; Klinck et al., 2012; McClatchie et al., 2012; Powell and Ohman, 2012, 2015; Wall et al., 2012; Baumgartner et al., 2013, 2014; Ohman et al., 2013; Oliver et al., 2013; Guihen et al., 2014; Kohut et al., 2014a; Pelland et al., 2014; Ainley et al., 2015; Goericke and Ohman, 2015; Swart et al., 2016; Kusel et al., 2017; Taylor and Lembke, 2017; Benoit-Bird et al., 2018; Chave et al., 2018
Shallow and marginal seas Castelao et al., 2010; Shulman et al., 2010; Karstensen et al., 2014; Kohut et al., 2014b; Mazzini et al., 2014; Schaeffer et al., 2014; Piero Mazzini et al., 2015; Qiu et al., 2015; Dever et al., 2016; Mahjabin et al., 2016; Saldias et al., 2016; Heslop et al., 2017; Zarokanellos et al., 2017
Climate and variability of the water column
Cole and Rudnick, 2012; Schlundt et al., 2014; Domingues et al., 2015; Farrar et al., 2015; Houpert et al., 2015; Damerell et al., 2016; Schaeffer et al., 2016a; Rudnick et al., 2017; Portela et al., 2018
Internal waves, turbulence, tides, diffusivity and vertical mixing
Alford et al., 2012; Thorpe, 2012; Beaird et al., 2013; Johnston et al., 2013; Rainville et al., 2013, 2017; Fer et al., 2014;
Peterson and Fer, 2014; Boettger et al., 2015; Cronin et al., 2015; Johnston and Rudnick, 2015; Palmer et al., 2015; Klymak et al., 2016; Hall et al., 2017; Schultze et al., 2017; St Laurent and Merrifield, 2017; Todd, 2017; Evans et al., 2018; Ma et al., 2018; Scheifele et al., 2018
Particles fluxes and sedimentology
Briggs et al., 2011; Miles et al., 2013; Bourrin et al., 2015; Omand et al., 2015; Many et al., 2016; Churnside et al., 2017;
Durrieu de Madron et al., 2017 Ocean forecasting, climatology,
and state estimates
Dobricic et al., 2010; Oke et al., 2010, 2015; Zhang et al., 2010a,b; Chudong et al., 2011; Ramp et al., 2011; Todd et al., 2011a, 2012; Yaremchuk et al., 2011; Jones et al., 2012; Melet et al., 2012; Mourre and Alvarez, 2012; Gangopadhyay et al., 2013; L’Heveder et al., 2013; Li et al., 2013; Rayburn and Kamenkovich, 2013; Wilkin and Hunter, 2013; Alvarez and Mourre, 2014; Chen et al., 2014; Drillet et al., 2014; Mourre and Chiggiato, 2014; Ngodock and Carrier, 2014; Pan et al., 2014, 2017;
Durski et al., 2015; Miles et al., 2015; Rudnick et al., 2015; Estournel et al., 2016a,b; Fragoso et al., 2016; Kerry et al., 2016, 2018; Chao et al., 2017a,b; Damien et al., 2017; Dong et al., 2017; Goni et al., 2017; Halliwell et al., 2017; Kurapov et al., 2017;
Onken, 2017; Todd and Locke-Wynn, 2017; Verdy et al., 2017
activity has also developed nationally and regionally. Many national facilities have been established to serve their national communities such as the IMOS (Integrated Marine Observing System) Ocean Gliders facility, Ocean Gliders Canada, GMOG (Grupo de Monitoreo Oceanográfico con Gliders) in Mexico, MARS (Marine Autonomous and Robotic Systems) in the UK, Norwegian National Facility for Ocean Gliders (NorGliders) in Norway, “Parc National de Gliders” in France, etc. Glider groups have also been set up for coordination within integrated ocean observation initiatives such as the Integrated Ocean Observing System (IOOS), the Integrated Marine Observing System (IMOS) and the European Ocean Observing System (EOOS)/EuroGOOS.
There are now several levels of coordination and this greatly facilitates scientific and technological exchanges between glider operators and users, in academia and industry.
Building on this diverse community, the OceanGliders program started in September 2016 at the 7th EGO conference.
It was set up in recognition of the maturity of the glider systems and their potential role in the GOOS in coming years.
TheOceanGliders program as a component of the GOOS was approved by the Joint WMO-IOC Technical Commission for Oceanography and Marine Meteorology (JCOMM) at their 5th Intergovernmental Session in October 2017 and theOceanGliders Steering Team reports to OCG. Here we review the progress
made in implementing a glider component of the GOOS, one of the key recommendations from OceanObs’09, present the recently established program and components, and offer a vision for the coming decade.
MOVING FROM THE REGIONAL TO THE GLOBAL
The progress of gliders in moving from a developing to a mature technology is exemplified by the programs that have been run continuously for over 10 years, for example, in the California Current (Adams et al., 2016; Rudnick et al., 2017), and the Solomon Sea (Davis et al., 2012). Long-term observations lasting several years are becoming widespread (Heslop et al., 2012;
Schaeffer et al., 2016a; Yu et al., 2017; Du Plessis et al., 2019).
The capability to sustain these programs relies on the improved dependability of gliders (Brito et al., 2014; Rudnick et al., 2016a;
Brito and Griffiths, 2018) and the experience, skill and confidence of the operators. The success of these projects can be summarized in the likelihood of a glider completing a desired mission, and the fraction of the time that a glider is in the water. Typical success rates of 0.9 have been achieved by experienced teams. The delivery of data from gliders in real time has become routine, with main glider data assembly centers in Europe (EGO/Coriolis2), Australia (IMOS3), and the USA (IOOS4).
Underwater gliders play a special role in observing systems designed to support regional modeling activities, because gliders generate many profiles at controlled locations. The potential for glider development was recognized quite early on, leading to the influential Autonomous Ocean Sampling Network (Ramp et al., 2009). Glider data are often used with models for two purposes:
(1) verification, meaning to evaluate model output for fidelity to the ocean; and/or, (2) assimilation, the use of data to constrain model output (Edwards et al., 2015; Hayes et al., 2019). Models can either (1) forecast ocean variables in advance of any access to data for verification; or (2) hindcast to deliver state estimates that use data to create a complete set of ocean variables. Many combinations of using glider data for verification or assimilation of forecast or hindcast models have been tried in many regions around the world. For example, off California, Kurapov et al.
(2017)used glider data (Rudnick et al., 2017) to verify a forecast model, whileChao et al. (2018)assimilated the same glider data to create forecasts. Temperature and salinity data from these gliders were assimilated into a state estimate (Todd et al., 2011a, 2012;
Zaba et al., 2018), while velocity data were not assimilated so they could be used for verification. In the Mediterranean,Dobricic et al. (2010)showed the large-scale impact of the repetition of a glider section and in particular when depth-average currents were also assimilated while Mourre and Chiggiato (2014) and Onken (2017)assimilated glider data for a forecast and verified against data from a ship survey. A state estimate of the tropical Pacific (Verdy et al., 2017) was verified against withheld glider
2http://www.coriolis.eu.org/Data-Products/Catalogue#/metadata/589bfa51- 2219-4cc8-a19e-83f3c3f27bb4
3https://portal.aodn.org.au/
4https://gliders.ioos.us/data/
observations on either side of the Pacific basin. These examples illustrate the character of recent work. Ongoing work is expected to improve regional observing modeling in the coming decade.
Underwater gliders are especially well-suited for sustained, fine-spatial-resolution observations near the ocean boundaries.
They allow cross-front measurements to help resolve mesoscale/sub-mesoscale fronts and associated shear-driven instabilities in both the coastal and open ocean. The long times for deployments of gliders are possible because they move slowly (10s cm/s) and because energy lost to drag is proportional to the cube of the speed through water. Gliders must profile continuously in order to make way through water, so fine resolution in the order of a few kilometers is common.
Gliders can be deployed and recovered from small boats, thereby minimizing costs and allowing flexible operation. Sustained, fine- resolution operations near boundaries are ideal for monitoring the regional effects of climate variability. Gliders fill the gap between the coast and the open ocean, as tracks of thousands of kilometers are typical, making traversing the 200 nautical mile Exclusive Economic Zone practical. Gliders could revolutionize regional oceanographic observing just as Argo did for observing the open ocean over the last two decades.
OceanGliders Terms of Reference
The international OceanGliders program was created as a component of the GOOS with the broad goals of strengthening the glider community (users, scientists, engineers, operators, manufacturers) and facilitating the sustained worldwide use of gliders for the benefit of society and science5. An initial structure and set of governance rules were agreed upon, as well as more detailed ways to maintain and develop the program, briefly summarized inTable 2. Because of their proven ability to fill gaps and needs in the existing observation system, gliders are on the cusp of a transition from isolated, regional use by a few expert teams, to widespread use around the globe by coordinated groups with a wider range of applications. The glider community has realized the many benefits of sharing expertise, best practices, data, and even infrastructure components among existing and new members. Providing a global program, in which new ideas can be discussed and coordinated for larger-scale adoption, will turn regional efforts into integrated global efforts.
This fits perfectly into the GOOS mission to promote feasible, high-impact observing programs.
Data Management
OceanGliders targets high-impact, societally-relevant, science- based observing through a number of initial scientific Task Teams (OceanGlidersTT). They are developed in the following section, but one Task Team in particular relates to the smooth, coordinated functioning of each TT with each other and with the rest of the GOOS: the data management TT. This team aims to address the needs of long-term observation aspects of data management, benefiting the wider community, supporting and encouraging scientists designing and executing process studies, as well as engineers developing new gliders, sensors, and computing
5https://www.ego-network.org/dokuwiki/doku.php?id=public:goosgstt
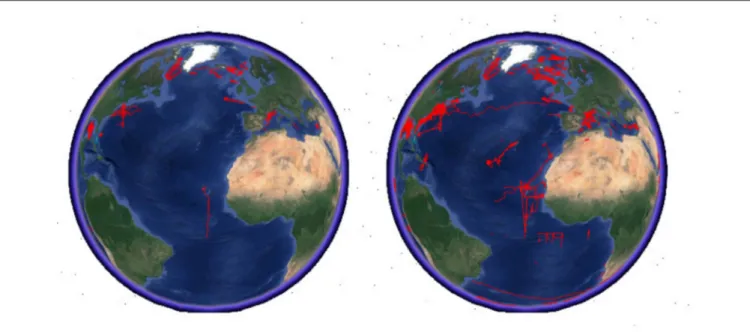
TABLE 2 |Summary ofOceanGlidersterms of reference and objectives.
Purpose To provide scientific leadership to promote and strengthen the glider community and facilitate their sustained use globally in order to respond to the integrated requirements of the Global Ocean Observing system (GOOS). Oversee the development and implementation of a global-scale glider array for observing key regions of the ocean on the long term, based on national and regional projects (https://
www.ego-network.org/dokuwiki/lib/exe/fetch.php?media=
public:gst:glider-st_tor.pdf)
Membership Anyone willing to contribute to the different Task Teams is considered as a member, keeping in mind the focus on developing sustained glider activity and the “Framework for Ocean Observing.”
Steering Team Reflect and represent the sustained glider activity and to driveOceanGliderstoward its goal of filling gaps in GOOS/GCOS
Exec Committee Chair, co-Chair, Task Teams Leaders and GOOS advisor Task Teams Design network, define targets for Task Teams missions
(optimum strategy)
Define science implementation plans
Describe scientific requirements and societal requirements Describe the global costs and cost-effectiveness Define the contribution of Task Teams in a multi-platform system designed to address scientific and societal issues, including unique roles of gliders
Meetings Annual Steering Committee meetings
technologies to participate in metadata and data management.
Data management implies not only data repositories of a certain standard, but the guidance and coordination in the development of new standards and best practices (Pearlman et al., 2019) for data collection, processing, and quality control. Data management requires metadata and its description, storage, and access. One of the benefits of coordination will be improved and sustained quality control of glider data.
Network Monitoring and Data Dissemination
One main goal for glider operators is to make data publicly available and in particular to publish data in near-real time on the GTS (Global Telecommunication System) and in CF (Climate and Forecast) compliant formats for operational services. They provide their metadata and data to a Data Assembly Center (DAC) in charge of the data management and linked to a Global Data Assembly Center (GDAC) for further dissemination and archive. Three de facto GDACs are currently operating:
Australia (IMOS), Europe and partners (EGO/Coriolis), and the United States (IOOS). Each GDAC has adopted similar strategies and conventions: CF-compliant NetCDF observation file formats can be uploaded by operators, and public sites and tools are provided for downloading and visualization. There are minor differences in formats, and the implementation of tools for raw file conversion, discovery, download and visualization varies widely. Numerous regional and local efforts have developed important tools but this has made it painfully obvious that coordination is needed for global-scale visibility and availability of ocean observations of known quality control. Initial efforts by IMOS, EGO/Coriolis and IOOS at collecting daily glider data
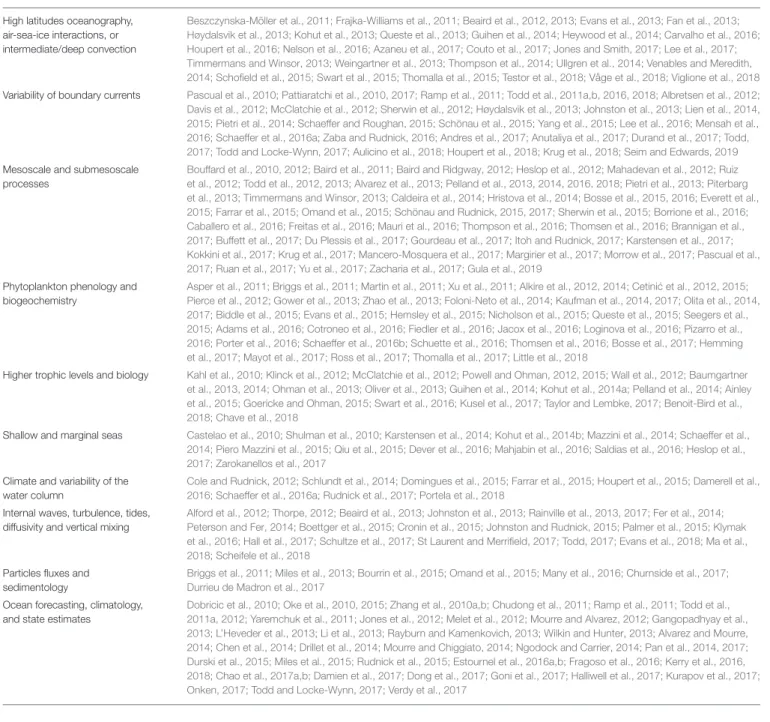
illustrate some of the extent of glider activity worldwide over the past decade (Figures 1,2). This also represents the commitments from glider teams that have fed these systems, showing most of the glider deployments carried out so far in the world. The next step of unifying and providing data seamlessly from any region through one portal must be simpler. Already, the three GDACs have shared detailed information on how to upload, discover, download, and visualize using their tools. Simplifications have been made to provide easy access among the GDACs. This information will be centralized as inFigure 3and accessible on theOceanGliders website www.oceangliders.org and will be an important tool to monitor global glider activity and promote its objectives.
The first dedicated global glider data management meeting has stimulated further developments (Genova, Italy, 17–
19 September, 2018). Besides sharing expertise and latest developments at the regional level, this meeting produced a global consensus about how glider data can be made more useful to society, considering both historical and near real time data sets, now and in the future. Short-term goals include: setting up a solution to access all glider data in a single format; define indices for glider activity monitoring; handling the real time and delayed mode quality controls and assessments at the global level. Further development and sharing of best practices on data and metadata management are key for the OceanGliders Data Management Task Team. To that end, there is now a new central directory at www.oceanbestpractices.net, hosted by IODE, forOceanGliders.
Glider-specific tools have been developed at the GDAC and regional/institutional (or DAC) level to complement the other elements of the GOOS. The unique trajectory character of glider data, and of the wide range of metadata can cause these tools to be quite complex. Even the familiar concepts of “cruise,” “mission,”
“transect,” and “profile” do not adequately describe the nature of glider flight and programmable behavior in real time.
There are too many to exhaustively list here, but notable examples include: GliderScope6 (Hanson et al., 2017), IOOS7, EGO GFCP8, NorGliders GliderPage9, SOCIB10 (Troupin et al., 2015), MARS11, and GANDALF12. Going forward, standardized data and metadata interfaces will benefit the future development of such tools and enable easier, global access to the full set of quality-controlled glider data and metadata [e.g., the Sensor Web Enablement framework and associated standards (Bröring et al., 2017)].
Emerging Requirements
Glider data management will need to encompass developments within the glider networks, the GOOS and outside of the oceanographic domain in order to anticipate future changes in global data management. The implementation of Findable- Accessible-Interoperable-Reusable (FAIR) data principles is a
6http://imos.org.au/gliderscope/
7https://gliders.ioos.us/map/
8https://www.ego-network.org/dokuwiki/doku.php
9http://gp.gfi.uib.no
10http://www.socib.eu/?seccion=observingFacilities&facility=glider
11https://mars.noc.ac.uk/
12http://gandalf.gcoos.org
FIGURE 1 |Development of the glider activity over the past decade. Gliders tracks of past deployments(left)until December 2009 (OceanObs’09) and(right)until October 2018 (OceanObs’19 submissions), as can be viewed using google-earth.
common theme in environmental data management and will place demands for development on glider data infrastructure (Tanhua et al., 2019). The integration of data from different networks within the GOOS and the implementation of new Essential Ocean Variables (EOVs) are also emerging as requirements. Furthermore, additional demands on data management will emerge with such as automated piloting (e.g., Chang et al., 2015; Smedstad et al., 2015) and operational glider network monitoring technologies.
ADDRESSING GLOBAL OBSERVING NEEDS
The OceanGlidersgroup met to discuss possible areas of focus and beyond the central need for improved data management, identified three key areas of focus for the developing program.
These areas of interest were organized into Task Teams (TT) whose goals are to address the societal needs for ocean data and to entrain the community into discussions around the role of gliders in meeting these needs. It is expected that the mission-based TTs will organically develop by organizing the different initiatives into integrated and coordinated global efforts.
Boundary Currents
Society experiences changes in the global ocean at the ocean’s boundaries. These boundary regions are the nexus of societal use of the ocean for fisheries, transportation, and recreation. The boundary regions are also where the intense ocean currents are key to the transport of mass, heat, salt, biogeochemical variables and plankton. In the large ocean basins, the subtropical western boundary currents dominate the surface poleward transport of warm water or equatorward transport of cold water at depth
and are major drivers of climate variability. Subtropical eastern boundary currents are often upwelling systems that comprise some of the most biologically productive regions in the world and host the world’s Oxygen Minimum Zones (OMZ). Subpolar eastern boundary currents induce significant poleward heat transport in the downwelling eastern part of the subpolar gyres.
Boundary currents in marginal seas provide the major means of exchange with the open ocean and impact regional ecosystems.
Finally, the communication between the coast and open ocean is regulated by the boundary currents that flow along the continental slopes, affecting ecosystems, flood levels, erosion and commercial activity. To summarize, there is a great need for sustained observations of these highly dynamic boundary current regions.
Underwater gliders are particularly effective at measuring and monitoring subsurface biogeochemical fields that are both key to marine ecosystem productivity and involved in some of the most pressing ocean challenges like ocean acidification and hypoxia. For instance, glider capabilities are well-suited to sample the upwelling source waters transported to the edge of the continental shelf by eastern boundary currents. Recent studies in the Pacific and Atlantic reveal details of the spatial structure and time evolution of, for example, low-oxygen zones in such regions (Pierce et al., 2012; Pietri et al., 2013; Adams et al., 2016; Pizarro et al., 2016; Thomsen et al., 2016; Karstensen et al., 2017).
From their earliest conception, underwater gliders were viewed as components of observing/modeling systems, and progress over the past decade has proven the efficacy of this approach. The data provided by underwater gliders are a natural match for regional models of coastal ocean circulation.
These regional models are necessary, as the currents and water properties in the coastal ocean vary on the relatively small scales
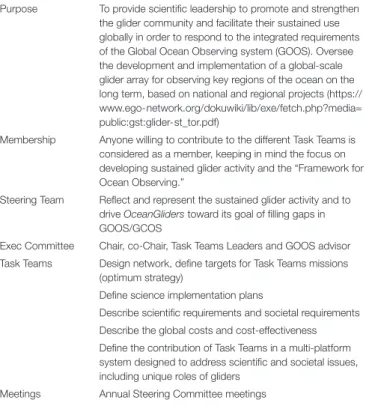
FIGURE 2 |Gliders tracks of past deployments until October 2018 (OceanObs’19 submissions), as can be viewed using google-earth from different locations.
set by topography. Accurate forecasting depends on initialization on these small scales, which can be satisfied by a network of gliders.
The most widespread application of sustained glider programs has been in boundary currents. These efforts range from the significant western boundary currents, to the highly productive eastern boundary upwelling systems, to regionally important boundary currents in marginal seas. Initial targets are often the mean and variability of velocity, temperature, and salinity, and now moving to include biogeochemical and biological variables.
As the sustained time series increase in length, interannual climate variability is resolved. The remarkable increase in sustained glider observations in the last 10 years is summarized below and illustrated byFigures 4–6.
Sustained projects in the Atlantic include observations on the western, eastern and northern boundaries of the North Atlantic. The marginal seas of the Atlantic, including the
Mediterranean and the Gulf of Mexico are also home to long- term observations.
• The Davis Strait was observed repeatedly during 2005–2014 to quantify the exchange between the Arctic Ocean/Baffin Bay and the subpolar North Atlantic (Figure 5A; Beszczynska- Möller et al., 2011; Curry et al., 2014; Webster et al., 2015). Although this effort succeeded in collecting year- round observations across the seasonally ice-covered strait, challenging logistics, harsh operating conditions and funding prevented continuous occupation of the section over the entire 2005–2014 period.
• The warm water paths of the North Atlantic Current over the Rockall-Hatton Plateau at 58◦N are being observed using repeat glider sections between 15 and 21◦W as part of OSNAP since 2014 (Figure 5E; Houpert et al., 2018;
Lozier et al., 2019).
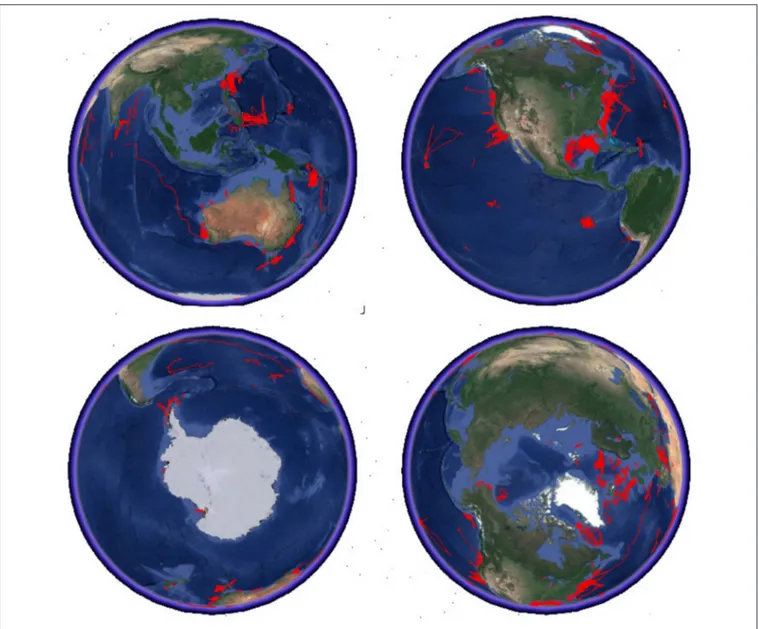
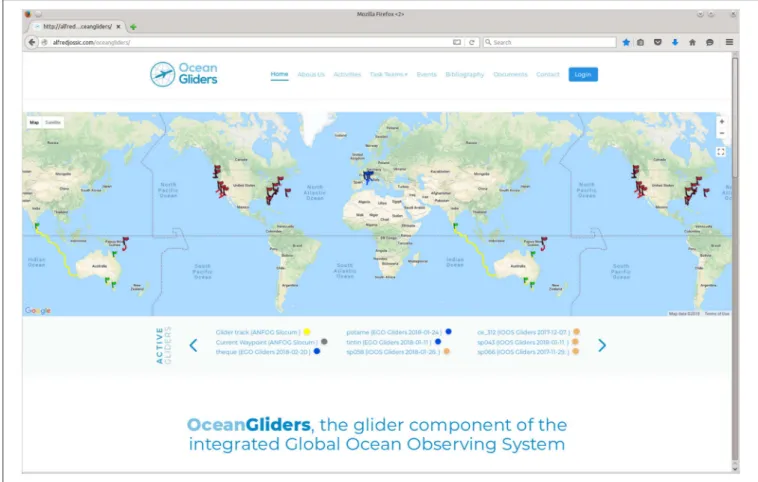
FIGURE 3 |The global active glider fleet trajectory map, updated daily (from http://anfog.ecm.uwa.edu.au/index.php?page=global_gliders, accessed 23 August, 2018).
FIGURE 4 |Sustained observations of boundary currents of duration from at least one to over a dozen years. Mean sections of absolute geostrophic velocity are a unique product of underwater gliders, calculated by combining geostrophic shear with directly measured depth-average velocity. These sections at the locations in this figure are shown inFigures 5,6.
• The Nova Scotia Current was observed during 2011–2014 by repeat glider sections as part of the Ocean Tracking Network (Figure 5B; Dever et al., 2016) and re-established by Fisheries and Oceans Canada in 2018 as part of its monitoring programs.
• Along the East Coast of the United States, a program of routine glider surveys across the Gulf Stream is underway.
Commanded to steer across strong currents of the western boundary current, gliders are able to occupy cross-Gulf Stream transects as they are advected downstream (Figure 5C;Todd
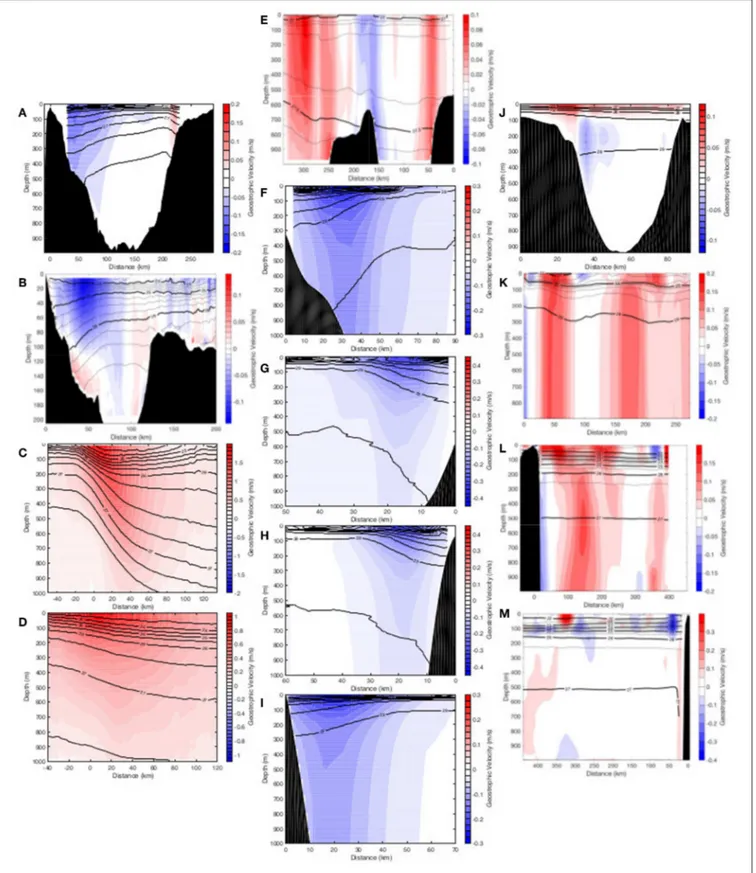
FIGURE 5 |Mean sections of geostrophic velocity from the Atlantic, Mediterranean and Indian Ocean. Sections in the Atlantic include(A)the Davis Strait,(B)the Nova Scotia Current off the east coast of Canada,(C)the Gulf Stream off the eastern US coast,(D)the Gulf of Mexico Loop Current, and(E)the North Atlantic Current west of the UK. Sections in the Northern Current System of the Mediterranean Sea are(F–I)along the southern coast of France,(J)between the Spanish coast and the island of Ibiza, and(K)between Sardinia Island and Menorca. In the Indian Ocean, sections are off the(L)east and(M)south coast of Sri Lanka. The sections are oriented generally west to east or south to north, and positive geostrophic velocity is primarily northward or eastward.
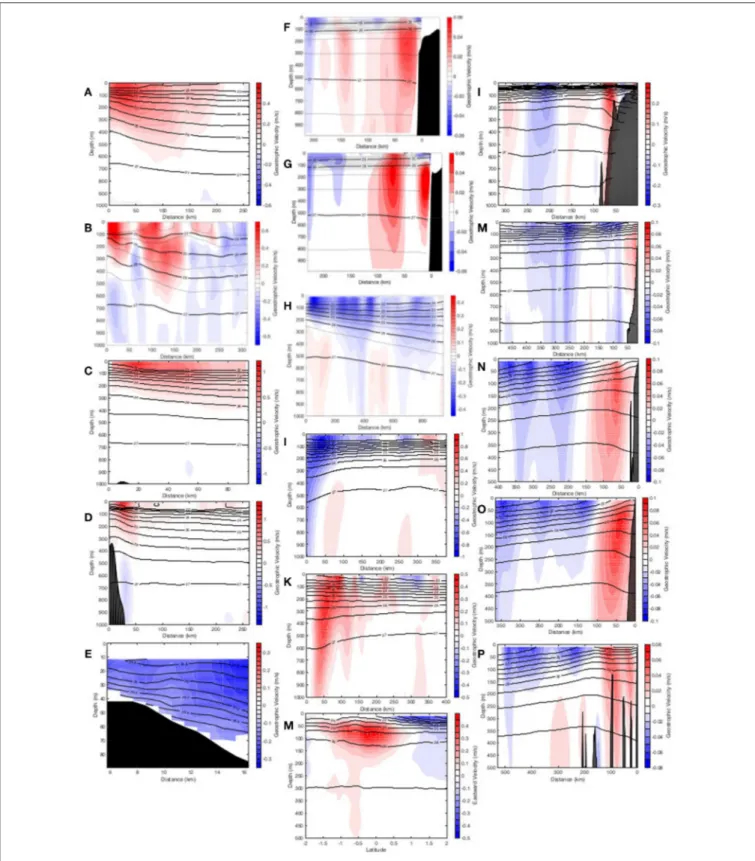
FIGURE 6 |Mean sections of geostrophic velocity from the Pacific. Sections in the western Pacific include the Kuroshio offshore of(A,B)Taiwan and(C,D)Luzon, and in(E)the East Australian Current,(H)the North Equatorial Current,(I)the Mindanao Current, and(J)the New Guinea Coastal Current of the Solomon Sea.
Sections in the eastern Pacific include(F,G)two off Washington,(L)one off Oregon and four off the California coast at(M)Trinidad Head,(N)Monterey Bay,(O)Point Conception, and(P)Dana Point. A mean section across the equator at 93◦W off the Galapagos(K)was measured by acoustic Doppler profilers, as geostrophy fails at the equator. The sections are oriented generally west to east or south to north, and positive velocity is primarily northward or eastward.
et al., 2016, 2018; Todd, 2017; Todd and Locke-Wynn, 2017;
Gula et al., 2019).
• The Gulf of Mexico Loop Current was observed starting in 2007, and continuously during 2011–2014 with a focus on mean structure, eddies and separation processes (Figure 5D;
Rudnick et al., 2015; Todd et al., 2016). Along-gradient glider trajectories of mesoscale eddies ubiquitous in the central and western Gulf of Mexico have been repeatedly carried out since May 2016 to present as a component of a quasi-continuous (90% of time) monitoring program conducted by GMOG.
• European Slope Current at 56.5N as part of the sustained Ellett Line program. Gliders have been occupying this section in winter since 2009, and several times per year since 2015 (Sherwin et al., 2015).
• In the Western Mediterranean, repeat glider transects have been conducted to monitor the variability of the Northern Current System, over 10 years in the north of the basin (Figures 5E–H;Testor et al., 2018), for 6 years at a circulation
“choke” point (Figure 5I;Heslop et al., 2012), for 8 years at the Mallorca Channel (Barceló-Llul et al., 2019) and more recently between Sardinia and Balearic Islands (Figure 5J) and between Mallorca Island and the African coast (Cotroneo et al., 2016;
Aulicino et al., 2018).
• The Norwegian Atlantic Current Observatory has undertaken long term glider monitoring across 2 transects over 4 years, monitoring northward flow to the Arctic regions (Høydalsvik et al., 2013). Gliders have been used to monitor the topographic steering of warm Atlantic waters toward Arctic tidewater glaciers on the west Spitsbergen margin (Fraser et al., 2018).
• Since 2012, gliders have been deployed in the Subantarctic Zone of the South Atlantic each year, as part of the Southern Ocean Seasonal Cycle Experiments (SOSCEx; Swart et al., 2012). Deployment have covered all seasons except late austral autumn to assess bio-physical interactions from sub seasonal to seasonal scales (Du Plessis, 2015; Swart et al., 2015;
Thomalla et al., 2015; Little et al., 2018; Du Plessis et al., 2019).
• Repeated sections were carried out off Cape Verde Islands as part of the Collaborative Research Center 754 (DFG;Oschlies et al., 2018), Senegal (Kolodziejczyk et al., 2018) and Angola, primarily to study the OMZ.
Projects in the Indian Ocean range from the Bay of Bengal to the currents that connect to the Southern Ocean:
• Gliders in the Bay of Bengal off the east and south coasts of Sri Lanka (Figures 5K,L;Lee et al., 2016).
• Repeated sections in the Agulhas Current since 2017 as part of Gliders IN the Agulahas (GINA,Krug et al., 2018) following the Shelf Agulhas Glider Experiment (SAGE) in 2015. Initial results include observations of cyclones on the inshore edge of the current (Krug et al., 2017).
• Many cross sections of the Leeuwin Current, the poleward flowing eastern boundary current in the southern Indian Ocean (Pattiaratchi et al., 2017).
Projects in the Pacific include sustained observations in the eastern boundary current of the North Pacific, and both the
midlatitude and low-latitude western boundary currents of the North and South Pacific:
• The Kuroshio off Taiwan (Figures 6A–D; Lien et al., 2014;
Yang et al., 2015), the North Equatorial Current north of Palau (Figure 6H; Schönau and Rudnick, 2015) and the Mindanao Current off the Philippines (Figure 6I; Schönau and Rudnick, 2017) were occupied continuously from 2007 to 2014 to quantify transports and water masses as part of the project Origins of the Kuroshio and Mindanao Current (OKMC). Observations began again in 2017 with a line off Taiwan.
• Repeated sections across Solomon Sea were made for nearly a decade to monitor the low latitude western boundary current that feeds the Pacific equatorial current system from the Southern Hemisphere (Figure 6J;Davis et al., 2012).
• The California Underwater Glider Network has occupied three lines in the California Current System for the past decade with a primary goal of monitoring the regional effect of climate variability as caused by El Niño (Figures 6N–P;Rudnick et al., 2017). A fourth line off northern California has been occupied for 2 years (Figure 6M).
• The inshore edge of the East Australian Current (EAC) has had repeated sections run since 2010 (Figure 6E) to observe the separation of the current, and the momentum balance at that point (Schaeffer and Roughan, 2015), the hydrographic structure of the current (Schaeffer et al., 2016a), the biogeochemistry (Schaeffer et al., 2016b).
• Sections across the California Current, immediately south of the West Wind Drift bifurcation region, were occupied continuously from 2003 to 2009, and then annually, for 6–9 months per year, from 2010 to 2015 (Figures 6F,G). These observations provide data to advance the understanding of the regional response to climate variability and California Undercurrent Eddies (Pelland et al., 2013).
• The Ocean Observatories Initiative began occupying 5 sections off Oregon and Washington, starting in 2014 to address the influence of climate variability on eastern boundary ecosystems. One of these lines, off Oregon, has been occupied continuously since spring 2006 (Figure 6L;
Mazzini et al., 2014).
• Repeated sections off Peru started in 2008 (Pietri et al., 2013) to study the Humbolt system.
• Repeated sections off Chile (Pizarro et al., 2016) primarily to study the OMZ.
• Repeated sections in the Coral Sea adjacent to the north Queensland coast (Australia) have been used to estimate boundary current transport (Ridgway and Godfrey, 2015).
• The Equatorial Current System was observed during 2013–
2016 using acoustic Doppler profilers (Todd et al., 2017;
Figure 6H), as geostrophy fails at the equator. These measurements were undertaken as part of the Repeat Observations by Gliders in the Equatorial Region (ROGER) program (Rudnick, 2016).
• Glider transects at 37.9◦N across the East Korean Warm Current along the Korean Peninsula have been conducted since 2017.
Underwater gliders can measure absolute geostrophic velocity.
The geostrophic shear may be calculated from glider sections by estimating the horizontal gradient of density. This shear is referenced to the depth-average velocity that is calculated by dead reckoning between navigational fixes at the beginning and end of dives. This absolute, depth-dependent geostrophic velocity normal to the glider section allows calculation of the transport of mass, heat and salt. These transports are the fundamental quantities needed for baseline monitoring of boundary currents. Much work has been done to quantify the scales resolved and the accuracy of the velocity. For example, high frequency motions, such as internal waves, are projected into spatial variability in a glider section, with the result that horizontal wavelengths longer than 30 km are resolved in midlatitudes (Rudnick and Cole, 2011). The accuracy of the depth-average velocity, is of order 0.01 ms−1, as inferred in early design studies, and confirmed by decades of observations (Rudnick et al., 2018). The sustained observations have produced several estimates of the boundary currents (Figures 4–6).
The goal of the OceanGliders Boundary Ocean Observing Network (BOON) is to provide coordination for a global observing program. Because boundary currents invariably reside in EEZs, their observation must depend on regional efforts respectful of the coastal countries. The goal of BOON is to sustain observations year-round. The result will be a global network of regional networks that monitor boundary current variability across international borders to the world’s benefit.
The OceanGliders BOON complements existing ocean observing networks. Argo has transformed ocean science with its global coverage. BOON connects Argo’s observations of the open ocean with the coastal ocean by operating the transects that are required to monitor boundary currents. BOON expands the footprint of site-specific moorings of OceanSites by repeated sections that may connect to mooring locations. Repeated surveys by ships form the backbone for many existing regional efforts, in some cases going back decades. BOON will step change our ability to observe boundary current variability in real-time, across all seasons and in difficult conditions and locations, building on the historical record and improving temporal and spatial resolution by overlapping with these ship surveys. BOON will identify gaps in the observation of boundary currents, with the goal of filling them by the most appropriate technology (Todd et al., 2019).
Storms
Tropical and extra-tropical storms are among the most destructive natural events on Earth. Tropical storms cause an average of 10,000 deaths per year and will potentially cost the global economy more than $9.7 trillion over the next century. Growing coastal populations, urbanization, and rising sea levels magnify our vulnerabilities to storms, escalating the need for more accurate storm tracking, intensity and impact forecasts. Tropical storm tracking forecasting has shown steady improvement over the past 25 years due, in part, to the improvements in the global atmospheric forecast ensembles. But similar improvements in tropical storm intensity forecasts have
lagged, in part due to the paucity of upper ocean data defining its pre-storm heat content, the inability of operational ocean models to forecast with sufficient accuracy the rapid changes in upper ocean heat content in conditions of extreme forcing, and the uncertainty in the processes that influence the transfer of heat between the ocean and atmosphere. Tropical storm impacts, such as wind and storm surge, require accurate tracking and intensity forecasts.
Gliders have been the critical observing system element for two study areas in particular, one focused on an area of potential rapid intensification surrounding the Caribbean Islands, and another in the Mid Atlantic Bight where rapid intensity reductions have challenged forecasters.
In the tropical Atlantic and Caribbean Sea, early research carried out by NOAA/AOML, NOAA/NHC, and University of Miami scientists has demonstrated that the upper ocean is linked to hurricane intensification and/or weakening provided that the appropriate atmospheric conditions are present (Shay et al., 2000). For example, several studies have shown how major hurricanes, including HurricaneKatrina (2005), rapidly intensified while traveling over a warm Loop Current and Eddy feature in the Gulf of Mexico (Mainelli et al., 2008).
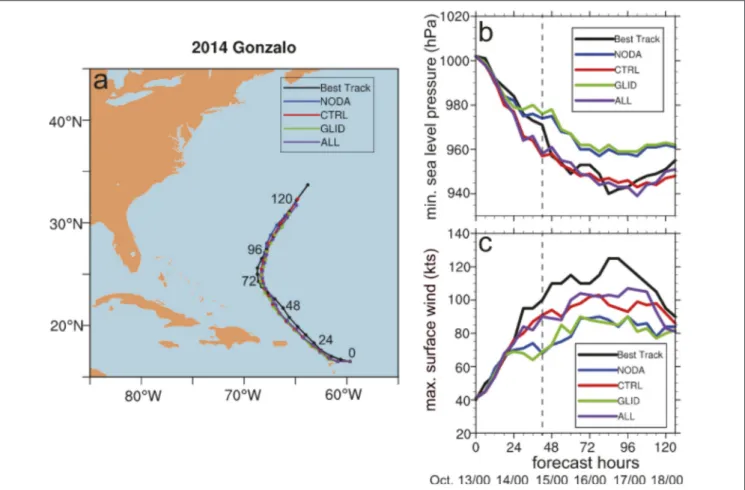
Studies carried out for other Atlantic hurricanes have shown the close link between the upper ocean heat content and the intensity changes observed in Cat 3 and above hurricanes. Since this link has been established in this region, efforts are now geared toward improving hurricane intensification forecasts of numerical operational and experimental models to produce a correct representation of the upper ocean density (temperature and salinity) structure. For example, recent research has shown that the appropriate initialization of the ocean component within the HYCOM-HWRF intensity forecast model has improved the representation of the upper ocean while reducing the error of the intensity forecast of Hurricane Gonzalo (2014) by almost 50% (Dong et al., 2017; Figure 7). In this case, underwater glider data were critical to improving the hurricane forecast because they were the only ocean observations that captured the salinity-stratified barrier layer that inhibited the mixing of colder subsurface waters and subsequent upper ocean cooling ultimately allowing for hurricane intensification (Domingues et al., 2015).
NOAA OAR research has established the relationship between hurricane intensity and the Mid Atlantic’s two-layer water column. The missing essential ocean feature is the unseen bottom Cold Pool. This vast (1,000 km long×100 km wide) cold water mass (∼10◦C) lies below a thin warm layer (>28◦C) during the Atlantic hurricane season and is unobservable by satellites.
By deploying autonomous underwater gliders ahead of Mid Atlantic land-falling hurricanes, the Cold Pool was mapped and its evolution monitored, leading to the discovery of rapid storm induced mixing that cooled the ocean ahead-of-eye-center by up to 11◦C (Glenn et al., 2016). This new ahead-of-eye- center cooling process was shown to be region-wide in multiple hurricanes (Seroka et al., 2017) and is responsible for over 75% of the observed storm-driven cooling in the Mid Atlantic since 1985 (Glenn et al., 2016). Furthermore, the cooling of the surface ocean by the entrainment of the sub-surface Cold Pool was the missing component required to accurately forecast
FIGURE 7 | (a)Hurricane Gonzalo track forecast,(b)minimum sea level pressure (center pressure), and(c)maximum wind forecasts, along with the best track.
Gliders improve hurricane forecast. The dashed line denotes the track location closest to the glider at 0000 UTC 13 Oct 2014. (Figure 12 fromDong et al., 2017).
the rapid de-intensification of Hurricane Irene (Seroka et al., 2016). In stark contrast, gliders deployed ahead of Superstorm Sandy revealed a different Cold Pool response and impact on intensity. The onshore track, large wind field, and slow approach forced the Cold Pool more than 70 km offshore. This removed the bottom Cold Pool water and resulted in limited surface cooling and little storm weakening ahead of Sandy’s historic storm surge in the region (Miles et al., 2017). The warm surface layer and the bottom Cold Pool, and their rapid evolution during hurricanes, must be well-resolved to reduce the uncertainty of hurricane intensity predictions. This can only be accomplished with underwater gliders reporting whatever the sea conditions are, and real-time subsurface profiles over the GTS, since operational ocean models cut off satellite altimeter data assimilation for water depths <150 m, leaving satellite Sea Surface Temperature (SST) as the only operational data contribution on continental shelves.
Picket lines of subsurface gliders sustained for the hurricane season in areas of rapid intensity change where identified as the most critical addition to the integrated ocean observations required to improve the ocean component of coupled ocean- atmosphere forecast models. A U.S. collaborative effort between NOAA, Navy, NSF, Industry and Academia implemented the hurricane glider picket line concept for the first time during
the 2018 hurricane season. Data flow from individual glider operators to the GTS was coordinated through the U.S.
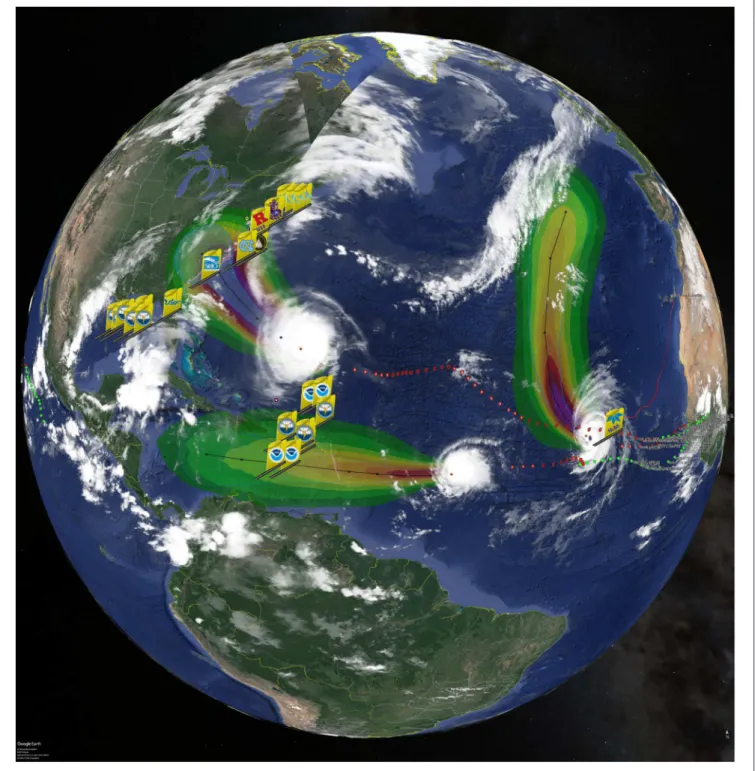
IOOS Glider Data Assembly Center (DAC). The system was tested in September when 3 hurricanes were simultaneously present in the North Atlantic, each with gliders deployed in their path. This included Hurricane Florence, a category 4 storm at its peak that impacted the eastern seaboard of the US (Figure 8). The glider data transmitted over the GTS were used as input to the operational Ocean Heat Content maps that were used to help with NHC forecast intensity decisions.
OceanGliders supports the development of sustained glider observations to address hurricane issues worldwide as well as additional ones related to extra-tropical storms. Extra-tropical storms, also referred to as mid-latitude cyclones, are large scale (>1,000 km) low pressure weather systems that occur in middle and high latitudes and are associated with frontal systems. The wind speeds of these storms can be as high as those associated with tropical storms but their impacts last longer because of their greater spatial extent. Due to the large-scale features, extra- tropical storms are well-represented in atmospheric models.
Hence, ocean gliders have mainly contributed to understanding the impacts of the storms on the ocean and coastal environments, particularly in terms of changes to the heat content (e.g., rapid
FIGURE 8 |Hurricane Florence, Isaac and Helene cloudtops (left to right) on September 11, 2018, with NHC best tracks behind each hurricane, NHC probability of tropical storm force winds ahead of each hurricane, and the tails of the diverse fleet of ocean glider in the picket lines transmitting upper ocean data in near-real time to forecasters.
cooling), its feedback on storm intensity, sediment resuspension and transport processes, and ecosystem response.
Ocean gliders are complementary to other storm sampling systems in their ability to relatively rapidly profile the upper ocean and transmit data to land even during the most severe storm conditions (Domingues et al., 2019). They provide
unique datasets for studies of rapid upper ocean evolution and high-value profile data for assimilation in both operational forecast and research models before, during and after storms.
Ocean glider measurements have revealed rapid changes in the distribution of water properties (temperature, salinity), and suspended sediment and chlorophyll (proxy for phytoplankton