H N P D I S C U S S I O N P A P E R E c o n o m i c s o f To b a c c o C o n t r o l P a p e r N o . 12
About this series...
This series is produced by the Health, Nutrition, and Population Family (HNP) of the World Bank’s Human Development Network. The papers in this series aim to provide a vehicle for publishing preliminary and unpolished results on HNP topics to encourage discussion and debate. The findings, interpretations, and conclusions expressed in this paper are entirely those of the author(s) and should not be attributed in any manner to the World Bank, to its affiliated organizations or to members of its Board of Executive Directors or the countries they represent. Citation and the use of material presented in this series should take into account this provisional character. For free copies of papers in this series please contact the individual authors whose name appears on the paper.
Enquiries about the series and submissions should be made directly to the Editor in Chief Alexander S. Preker (apreker@worldbank.org) or HNP Advisory Service (healthpop@worldbank.org, tel 202 473-2256, fax 202 522-3234). For more information, see also www.worldbank.org/hnppublications.
The Economics of Tobacco Control sub-series is produced jointly with the Tobacco Free Initiative of the World Health Organization. The findings, interpretations and conclusions expressed in this paper are entirely those of the authors and should not be attributed in any manner to the World Health Organization or to the World Bank, their affiliated organizations or members of their Executive Boards or the countries they represent.
The editors for the Economics of Tobacco Control papers are: Joy de Beyer (jdebeyer@worldbank.org), Emmanuel Guindon (guindone@who.int) and Ayda Yurekli (ayurekli@worldbank.org).
THE WORLD BANK
1818 H Street, NW
Washington, DC USA 20433 Telephone: 202 477 1234 Facsimile: 202 477 6391 Internet: www.worldbank.org
E-mail: feedback@worldbank.org Tobacco Free Initiative
World Health Organization
WORLD HEALTH ORGANIZATION
Regional Office for South-East Asia World Health House, Indraprastha Estate Mahatma Gandhi Marg New Delhi 110002, India Telephone: 233 70804; 233 0809-11 Facsimile: 23370197, 2337 9395 E-mail:registry@whosea.org
The Economics of Tobacco in Sri Lanka
Nisha Arunatilake and Maduwanthi Opatha
October 2003
Public Disclosure AuthorizedPublic Disclosure AuthorizedPublic Disclosure AuthorizedPublic Disclosure Authorized
THE ECONOMICS OF TOBACCO IN SRI LANKA
Nisha Arunatilake and Maduwanthi Opatha
October 2003
ii
Health, Nutrition and Population (HNP) Discussion Paper
This series is produced by the Health, Nutrition, and Population Family (HNP) of the World Bank's Human Development Network (HNP Discussion Paper). The papers in this series aim to provide a vehicle for publishing preliminary and unpolished results on HNP topics to encourage discussion and debate. The findings, interpretations, and conclusions expressed in this paper are entirely those of the author(s) and should not be attributed in any manner to the World Bank, to its affiliated organizations or to members of its Board of Executive Directors or the countries they represent. Citation and the use of material presented in this series should take into account this provisional character. For free copies of papers in this series please contact the individual authors whose name appears on the paper.
Enquiries about the series and submissions should be made directly to the Editor in Chief.
Submissions should have been previously reviewed and cleared by the sponsoring department, which will bear the cost of publication. No additional reviews will be undertaken after
submission. The sponsoring department and authors bear full responsibility for the quality of the technical contents and presentation of material in the series.
Since the material will be published as presented, authors should submit an electronic copy in a predefined format (available at www.worldbank.org/hnppublications on the Guide for Authors page) as well as three camera-ready hard copies (copied front to back exactly as the author would like the final publication to appear). Rough drafts that do not meet minimum presentational standards may be returned to authors for more work before being accepted.
The Editor in Chief of the series is Alexander S. Preker (apreker@worldbank.org; For information regarding this and other World Bank publications, please contact the HNP Advisory Services (healthpop@worldbank.org) at: Tel (202) 473-2256; and Fax (202) 522-3234.
__________________________________________________________________________
The Economics of Tobacco Control sub-series is produced jointly with the Tobacco Free Initiative of the World Health Organization. The findings, interpretations, and conclusions expressed in this paper are entirely those of the author/s and should not be attributed in any manner to the World Health Organization or to the World Bank, their affiliated organizations or to members of their Executive Boards or the countries they represent.
The editors for the Economics of Tobacco Control papers are: Joy de Beyer
(jdebeyer@worldbank.org), Emmanuel Guindon (guindone@who.int) and Ayda Yurekli (ayurekli@worldbank.org).
For free copies of papers in this series please contact the individual author whose name appears on the paper, or one of the editors. Papers are posted on the publications pages of these websites:
www.worldbank.org/hnp and www.worldbank.org/tobacco ISBN 1-932126-70-8
© 2003 The International Bank for Reconstruction and Development / The World Bank 1818 H Street, NW
Washington, DC 20433 All rights reserved.
iii
Health, Nutrition and Population (HNP) Discussion Paper ECONOMICS OF TOBACCO CONTROL PAPER NO. 12
The Economics of Tobacco in Sri Lanka
Nisha Arunatilakeaand Maduwanthi Opathab
aResearch Fellow, Institute of Policy Studies, Colombo 3, Sri Lanka
bResearch Assistant, Institute of Policy Studies, Colombo 3, Sri Lanka
Paper prepared for The World Bank in 2001
Abstract: This paper describes trends in tobacco use in Sri Lanka, assesses the economic contribution of the industry (jobs, earnings, tax revenues and trade balance), and analyses the relationship between demand for cigarettes and prices and incomes, looking at different socio- economic groups. It uses the estimated elasticities to simulate the likely impact of a tax increase on prices, government revenues and on demand, expenditures and tax burdens of different socio-economic groups.
Keywords: Sri Lanka, tobacco, tobacco tax, cigarettes, cigarette tax, economics of tobacco, economics of tobacco control, smoking, tobacco policy, price elasticity, demand for
cigarettes, prevalence, bidi, cigars, tobacco tax revenues, tobacco industry emplo yment, tobacco industry wages, tobacco farming.
Disclaimer: The findings, interpretations and conclusions expressed in the paper are entirely those of the authors, and do not represent the views of the World Bank or the World Health Organization, their Executive Directors, or the countries they represent.
Correspondence Details: Nisha Aruntilake, Institute of Policy Studies, 99 St Michael’s Road, Colombo 3, Sri Lanka. Tel: 94-1- 431 368; Fax: 94-1- 431 395. Email: nisha@ips.lk
iv
v
TABLE OF CONTENTS
NOTE FROM REGIONAL DIRECTOR, OFFICE FOR SOUTH-EAST ASIA, WORLD HEALTH ORGANIZATION ...VII FOREWORD... IX ACKNOWLEDGEMENTS ... XI SUMMARY... XIII
1. INTRODUCTION... 1
2. TOBACCO CONSUMPTION TRENDS... 1
2.1 CONSUMPTION OF DIFFERENT TYPES OF TOBACCO PRODUCTS...3
2.2 CURRENT TOBACCO USERS BY AGE CATEGORY AND TYPE...3
2.3 CURRENT SMOKERS BY INCOME CATEGORY...4
2.4 CURRENT SMOKERS BY EDUCATION CATEGORY...5
2.5 GOVERNMENT POLICY AND TRENDS IN CONSUMPTION LEVELS...6
3. OVERVIEW OF THE TOBACCO INDUSTRY IN SRI LANKA... 8
3.1. EMPLOYMENT...8
3.2 AVERAGE WAGES AND SALARIES FROM TOBACCO...14
3.3 TOBACCO TAXES...15
3.4 REVENUE FROM THE TOBACCO INDUSTRY...17
3.5 TOBACCO TRADE EARNINGS...19
3.6 RAW AND MANUFACTURED TOBACCO PRODUCTION...20
4. ECONOMIC ANALYSIS OF TOBACCO DEMAND IN SRI LANKA ... 22
4.1 INTRODUCTION...22
4.2 DATA, SPECIFIC AIMS, METHODOLOGY AND MODELS...22
4.3 RESULTS...26
4.4 POLICY SIMULATIONS...32
4.5 DISCUSSION...34
REFERENCES... 35
List of Tables Table 1. Profile of smoking prevalence in Sri Lanka by sex, 1991 and 2000 ... 2
Table 2. Profile of current smokers by type – 1991... 3
Table 3. Current male tobacco users by age group, 1991 and 2000 ... 4
Table 4. Prevalence of current male smokers by income category, 1991... 5
Table 5. Prevalence of current male tobacco users by income category, 1999 ... 5
vi
Table 6. Current male smokers by education category, 1991 and 2000 ... 6
Table 7. Tobacco leaf suppliers to CTC ... 9
Table 8. Labor requirement for cultivating and curing tobacco (days per hectare)... 10
Table 9. Tobacco cultivation by season and type of tobacco leaf (hectares)... 10
Table 10. Employment created by tobacco farms... 11
Table 11. Employment at CTC, 1990–1997 ... 12
Table 12. Activity in the tobacco industry (establishments with more than 5 people)... 13
Table 13. Wages and salaries in the tobacco industry by year ... 15
Table 14. Excise taxes on tobacco according to categories (Rs.) ... 16
Table 15. Duty on imports ... 16
Table 17. Government revenue from direct and indirect levies (Rs. million) ... 18
Table 18. Trade in manufactured and raw tobacco products (Rs. millions) ... 19
Table 19. Tobacco cultivation by season and type of tobacco leaf (hectares)... 20
Table 20. Tobacco cultivation by season and type of tobacco leaf (metric tonnes) ... 20
Table 21. Production of cigarettes by brand (millions of sticks)... 21
Table 22. Estimated bidi production... 21
Table 23. Means and descriptions of variables used in the analysis... 26
Table 24. Results of the tobacco use participation equation (logit model)... 29
Table 25. Results of the conditional demand equation... 30
Table 26. Total price elasticity by expenditure group ... 31
Table 27. Total income elasticity by expenditure group ... 31
Table 28. The impact of price increases on tobacco use prevalence by income quintile 32 Table 29. The impact of price increases on conditional demand by income quintile... 32
Table 30. The effect of price increases on household expenditure on tobacco ... 33
List of Figures Figure 1. Tobacco Price Index and General Consumer Price Index, 1980-2001………....7
vii
NOTE FROM REGIONAL DIRECTOR, OFFICE FOR SOUTH-EAST ASIA, WORLD HEALTH ORGANIZATION
The trend in tobacco consumption in many developing countries is worrying. This is not only because of the millions of deaths and related suffering that it involves, but also due to its negative impact on economic development. Experiences from many countries have shown that cost effective tobacco control measures can be taken that could bring net economic gains for the country. Proven, cost-effective measures include: public education and information; a ban on tobacco advertising; tobacco smuggling deterrence and increased tobacco taxes. All these measures can be incorporated in national anti- tobacco legislation. Studies and research from countries around the world have revealed that an increase in tax on tobacco products is perhaps the most effective tool for tobacco control, and is especially effective in reducing tobacco use among young people and people with low incomes. Higher tobacco taxes can help a country in a number of ways – by generating additional revenue, reducing tobacco use leading to less
tobacco-related morbidity and mortality and reduced expenditure on treatment of tobacco-related diseases.
Effective collaboration between health and finance ministries is essential to address
appropriately the economic and fiscal aspects of tobacco control. Such collaboration could ensure improved health for millions of people by protecting them and their families from the harmful effects of tobacco use.
I am confident that the findings of the study initiated by World Health Organization and World Bank will encourage the policy makers, in particular, in the health and finance ministries, to take appropriate and coordinated action for tobacco control.
Dr Uton Muchtar Rafei Regional Director World Health Organization Regional Office for South-East Asia 10 October, 2003
viii
ix
FOREWORD
In 1999, the World Bank published “Curbing the Epidemic: governments and the economics of tobacco control”, which summarizes the trends in global tobacco use and the resulting immense and growing burden of disease and premature death. By 1999, there were already 4 million deaths from tobacco each year, and this huge number is projected to grow to 10 million per year by 2030, given present trends in tobacco consumption. Already about half of these deaths are in high- income countries, but recent and continued increases in tobacco use in the developing world is causing the tobacco-related burden to shift increasingly to low- and middle- income countries.
By 2030, seven of every ten tobacco-attributable deaths will be in developing countries.
“Curbing the Epidemic” also summarizes the evidence on the set of policies and interventions that have proved to be effective and cost-effective in reducing tobacco use, in countries around the world.
Tax increases that raise the price of tobacco products are the most powerful policy tool to reduce tobacco use, and the single most cost-effective intervention. They are also the most effective intervention to persuade young people to quit or not to start smoking. This is because young people, like others with low incomes, tend to be highly sensitive to price increases.
Why are these proven cost effective tobacco control measures –especially tax increases– not adopted or implemented more strongly by governments? Many governments hesitate to act decisively to reduce tobacco use, because they fear that tax increases and other tobacco control measures might harm the econo my, by reducing the economic benefits their country gains from growing, processing, manufacturing, exporting and taxing tobacco. The argument that “tobacco contributes revenues, jobs and incomes” is a formidable barrier to tobacco control in many countrie s. Are these fears supported by the facts?
In fact, these fears turn out to be largely unfounded, when the data and evidence on the
economics of tobacco and tobacco control are examined. The team of about 30 internationally recognized experts in economics, epidemiology and other relevant disciplines who contributed to the analysis presented in “Curbing the Epidemic” reviewed a large body of existing evidence, and concluded strongly that in most countries, tobacco control would not lead to a net loss of jobs and could, in many circumstances actually generate new jobs. Tax increases would increase (not decrease) total tax revenues, even if cigarette smuggling increased to some extent.
Furthermore, the evidence show that cigarette smuggling is caused at least as much by general corruption as by high tobacco product tax and price differentials, and the team recommended strongly that governments not forego the benefits of tobacco tax increases because they feared the possible impact on smuggling, but rather act to deter, detect and punish smuggling.
Much of the evidence presented and summarized in “Curbing the Epidemic” was from high- income countries. But the main battleground against tobacco use is now in low- and middle- incomes countries. If needless disease and millions of premature deaths are to be prevented, then it is crucial that developing counties raise tobacco taxes, introduce comprehensive bans on all advertising and promotion of tobacco products, ban smoking in public places, inform their
x
citizens well about the harm that tobacco causes and the benefits of quitting, and provide advice and support to help people who smoke and chew tobacco, to quit.
In talking to policy- makers in developing countries, it became clear that there was a great need for country-specific analytic work, to provide a basis for policy making, within a sound
economic framework. So the World Bank and the Tobacco Free Initiative of the World Health Organization (as well as some of the WHO regional offices and several other organizations, acting in partnership or independently) began to commission and support analysis of the economics of tobacco and tobacco control in many countries around the world.
The report presented in this Economic of Tobacco Discussion Paper makes a va luable
contribution to our understanding of the issues and likely economic impact of tobacco control in a specific country-setting. Our hope is that the information, analysis and recommendations will prove helpful to policy makers, and help result in stronger policies to reduce the unnecessary harm caused by tobacco use.
Joy de Beyer
Tobacco Control Coordinator Health, Nutrition and Population World Bank
xi
ACKNOWLEDGEMENTS
This study was supported by the World Bank, Washington DC, and the Institute of Policy Studies of Sri Lanka. The authors are grateful to the World Bank for providing technical assistance and for publishing the report as an HNP Discussion Paper.
xii
xiii
SUMMARY
Tobacco use and policies to discourage it
Data on tobacco use rely on an island-wide survey in 2000 (SLIS), which provides national coverage but only limited information, and a more detailed 1991 survey that was confined to three districts. The 1991 survey found that 38%-51% of men (lowest in Colombo district, higher in the farming areas) and 1% of women currently used tobacco. Small percentages (5-9% for men) were previous users who had quit. The 2000 national survey found similar differentials across districts, but much lower prevalence among men (24% nationally, 17-27% for the three districts) and a worrying rise among women to 6% nationally, varying from 3-8% in the three districts. Prevalence is highest in the 30-60 age groups, amongst people with low education, and those in the second and third lowest expenditure quintiles.
Government policy measures that reduce tobacco use have become stronger during the 1990s, especially higher taxes, that have helped raise the real price (adjusted for inflation) of tobacco products, especially in the late 1990s. Advertising bans are partial, but the TV and radio do not carry tobacco advertisements, and sport sponsorship is said to have ended. However, there is substantial point-of-sale advertising and promotions targeting young people.
The Tobacco Industry in Sri Lanka
Farming: The number of registered tobacco growers rose during the 1980s and most of the 1990s, but fell sharply in 1998 and 1999. It is estimated that tobacco growing provides between 5,355 and 16,580 full-time equivalent jobs (the range depends on the labor requirements per hectare), which is just a fraction of one percent of the total labor force (0.08-0.25%). Earnings from tobacco farming and profitability vary widely. The industry estimates indirect farm-related jobs at 600 (fertilizer and pesticide supply etc.) The land area under tobacco halved between 1990 and 2000, with a corresponding fall in leaf volume. Yields have improved marginally.
Employment in tobacco manufacturing has fallen since 1990, from 6-7% of all manufacturing employment to 4-5% (the lower number refers to employment, the higher number also includes others engaged in the sector). Production volumes were fairly steady averaging around 5.2 billion sticks between 1995 and 1999, with a marked fall to 4.6 billion in 2000. An estimated approximately 3 billion bidis are produced annually as well. There is no information on illegal production of so-called "white cigarettes”. Average salaries and wages in the tobacco industry are about half the level for all manufacturing, and have fallen slightly in real terms during the 1990s. Manufacturing sector indirect tobacco employment is estimated to be small, of the order of 150 people. There are about 41,000 retailers that sell tobacco products, which typically account for only a small part of their total turnover.
Prior to 1990, the only tobacco-specific taxes were an excise on locally grown leaf. In 1990, a new (specific) excise tax was introduced on cigarettes and pipe tobacco, and the rates were increased in 1994, and for cigarettes, again in 1995, 1998 and 2000. From 1995, the excise was differentiated by length of cigarette. By the end of 2000, excises accounted for about 77% of the retail price, and total cigarette revenues had risen to nearly 19 million Rupees. In real terms, the
xiv
1995 excise rate increase almost doubled the total revenue generated. Throughout the 1990s, tobacco has provided about 10% of total government revenues.
Export values of raw and manufactured tobacco have fallen, making Sri Lanka a net importer in tobacco trade, with a corresponding outflow of foreign exchange.
Analysis of determinants of tobacco product demand in Sri Lanka
A two-part demand model was estimated of the decision to smoke or not, and then the quantity of tobacco consumed, as a function of price, income, gender, type of occupation, education, age, and geographic location. Income was positively related to the probability of smoking, especially at low-income levels, while those with less education were more likely to smoke. Location was also highly significant. For those who smoke, higher prices are clearly (and statistically
significantly) associated with lower consumption. Higher income in the middle- income range and higher education are associated with falling consumption, as in many other countries.
People in the lower expenditure quintiles are clearly much more price-responsive to price changes; a 10% real price rise would cause total consumption (combining the effects of prevalence and smoking intensity) to fall by around 6% for lower income people, and 3% for higher income groups.
Simulations of the likely effects of price increases on consumption and tax revenues showed that large real price increases (at least 50%) are needed for a perceptible effect on prevalence rates.
But price increases have a much stronger effect on the quantity of cigarettes smoked. The poorest households spent an average of just over 3% of total expenditures on tobacco products.
A 10% price rise would cause a very small increase in the proportion of expenditures allocated to tobacco, but larger price rises would cause it to fall. Even very large price increases (100%) have negligible effects on the percentage of total expenditures allocated to tobacco products among high income groups, who spend an average of 0.6% of total expenditures on tobacco.
The study concludes that there is room for large real price increases that would benefit low- income families especially, by inducing them to smoke much less. Tax increases would not reduce total tax revenues, because the fall in consumption would be proportionately less than the tax increase. It also concludes that more public education on the harm caused by tobacco and the benefits of quitting or never starting to smoke is needed, especially targeted to less-educated people. There is also much still to do to prevent promotion and marketing to young people in Sri Lanka.
1
1. INTRODUCTION
The framework used for public policy on tobacco evolved in the 20th century from a foundation of morality to a foundation of health consequences. Today, public policy on tobacco is being argued on the basis of economics. This is evident in the history of the national policy on tobacco in Sri Lanka. Until the beginning of the last decade, government policy on tobacco control was limited to health warnings on cigarette packets and an excise tax on manufactured cigarettes. In 1990 the government introduced a tax on locally grown tobacco leaf. Since then, the
government has increased the tax annually on tobacco leaf, manufactured cigarettes, and pipe tobacco, mainly to increase revenue.
Industry has resisted the government’s attempts to curb the growth in tobacco use using economic arguments. In this context, this report undertakes a timely and important economic evaluation of the tobacco industry in Sri Lanka in terms of contributions made by the industry in providing employment, government revenue, and export earnings.
The structure of the report is as follows. Descriptive statistics on smoking behavior in Sri Lanka and trends are presented. The next section looks at the economic contribution of the industry.
Direct and indirect employment in the tobacco industry is reported, and salaries and wages earned by individuals engaged in the industry are investigated. The tobacco taxes levied by the Sri Lankan government are described and their contribution to government revenue evaluated.
Finally, an analysis of tobacco trade earnings, as well as raw and manufactured tobacco production in the country is presented.
Section 4 offers an in-depth economic analysis of the demand for tobacco products in Sri Lanka.
Price and income elasticities are estimated for households in different economic conditions.
These estimates describe the effect of price and income on tobacco demand. Since taxes are proportionate to household expenditure on tobacco, it is possible to simulate the effects of tobacco price increases on household expenditures on tobacco and estimate the corresponding effects on household tax burdens and government revenue.
2. TOBACCO CONSUMPTION TRENDS
Detailed information on the smoking habits of the Sri Lankan population over age 65 is not widely available. The data presented in this section were obtained from two surveys:
• Consumption, Production and Distribution Patterns of Tobacco, Alcohol and Other Drugs Among the Sri Lankan Population 1992, referred to as TAD 1992, which collected 1991 data (Alcohol and Drug Information Center 1992)
• Sri Lanka Integrated Survey 1999-2000, known as SLIS 2000, which collected 2000 data (World Bank 2000).
The TAD survey collected detailed information on the smoking behavior of individuals.
However, it obtained information on three Sri Lankan districts only: Colombo, Hambantota, and
2
Polonnaruwa.1 The SLIS (2000) survey was an island-wide surve y weighted to obtain a nationally representative sample, but provides information only on the current tobacco use of individuals, including both smoking and chewing. Hereafter in this report, current smokers includes individuals who smoke any form of tobacco product, including cigarettes, bidi, cigar, and pipes. Individuals who smoke or chew tobacco are referred to as tobacco users.2 Given the differences in coverage, a straightforward comparison of the results of these two surveys is difficult, but approximate comparisons of smoking patterns are provided where possible.
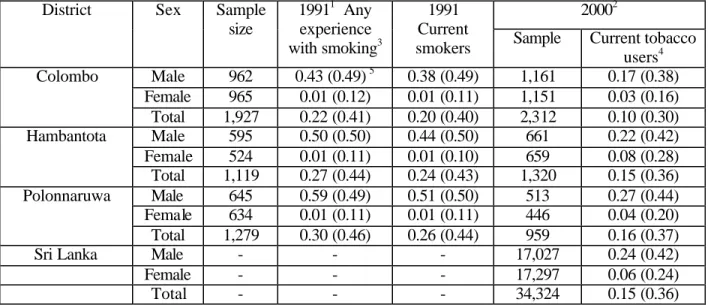
According to the TAD 1992 survey, in 1991, 43% of males in Colombo had smoked at some time in their lives, and 38% were current smokers. In comparison, in 2000 only 17% of males in Colombo were current tobacco users. Given that 2000 data provide a broader measure of
tobacco use, including use of tobacco for chewing, these statistics clearly show that tobacco use among men declined over the years. Statistics for the other two distric ts and for females are given in Table 1. The current prevalence of tobacco use throughout Sri Lanka in 2000 was 24%
for males, and 6% for females.
Table 1. Profile of smoking prevalence in Sri Lanka by sex, 1991 and 2000 20002
District Sex Sample
size
19911 Any experience with smoking3
1991 Current
smokers Sample Current tobacco users4 Male 962 0.43 (0.49) 5 0.38 (0.49) 1,161 0.17 (0.38) Female 965 0.01 (0.12) 0.01 (0.11) 1,151 0.03 (0.16) Colombo
Total 1,927 0.22 (0.41) 0.20 (0.40) 2,312 0.10 (0.30) Male 595 0.50 (0.50) 0.44 (0.50) 661 0.22 (0.42) Female 524 0.01 (0.11) 0.01 (0.10) 659 0.08 (0.28) Hambantota
Total 1,119 0.27 (0.44) 0.24 (0.43) 1,320 0.15 (0.36) Male 645 0.59 (0.49) 0.51 (0.50) 513 0.27 (0.44) Female 634 0.01 (0.11) 0.01 (0.11) 446 0.04 (0.20) Polonnaruwa
Total 1,279 0.30 (0.46) 0.26 (0.44) 959 0.16 (0.37)
Sri Lanka Male - - - 17,027 0.24 (0.42)
Female - - - 17,297 0.06 (0.24)
Total - - - 34,324 0.15 (0.36)
1. Tabulated from TAD 1992 survey data.
2. Tabulated from SLIS 2000 data.
3. Any tobacco experience refers to both past and present smokers.
4. Tobacco users refer to individuals who consume tobacco in any form. This includes chewing tobacco.
5. Standard deviations are given in parentheses.
1 The capital city of Sri Lanka, also called Colombo, is in Colombo district, a coastal district in the southwest corner of the island.
Colombo district is more urbanized and developed than Sri Lanka’s other 21 districts. Hambantota is also a coastal district in the South, Polonnaruwa is in the middle of the country. Both are rural farming districts.
2 Since tobacco smokers are a subset of tobacco users at any one point in time, the prevalence of tobacco smokers must be smaller or equal to the prevalence of tobacco users.
3
2.1 Consumption of Different Types of Tobacco Products
Currently in Sri Lanka, tobacco is consumed in two forms: smoking and chewing. Chewing tobacco is used mainly as a complement to betel. Smoking is mainly done in the form of cigarettes, bidis, and cigars. Tobacco is also smoked in pipes, but in very small quantities.
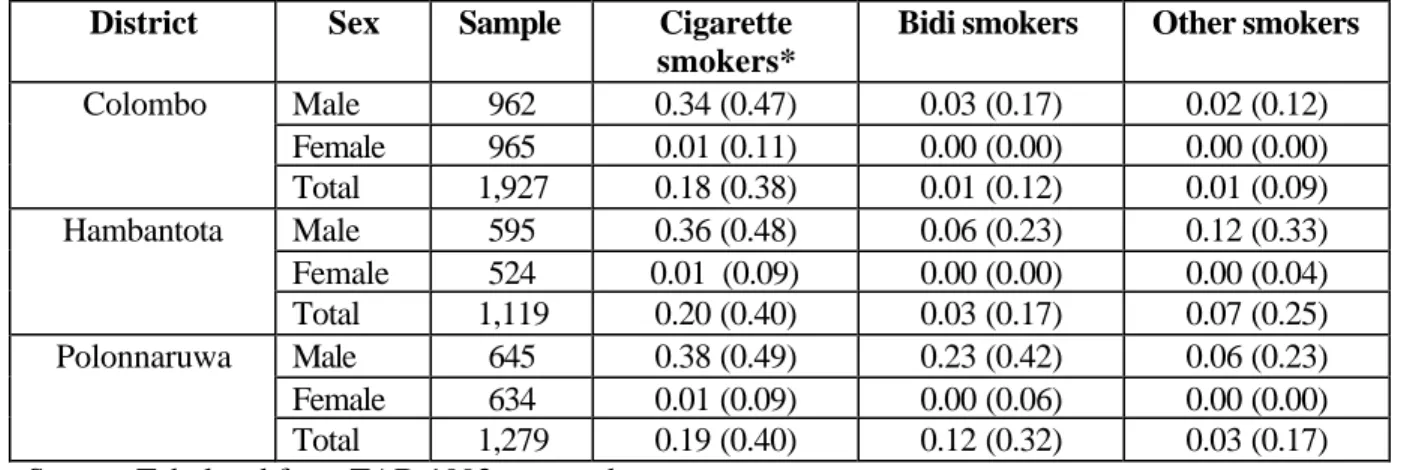
According to the TAD 1992 survey, the breakdown among the current smokers in Colombo was:
34% smoked cigarettes, 3% smoked bidis, and 2% smoked other types of tobacco, such as cigars and pipes.3 These and corresponding statistics for the other two districts and for females are presented in Table 2. The prevalence of current smoking for both cigarettes and bidis was less for Colombo, at statistically significant levels with 90% confidence limits. The SLIS 2000 survey does not provide detailed information on consumption of different types of tobacco products.
Table 2. Profile of current smokers by type – 1991
District Sex Sample Cigarette smokers*
Bidi smokers Other smokers
Male 962 0.34 (0.47) 0.03 (0.17) 0.02 (0.12)
Female 965 0.01 (0.11) 0.00 (0.00) 0.00 (0.00) Colombo
Total 1,927 0.18 (0.38) 0.01 (0.12) 0.01 (0.09)
Male 595 0.36 (0.48) 0.06 (0.23) 0.12 (0.33)
Female 524 0.01 (0.09) 0.00 (0.00) 0.00 (0.04) Hambantota
Total 1,119 0.20 (0.40) 0.03 (0.17) 0.07 (0.25)
Male 645 0.38 (0.49) 0.23 (0.42) 0.06 (0.23)
Female 634 0.01 (0.09) 0.00 (0.06) 0.00 (0.00) Polonnaruwa
Total 1,279 0.19 (0.40) 0.12 (0.32) 0.03 (0.17) Source: Tabulated from TAD 1992 survey data.
Notes: Standard deviations are given in parentheses. “Other smokers" include cigar and pipe smokers.
2.2 Current Tobacco Users by Age Category and Type
The prevalence patterns of smoking by age categories in 1991 were similar in all three districts under review, with the highest levels of smoking prevalence occurring in the 30 to 60 age groups (see Table 3). Even when the broader definition of tobacco use for 2000 is compared with current smokers, the prevalence rates appear to have declined from 1991 to 2000 in almost all age categories, except for the oldest. The decline in prevalence rates is greatest for the younger age groups.
3 Some individuals smoked more than one type of tobacco product; as a result the percentages sum to slightly more that the 38%
of current smokers.
4
Table 3. Current male tobacco users by age group, 1991 and 2000
1991 2000
District Age
group Sample Cigarette smokers
Current smokers
Sample Current tobacco users 0 to 20 255 0.02 (0.14) 0.02 (0.15) 388 0.00 (0.06) 20+ to 30 255 0.25 (0.44) 0.31 (0.46) 237 0.15 (0.35) 30+ to 40 171 0.56 (0.50) 0.60 (0.49) 173 0.25 (0.43) 40+ to 50 116 0.67 (0.47) 0.71 (0.46) 139 0.33 (0.47) 50+ to 60 90 0.61 (0.49) 0.64 (0.48) 113 0.33 (0.47) 60 plus 75 0.39 (0.49) 0.52 (0.50) 111 0.38 (0.49) Colombo
Total 962 0.34 (0.47) 0.38 (0.49) 1,161 0.17 (0.38) 0 to 20 193 0.04 (0.19) 0.08 (0.28) 290 0.00 (0.05) 20+ to 30 135 0.47 (0.50) 0.50 (0.50) 122 0.15 (0.36) 30+ to 40 116 0.68 (0.47) 0.71 (0.46) 71 0.35 (0.48) 40+ to 50 57 0.63 (0.49) 0.74 (0.44) 88 0.63 (0.49) 50+ to 60 47 0.40 (0.50) 0.70 (0.46 47 0.59 (0.50) 60 plus 47 0.23 (0.43) 0.51 (0.51) 43 0.53 (0.51) Hambantota
Total 595 0.36 (0.48) 0.44 (0.50) 661 0.22 (0.42) Polonnaruwa 0 to 20 124 0.10 (0.30) 0.13 (0.34) 217 0.00 (0.05) 20+ to 30 183 0.39 (0.49) 0.45 (0.50) 105 0.30 (0.46) 30+ to 40 138 0.63 (0.48) 0.72 (0.45) 65 0.62 (0.49) 40+ to 50 92 0.49 (0.50) 0.73 (0.45) 64 0.58 (0.50) 50+ to 60 52 0.33 (0.47) 0.63 (0.49) 36 0.66 (0.48) 60 plus 56 0.21 (0.41) 0.48 (0.50) 26 0.41 (0.50) Total 645 0.38 (0.49) 0.51 (0.50) 513 0.27 (0.44)
0 to 20 124 - - 6,820 0.01 (0.07)
20+ to 30 183 - - 3,055 0.16 (0.37)
30+ to 40 138 - - 2,256 0.43 (0.49)
40+ to 50 92 - - 1,974 0.52 (0.50)
50+ to 60 52 - - 1,510 0.53 (0.50)
60 plus 56 - - 1,412 0.45 (0.50)
Sri Lanka
Total 645 - - 17,027 0.24 (0.42)
Source: Tabulated from TAD 1992 survey data.
Notes: Standard deviations are given in parentheses.
2.3 Current Smokers by Income Category
The TAD 1992 survey contains individual information for five different income categories.4 Table 4 presents the prevalence of current smokers by income category and district. According to these data, the prevalence of smoking is lowest among the poorest individuals.
4 In 1991, average per capita income was Rs. 21,564 annually, or Rs. 1,797 monthly. The average exchange rate for 1991 was 41.20 rupees per US$, so this was equivalent to US$523 per capita per year, and US$43.62 per month.
5
Table 4. Prevalence of current male smokers by income category, 1991 District
Income Group
Colombo Hambantota Polonnaruwa Less than 1,000 0.21 (0.40) 0.34 (0.47) 0.38 (0.49) 1,001 – 2,000 0.60 (0.49) 0.72 (0.45) 0.70 (0.46) 2,001 – 3,000 0.62 (0.49) 0.59 (0.50) 0.59 (0.50) 3,001 – 5,000 0.45 (0.50) 0.68 (0.48) 0.57 (0.50) More than 5,000 0.51 (0.50) 0.44 (0.53) 0.62 (0.50) Source: Tabulated from TAD 1992 survey data.
Notes: Standard deviations are given in parentheses. Income groups are categorized according to monthly income.
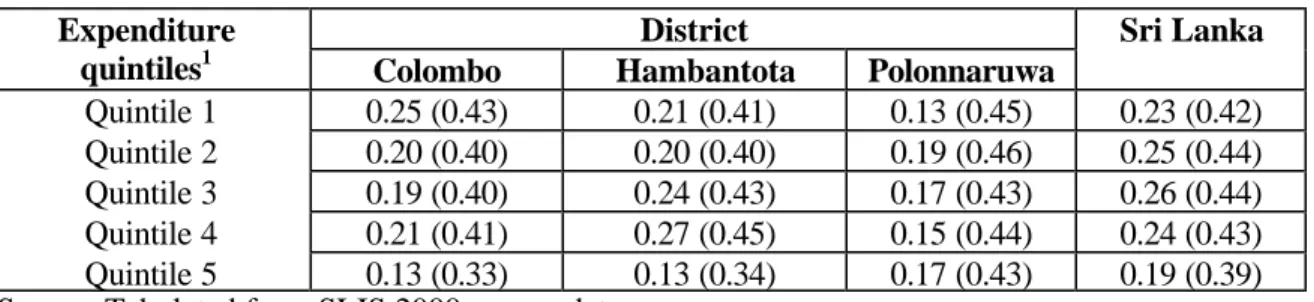
Table 5 presents the prevalence of tobacco use by expenditure quintile. The expenditure quintiles were obtained by grouping the households by their per capita regional price-adjusted expenditures. According to this data, the all- island tobacco use prevalence levels are about the same for all quintiles except for the highest, where prevalence level is lower. Tobacco use prevalence patterns by expenditure quintiles, however, vary from district to district, with no consistent pattern in the two rural districts. Colombo has the highest prevalence in the lowest quintile, and considerably lower prevalence in the highest quintile than any other quintile.
Table 5. Prevalence of current male tobacco users by income category, 1999 District
Expenditure
quintiles1 Colombo Hambantota Polonnaruwa
Sri Lanka Quintile 1 0.25 (0.43) 0.21 (0.41) 0.13 (0.45) 0.23 (0.42) Quintile 2 0.20 (0.40) 0.20 (0.40) 0.19 (0.46) 0.25 (0.44) Quintile 3 0.19 (0.40) 0.24 (0.43) 0.17 (0.43) 0.26 (0.44) Quintile 4 0.21 (0.41) 0.27 (0.45) 0.15 (0.44) 0.24 (0.43) Quintile 5 0.13 (0.33) 0.13 (0.34) 0.17 (0.43) 0.19 (0.39) Source: Tabulated from SLIS 2000 survey data.
Notes: Standard deviations are given in parentheses. Income groups are categorized according to monthly per capita expenditure. The threshold per capita levels for different expenditure quintiles are as follows: 1) less than or equal to Rs.1,062; 2) more than Rs. 1,062, but less than or equal to Rs. 1,383; 3) more than Rs. 1,383, but less than or equal to Rs. 1,746; 4) more than Rs. 1,746, but less than or equal to Rs. 2,365; 5) more than Rs. 2,365.
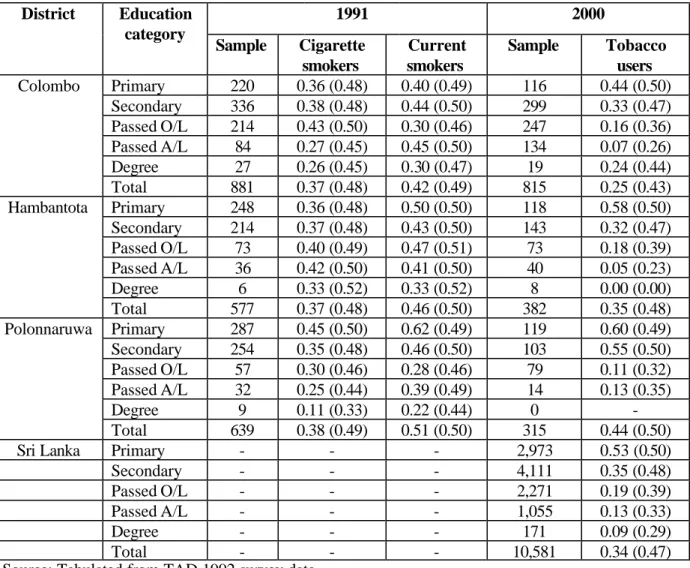
2.4 Current Smokers by Education Category
Table 6 presents male smoking prevalence by education category. Bidis were popular among the lesser-educated individuals in all districts, while the pattern of cigarette consumption was more or less similar among males in all education categories in 1991.
The prevalence of tobacco use declined sharply for more educated individuals from 1991 to 1999, while for the least-educated group it has roughly remained the same. The prevalence of tobacco use for Sri Lanka in 2000 is highest in the lowest education group and lowest in the highest education group.
6
Table 6. Current male smokers by education category, 1991 and 2000
1991 2000
District Education category
Sample Cigarette smokers
Current smokers
Sample Tobacco users Primary 220 0.36 (0.48) 0.40 (0.49) 116 0.44 (0.50) Secondary 336 0.38 (0.48) 0.44 (0.50) 299 0.33 (0.47) Passed O/L 214 0.43 (0.50) 0.30 (0.46) 247 0.16 (0.36) Passed A/L 84 0.27 (0.45) 0.45 (0.50) 134 0.07 (0.26)
Degree 27 0.26 (0.45) 0.30 (0.47) 19 0.24 (0.44)
Colombo
Total 881 0.37 (0.48) 0.42 (0.49) 815 0.25 (0.43)
Primary 248 0.36 (0.48) 0.50 (0.50) 118 0.58 (0.50) Secondary 214 0.37 (0.48) 0.43 (0.50) 143 0.32 (0.47) Passed O/L 73 0.40 (0.49) 0.47 (0.51) 73 0.18 (0.39) Passed A/L 36 0.42 (0.50) 0.41 (0.50) 40 0.05 (0.23)
Degree 6 0.33 (0.52) 0.33 (0.52) 8 0.00 (0.00)
Hambantota
Total 577 0.37 (0.48) 0.46 (0.50) 382 0.35 (0.48)
Primary 287 0.45 (0.50) 0.62 (0.49) 119 0.60 (0.49) Secondary 254 0.35 (0.48) 0.46 (0.50) 103 0.55 (0.50) Passed O/L 57 0.30 (0.46) 0.28 (0.46) 79 0.11 (0.32) Passed A/L 32 0.25 (0.44) 0.39 (0.49) 14 0.13 (0.35)
Degree 9 0.11 (0.33) 0.22 (0.44) 0 -
Polonnaruwa
Total 639 0.38 (0.49) 0.51 (0.50) 315 0.44 (0.50)
Sri Lanka Primary - - - 2,973 0.53 (0.50)
Secondary - - - 4,111 0.35 (0.48)
Passed O/L - - - 2,271 0.19 (0.39)
Passed A/L - - - 1,055 0.13 (0.33)
Degree - - - 171 0.09 (0.29)
Total - - - 10,581 0.34 (0.47)
Source: Tabulated from TAD 1992 survey data.
Notes: Standard deviations are given in parentheses. Primary: individuals who have at most had six years of formal education. Secondary:
Individuals who have had seven to 10 years of formal education. Passed O/L: individuals who have passed the government- conducted ordinary level examination. Passed A/L: individuals who have passed the government-conducted advance level examination. Degree: individuals who have obtained degrees or have had some type of technical training. Education information was missing for 183 individuals; as a result the total smoking data by district may not correspond with data in Table .2.
2.5 Government Policy and Trends in Consumption Levels
As can be seen in the data presented in Tables 1 to 6, the prevalence rates of tobacco use have declined over the last nine years. This can be explained in part by the tobacco policy changes during the last decade in Sri Lanka. Before 1990, government anti-tobacco policy was limited to health warnings on cigarette packets and an excise tax imposed on manufactured cigarettes. In 1990, the government introduced a tax on locally grown tobacco leaf. Subsequently, the government has increased the tax on tobacco leaf, manufactured cigarettes, and pipe tobacco annually, mainly with the objective of increasing government revenue. Excise tax rates on manufactured tobacco products have increased substantially over the years. In January 1995, the average excise tax on cigarettes was 27.6% of the retail sales price; by December 2000 this had
7
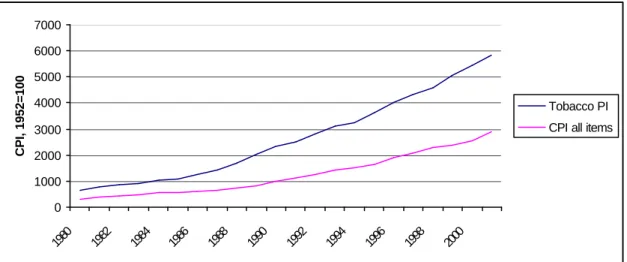
increased to 76.8%. Figure 1 compares price increases for tobacco products to the general consumer price index. The gap between the two lines shows clearly the rise in real cigarette prices, especially in the 1990s. The average tobacco price rose by 90% between January 1995 and the end of 1999, from US$3 per pack to US$5.69. All other prices rose 45% during the same period, so tobacco prices rose 45% in real terms.
Figure 1. Tobacco Price Index and General Consumer Price Index, 1980-2001.
0 1000 2000 3000 4000 5000 6000 7000
1980 1982 1984 1986 1988 1990 1992 1994 1996 1998 2000
CPI, 1952=100
Tobacco PI CPI all items
Source: Department of Census and Statistics, Colombo.
Note: The base year for the CPI (all items and tobacco) is 1952. The relative values would remain the same if a later base year were used (but the index numbers would change).
Other policy measures include a restriction on tobacco sales to children under 16, and a limit of 16 milligrams of nicotine content on all tobacco products sold. In 1997 the president appointed a special Task Force on Tobacco and Alcohol Policy to recommend policy measures with a view to improving the health and well-being of all Sri Lankans and reducing tobacco-related harm.
Most tobacco control measures in the past have focused on anti-tobacco advertisements and restriction of advertising and promotional campaigns. Currently there is no legislation banning advertising of tobacco products. However, all radio and television stations, led by the two public radio and television stations (Sri Lanka Broadcasting Corporation and Sri Lanka Rupavahini Corporation), by consensus do not carry tobacco-related advertisements. Until recently,
newspapers were the only public medium through which tobacco products were advertised. The Ceylon Tobacco Company introduced a self-regulated advertising code in March 2000, which stopped all brand advertising in the media. As a result, advertising in the print media and on billboards, and sponsorship of sporting events has ceased. However tobacco products, especially cigarettes, continue to be advertised at the point of sales in shops, on vehicles used for
distribution of tobacco products, at discos and clubs frequented mainly by young adults, and through promotional campaigns.
8
3. OVERVIEW OF THE T OBACCO INDUSTRY IN SRI LANKA
3.1. Employment
The tobacco industry consists of three main activities: leaf growing and initial processing
(cultivation); manufacturing; and distribution and retailing. In turn, these three activities consist of many support elements and together form a chain of linked activities.
The nucleus of the industry is manufacturing. This trans forms leaf and other inputs into manufactured tobacco products. The leaf suppliers to the manufacturers, the tobacco farmers, form the backward link of the tobacco industry chain. Other inputs include paper and packaging, chemicals and other additives. Services to get the final product to the consumer, such as
distribution and retailing, form the forward links.
Employment in all activities in the tobacco chain is considered direct employment. Employment created by activities in the goods and services needed from other sectors of the economy is considered indirect employment. For example, the providers of fuel (wood or paddy husks) needed to cure tobacco leaf are not directly employed in the industry, but the tobacco industry is part of their market.
Ceylon Tobacco Company (CTC), a subsidiary of the multinational British American Tobacco (BAT), is the only registered company in Sri Lanka that produces cigarettes. In addition, there are a number of bidi and cigar manufacturers in the country, but data on the exact number are difficult to obtain. The All Sri Lanka Bidi Manufacturer’s Society has a membership of 64 bidi manufacturers. Most are large-scale bidi manufacturers with a manufacturing capacity of about 10 million bidis per month (approximately, 0.8 kilograms of cured and crushed tobacco is needed to make 1,000 bidis). In addition, there are a number of small- scale bidi manufacturers and illicit
“white cigarette” manufacturers.5
Employment in Tobacco Cultivation
In Sri Lanka, tobacco is grown year-round in the two seasons: the Maha (November to May) and the Yala (May to November). The time span from preparing nurseries to cultivating and
removing tobacco plants is roughly six to seven months. The labor requirements for tobacco cultivation vary widely during this time, with peak employment occurring at the initial and harvesting phases. Some tasks, such as tilling and applying fertilizers and insecticides, are now being mechanized; however, the majority of the tasks are still carried out ma nually.
Tobacco farmers can be divided into two main categories depending on the type of tobacco grown, the main markets for their produce, and the curing of tobacco leaf: farmers who grow
5 Illicit "white cigarettes" are a recent phenomenon in Sri Lanka. They look very similar to brand-name cigarettes, but are manufactured in home-based industries just as bidis are. As a result, "white cigarettes", like bidis, are not subject to the taxes imposed on brand-name cigarettes.
9
tobacco for CTC and farmers who grow tobacco for the bidi and cigar industries.6 Tobacco for CTC is heat cured in barns, while tobacco for bidis and cigars is cured in the sun. “Barn-owners”
cure tobacco from their own farms and from other farmers in the area. Farmers who sell their tobacco to barn-owners are usually referred to as “sub-growers”.7
Table 7 shows the number of barn-owners and sub-growers who are involved in growing tobacco for CTC. However, these numbers do not accurately indicate the employment created in tobacco cultivation. Most tobacco farmers grow more than one crop at a time, and employment in
tobacco cultivation is seasonal. Some farmers with big plots may need to hire labor to cultivate tobacco, while others may only be employed in the tobacco industry part-time.
Table 7. Tobacco leaf suppliers to CTC Number of registered farmers Year
Barn-owners Sub-growers
1985 3,712 27,974
1986 3,600 28,800
1987 3,420 23,840
1988 3,612 27,896
1989 3,410 27,280
1990 3,210 25,680
1991 4,150 29,050
1992 5,240 36,680
1993 5,475 32,850
1994 6,702 33,510
1995 6,336 31,680
1996 7,420 29,680
1997 8,743 34,972
1998 3,518 21,108
1999 3,412 22,156
Source: Tobacco Unit, Ministry of Agriculture
A more accurate measure of the employment created by tobacco farms is the number of full- time equivalent jobs created. In order to calculate the total labor requirements for cultivation in Sri Lanka, we first collected information on the labor requirements for a hectare of tobacco through interviews with 12 tobacco farmers from two tobacco-growing areas.8 Then total employment created by tobacco farming was calculated by multiplying that number by the number of hectares under cultivation.
6 There are also a small number of farmers who grow tobacco for chewing.
7 Tobacco barn-owners and sub-growers have to register with the Tobacco Unit of the Ministry of Agriculture. The government controls the production of tobacco by restricting the number of barn owners. Currently the Tobacco Unit of the Ministry of Agriculture is not issuing any new permits. There are a few barn-owners who have abandoned tobacco cultivation for various reasons. When possible, these farmers’ permits are transferred to new tobacco farmers. One of the main reasons for discontinuing tobacco cultivation is the unwillingness of the next generation to remain in farming.
8 Farmers were interviewed in areas around Welimada and Anuradhapura. Welimada is a small town in the mountains of Sri Lanka. Anuradhapura and the area surrounding it, is on flat land.
10
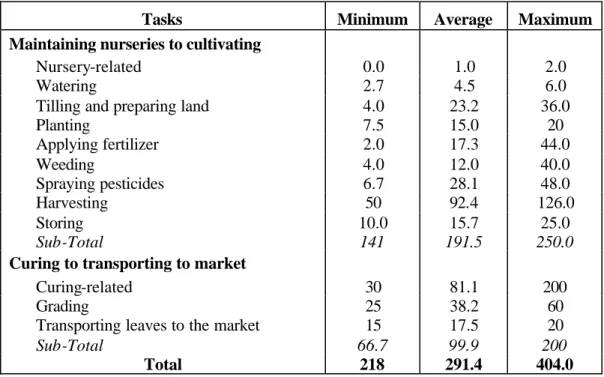
The total labor requirement from planting to curing varied among farmers from 218 to 404 person-days per hectare, with an average of 291.4 person-days per hectare over a six- to seven- month period. Assuming that a season is six-and-a-half months, or 195 days, the total labor requirement is roughly 1.1 to 2.1 persons a day.
Labor requirements varied for several reasons. Larger farms required less labor per hectare of land than smaller farms, possibly due to economies of scale. Labor requirements were greater for farms on uneven terrain. The use of machines, such as tractors for tilling land, lowered labor requirements. Some farmers maintained their own nurseries, while others purchased plants from outside nurseries, thus reducing labor requirements marginally. Labor requirements also
changed for other crops from season to season, depending on the need to apply pesticides and fertilizers, and on weather conditions. Minimum, maximum, and average labor requirements by task are presented in Table 8.
Table 8. Labor requirement for cultivating and curing tobacco (days per hectare)
Tasks Minimum Average Maximum
Maintaining nurseries to cultivating
Nursery-related 0.0 1.0 2.0
Watering 2.7 4.5 6.0
Tilling and preparing land 4.0 23.2 36.0
Planting 7.5 15.0 20
Applying fertilizer 2.0 17.3 44.0
Weeding 4.0 12.0 40.0
Spraying pesticides 6.7 28.1 48.0
Harvesting 50 92.4 126.0
Storing 10.0 15.7 25.0
Sub-Total 141 191.5 250.0
Curing to transporting to market
Curing-related 30 81.1 200
Grading 25 38.2 60
Transporting leaves to the market 15 17.5 20
Sub-Total 66.7 99.9 200
Total 218 291.4 404.0
Source: Survey results.
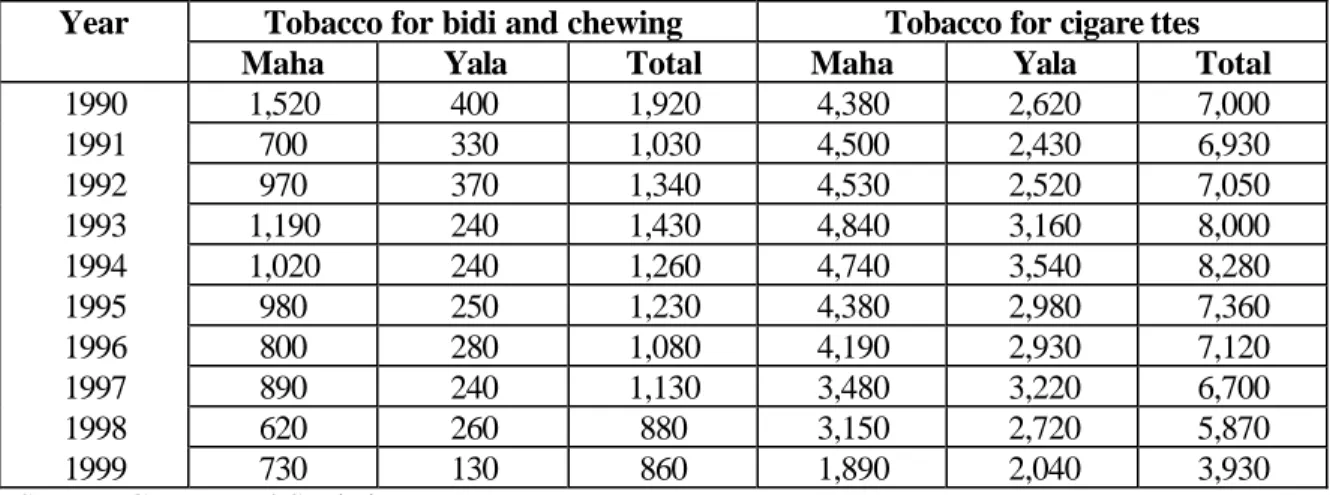
Tobacco cultivation by season and type of tobacco leaf is given in Table 9. Based on these data and the estimated labor requirement per hectare of tobacco, the number of persons employed in tobacco cultivation for three different estimates of labor requirements for a hectare of land is shown in Table 10. Accordingly, the number of persons employed by tobacco farms on a full- time equivalent basis is between 5,355 and 16,580 people (depending on the year and the estimated labor needed). Given that the total labor force in the country in 1999 was 6,673,000 persons, this amounts to 0.08% to 0.25% of the total labor force.
Table 9. Tobacco cultivation by season and type of tobacco leaf (hectares)