June 10, 2005
Document of the World Bank
Report No. 32134-LKSri Lanka Attaining the Millennium Development Goals in Sri Lanka
Report No. 32134-LK
Sri Lanka
Attaining the Millennium Development Goals in Sri Lanka
How Likely and What Will it Take to Reduce Poverty, Child Mortality and Malnutrition, and to Increase School Enrollment and Completion?
Human Development Unit South Asia Region
Public Disclosure AuthorizedPublic Disclosure AuthorizedPublic Disclosure AuthorizedPublic Disclosure Authorized
This report was prepared by Harsha Aturupane (SASHD - Task Team Leader) and Ani1 B.
Deolalikar (Professor o f Economics, University o f California - Consultant), with analytical inputs from Suresh de Me1 (Senior Lecturer - University o f Peradeniya - Consultant), Dileni Gunewardena (Senior Lecturer - University o f Peradeniya Consultant), Thomas Kellaghan (Director, National Education Research Center Consultant) and Upul Sonnadara (Senior Lecturer, University o f Colombo - Consultant), and under the overall guidance o f Julian F.
Schweitzer (Sector Director, SASHD), Mansoora Rashid (Sector Manager, SASHD), and Peter Harrold, Country Director for Sri Lanka (SACSL). The Sri Lanka Business Development Center collected and collated much o f the secondary data for the report. The study also used household survey data generously made available by the Department of Census and Statistics and the Ministries o f Finance & Planning, Education and Health.
CONTENTS
EXECUTIVE SUMMARY
...
i1. INTRODUCTION
... ...
1... I ... I 2 The Millennium Development Goals ... Data, Methodology and Caveats Overview ofSri Lanka 's Development Record ... 2. CONSUMPTION POVERTY
...
5Introduction ... ... ... 5
Trends and Patterns ... .... ... 5
International Comparisons.. ... ... 6
Regional Variations.. ... ... 7
Who are the Poor? ... Government Anti-Poverty Programs., ... Growth, Inequality and Poverty in Sri Lanka ... 13
Multivariate Analysis of Poverty ... Simulations to 2015 ... I 1 ... 13
... 18
... 19
3. CHILD MALNUTRITION
...
22Introduction .. ... 22
Child Malnutrition Patterns and Trends ... ... 24
International Comparisons.. ... ... 24
Regional Disparities.. ... .25
Demographic Patterns ... ... 26
Proximate Causes and Correlates of Child Malnutrition ... 28
Multivariate Analysis.. ... ... 33
Simulations to 201 5 Major Polices and Programs to Decrease Child Malnutrition ... 31
... .34
4. INFANT AND UNDER-FIVE MORTALITY
...
-36Introduction.. ... ... 36
International Comparisons ... 36
Trends and Projections to 2015 ... Regional Variations.. ... .. 39
Correlates of District Variations in Infant Mortality Correlates of Household Variations in Infant Mortality ... .42
Role of Contextual and Policy Variables ... Multivariate Analysis.. ... ... 46
.. 37
... 40
45
Alternative Simulations to 201 5 ... . . . . . . .. ... .... . . .. . . . . . . .. . .. . . .. . . . .. . . .... . . . . . ... . . .. . . .. . . . . , . ... . . . .. . . .46
5. PRIMARY SCHOOLING AND GENDER DISPARITY
... ... . ...
48In traduction . . . . . . . . . . . . . . . . . . . . . . . . . . . . . . . . . . . . . . . , . . . . . . . . . . . . . . . . . . . , . . . . . . . . . . . . . . . . . . . . . ... 48
Overall Trends.. . . . . . . . . . . . . . . . . . . . . . . . . . . . . . . . . ... 48
Regional Variations ... 48
International Comparisons.. . . . . . . .. .. . . . . . . ... . . . ... . . . . . . . . , . .. . . . .. . . . .. . . .. . .. . . . . . . . . .. .... , . . . .. . . . . . . . , . . . . . . . .50
Future Challenges for the Sri Lankan Primary School System ... .51
Special and Non-Formal Education Programs for Out-of-School Children.. . .. . . .. . . . .. .... ... 51
Learning Outcomes ... ... 55
Government Policy to Enhance the Quality of Primary Schooling ... . . . . . . . . . ... 56
6. CONCLUSIONS
... ... . ... ... ... ...
59REFERENCES
... . ... .. ... . ...
63ANNEX TABLES
... ...
66FIGURES Figure 1.1 : GDP per capita (PPP US$) Rank minus Rank on Human Development Index, Selected Countries in Asia, 2004 ... 3
Figure 2.1 : Poverty Incidence (%) in the 1990s (national poverty lines), South Asia ... 6
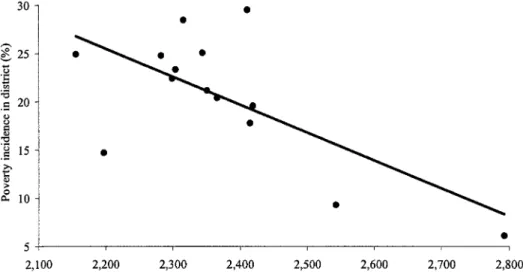
Figure 2.2: Poverty Incidence and Mean per capita Consumption Expenditure across Districts, 2002 ... 9
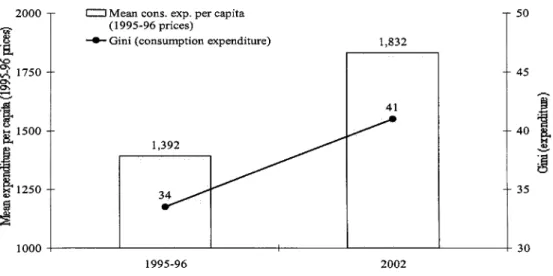
Figure 2.3: Mean Monthly Consumption Expenditure per capita in Real (1995-96) Prices and Consumption Inequality, 1995-96 to 2002 ... 13
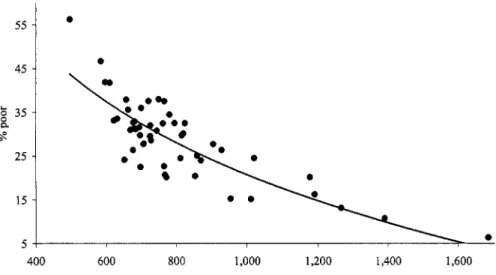
Figure 2.4: Relationship between Consumption Poverty (%) and Mean Monthly Consumption Expenditure per capita (in 1990-9 1 prices) across Districts, Pooled 1990-9 1, 1995-96 and 2002 Data ... 14
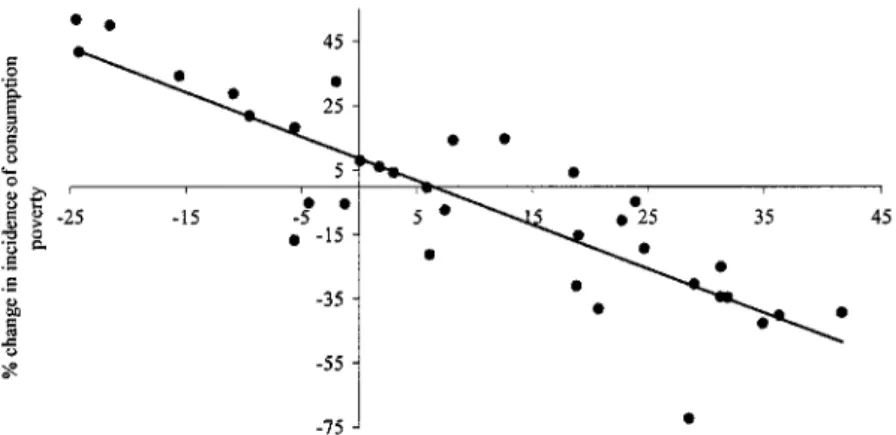
Figure 2.5: Relationship between % Change in Mean Real Consumption Expenditure per capita and % Change in the Incidence o f Consumption Poverty across Districts, 1990-95 and Figure 2.6: Relationship between % Change in Mean Real Consumption Expenditure per capita and % Change in the Gini Coefficient o f Consumption Inequality across Districts, 1990-95 and 1995-2002 ... 15
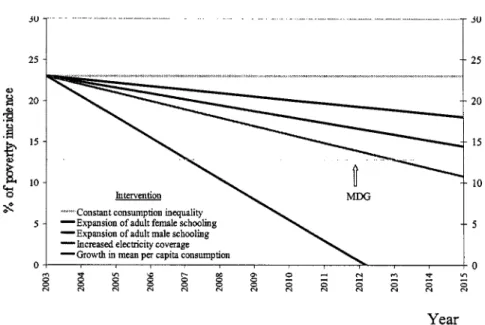
shows cumulative effect o f each additional intervention) ... 19
1995-2002 ... 15
Figure 2.7: Projected Poverty Headcount Ratio to 2015, under various Intervention Scenarios (graph Figure 3.1 : Relationship between Child Underweight Rates (1995-2002) and GDP per capita (2002) Figure 3.2: Relationship across a Cross-Section o f Low- and Medium-Human Development Countries between Percent o f Children under 5 who were Underweight in 1995-2002 ... 21
and the Infant Mortality Rate in 2002 across a Cross-Section o f Low- and Medium- Human Development Countries. .. . .. . . . . . . . . .. . . .. . . .. . . , . . . . .. . .. . .. . . . .. . . .. . . .. . . ... 22
Figure 3.3 : Child Underweight Rates (%) during the 1990s, South Asia ... . . . .. . . .. . . .. . . .. .24
Figure Figure
3.4: Percent of Children 0-59 months who are Moderately or Severely Underweight. by
3.5: Projected % o f Children under 6 who are Underweight to 2015. under Different Predicted per capita Consumption Quintile. 2000 ... 29
Intervention Scenarios (graph shows cumulative effect o f each additional intervention) ... 34
. Figure 4.1: Infant Mortality Rate (per 1. 000 live births). 1946-2000 ... 35
Figure 4.2: Relationship between the Infant Mortality Rate and GDP per capita across a Cross-Section o f Low- and Medium-Human Development Countries, 2002 ... 36
Figure 4.3: Projection of Infant Mortality Rate (per 1, 000 live births) to 2015 (based on observed time trends from 1946 to 2000) ... 36
Figure 4.4: Projection of Infant Mortality Rate (per 1, 000 live births) to 20 15 (based on observed time trends fi-om 1990 to 2000) ... 37
Figure 4.5: Infant Mortality Rate (1996) and Mean Monthly Consumption Expenditure per capita (1995-96) across Districts ... 40
Figure 4.6: Infant Mortality Rate and Availability o f Midwives per 1, 000 Population across Districts ... 40
Figure 4.7: Infant and Under-Five Mortality Rates, by Birth Order and Sex, 2000 ... 41
Figure 4.8: Projected Infant Mortality Rate to 2015 (graph shows cumulative effect o f each intervention) ... 46
Figure 5.1 : Net Pnmary Attendance Rates and Primary Completion Rates from Household Survey Figure 5.2: Progressive Government Financing o f Provinces with L o w Average Primary Education Data. selected South Asian Countries. circa 2000 ... 49
Achievement Levels ... 56
TABLES Table 2.1: Incidence o f Poverty (%) by Sector. 1990/91-2002 ... 4
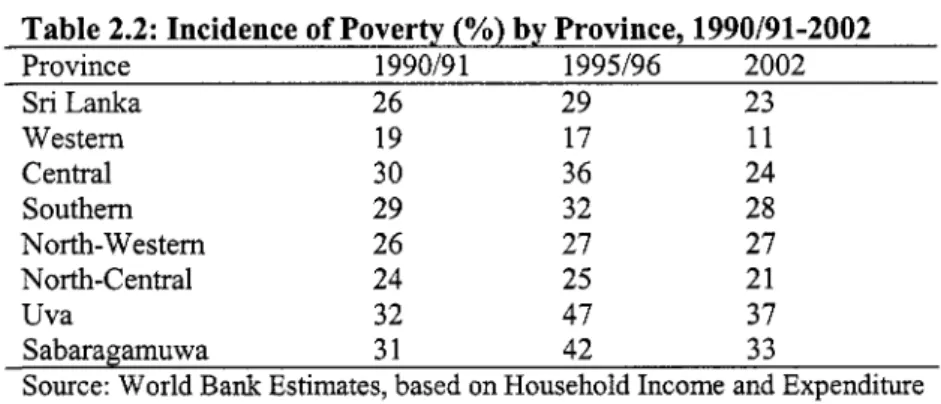
Table 2.2: Incidence o f Poverty (%) by Province, 1990/91-2002 ... 7
Table 2.3: Depth and Severity o f Poverty (%) by Province, 1990/91-2002 ... 7
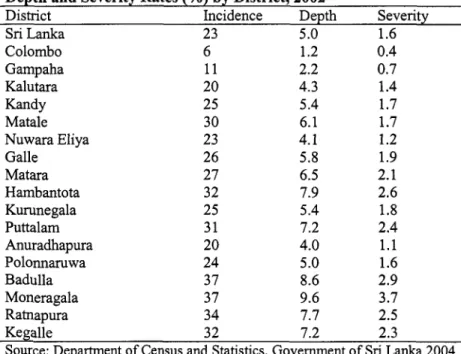
Table 2.4: Regional Variations in Poverty: Poverty Headcount, Depth and Severity Rates (%) by District, 2002 ... 8
Table 2.5: Provincial Poverty Rates (%) and GDP per capita by Province, 2002 ... 9
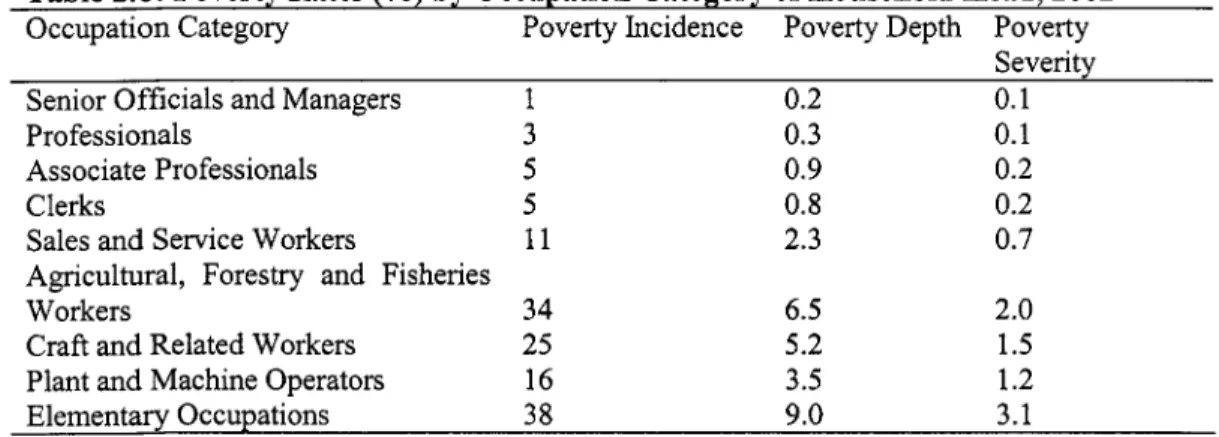
Table 2.6: Poverty Rates (%) by Occupation Category o f Household Head, 2002 ... 10
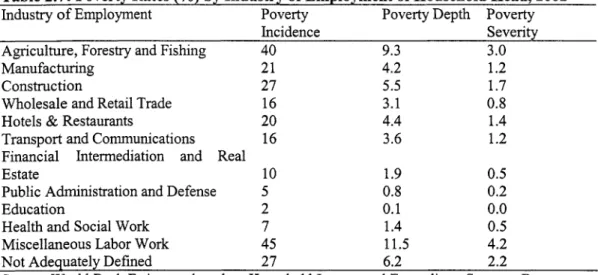
Table 2.7: Poverty Rates (%) by Industry o f Employment o f Household Head, 2002 ... 11
Table 2.8: Poverty Rates (%) by Education Level o f Household Head, 2002 ... 11
Table 2.9: Poverty Rates (%) by Sex o f Household Head, 2002 ... 11
Table 2.10: Decomposition o f Changes in Poverty Indices into Changes attributable to Economic Growth and those attributable to Changed Distribution o f Consumption Expenditure per capita, 1995-96 to 2002 ... 17
Poverty, 2002 to 2015 ... 18
Table 2.1 1 : Assumptions about Various Interventions to Reduce Consumption Table 3.1 : Malnutrition Rates (%) o f Children Aged 3-59 months. 2000 ... 23
moderately or severely underweight). 1993-2000 ... 25
Table 3.3: Child Malnutrition Rates by Age and Sex. 2000 ... 26
Table 3.4: Child Malnutrition Rates by Birth Order and Sex. 2000 ... 26 Table 3.2: Province Level Variations in Child Malnutrition (% o f children 3-59 months who are
Table 3.5: Rates o f Child Malnutrition among Children Aged 0-59 months. by Mother’s Age and
Education. 2000 ... 27
Table 3.6: Patterns of Breast.feeding. 1993 and 2000 ... 28
Table 3.7: Rates o f Child Malnutrition (%) among Children Aged 0-59 months by Infant Feeding Practices. 2000 ... 28
Table 3.8: Rates o f Child Malnutrition among Children Aged 0-59 months. by Drinking Water Table 3.9: Assumptions about Various Interventions to Reduce the Child Underweight Rate. 2000 to Source. Type o f Toilet and Housing Conditions. 2000 ... 30
2015 ... 33
Table 4.1: Infant Mortality Rate by Province o f Registration (per 1. 000 live births). 1991-96 ... 38
Table 4.2: Infant Mortality Rate by District o f Registration (per 1. 000 live births). 1991-96 ... 39
Table 4.3: Infant and Under-Five Mortality. by Various Characteristics. 2000 ... 43
Table 5.1: Net Primary School Attendance Rates (%). by Sex. 1990/91-2002 ... 48
Table 5.2: Net Primary School Attendance Rates (%). by Sex and by Province. 2002 ... 48
Table 5.4: Primary School Enrollment by Consumption Quintile. 2002 ... 49
Table 5.6: Regional Variations in Learning Outcomes in English at Grade 4, 2003 ... 54
Table 5.7: Regional Variations in Learning Outcomes in Mathematics at Grade 4, 2003 ... 55
Table 5.3: Net Primary School Completion Rates (%). by Sex and by Province. 2002 ... 48
Table 5.5: Regional Variations in Learning Outcomes in the First Language (Sinhalese or Tamil) at Grade 4. 2003 ... 54
BOXES Box 111 . 1 : Child Malnutrition among children in the North-Eastem Province ... 34
ANNEX TABLES Table 1 : Pooled District-level Regressions o f Log o f the Poverty Headcount Ratio (%). 1990-91
.
Table 2: Maximum Likelihood Probit Estimates o f the Probability o f a Household being Table 3: Maximum Likelihood Probit Estimates o f the Probability of a Child Aged 3-59 months Table 4: Maximum Likelihood Probit Estimates o f the Probability o f a Child Dying before 1995-96 and 2002 ... 65Poor. 2002 ... 65
being Underweight. 2000 ... 66
Ages 12 and 60 months. 2000 ... 67
EXECUTIVE SUMMARY
1. This report focuses on the attainment o f five major human development-related MDGs by sub-national units in Sri Lanka relating to poverty, under-five and infant mortality, child malnutrition, schooling enrollment and completion, and gender disparities in schooling.
The selection o f these MDGs for detailed analysis was based in large part on the availability of reliable sub-national data. The report concludes that o f these MDGs, Sri Lanka has already attained the numerical goals relating to universal primary enrollment and completion. Indeed, the country had almost met these goals as far back as 1990-91, and is far ahead o f the other countries o f South Asia in terms o f having reached near-universal primary enrollment and completion. Sri Lanka has also attained the MD goal o f gender parity in primary and secondary school enrollments, again having met this target as early as 1990-91. However, Sri Lanka faces considerable challenges in ensuring good quality primary education, with substantial shortfalls in cognitive achievement in the country as a whole. Further, Sri Lanka experiences sharp regional disparities in learning outcomes. Improving the quality o f primary education in the country, with special emphasis on educationally disadvantaged areas, will require strategic policy development, effective service delivery and efficient investment of resources.
2. Sri Lanka’s achievements are remarkable for a country that has been ravaged by a 20- year civil war. While there are many reasons for this success, chief among them are the country’s impressive growth performance during the past 20 years and Sri Lanka’s strong human-capital base at the beginning o f the period. Sri Lanka’s experience suggests that a country’s human capital base does not necessarily have to deteriorate during prolonged periods o f civil strife.
3. Sri Lanka has made great strides in bringing down its infant and under-five mortality rates. The country has sustained a rate o f decline o f more than 4% per year over the last half century to bring its infant mortality rate down to a mere 13 deaths per 1,000 live births in 2000. This rate is not only unusually low in comparison to the infant mortality rates o f most developing countries but is lower than that observed in countries such as Russia, Ukraine and Argentina that are considerably wealthier than Sri Lanka. Indeed, an international comparison o f infant mortality rates across 120 countries suggests that Sri Lanka enjoys an infant mortality rate that may be a fourth o f what would typically be expected o f a country at Sri Lanka’s level o f per capita income. The analysis in this paper suggests that it should be relatively easy for Sri Lanka to attain the infant mortality-related MDG o f no more than 6.3 deaths per 1,000 live births by 2015, provided it maintains strong economic growth over the next decade and continues to expand access to infrastructure, particularly sanitation.
4. The two areas where Sri Lanka has not made enough progress in the past are reduction o f poverty and child malnutrition. Poverty reduction has been slow because of generally slow economic growth in the past. While growth o f the Sri Lankan economy accelerated during the second half o f the 1990s, there was a sharp increase in inequality, and this considerably reduced the poverty-reducing benefits o f economic growth. However, the
simulations undertaken in this report suggest that i t should be possible for Sri Lanka to attain the MD goal o f reducing the percent o f population in poverty to no more than 13% by maintaining strong economic growth, continued expansion o f male and female schooling, and sustained improvement in infrastructure (viz., electricity coverage), and by preventing income and consumption inequality from rising in the years ahead. Enhancing economic growth to the levels needed to attain the poverty MD goal requires the relaxation o f constraints to the efficient functioning o f markets, especially in agriculture; creating an enabling economic climate for the private sector; and promoting industrial and service sector activities which combine high potential for productivity growth with strong, income elastic demand.
5. Sri Lanka’s poor performance on child malnutrition is more difficult to understand.
One would think that the same interventions that allowed Sri Lanka to achieve unusually low rates o f infant and under-five mortality relative to its income would also have permitted i t to accomplish low rates o f child malnutrition. However, this has obviously not been the case.
With nearly one out o f three children aged 5 or under being underweight, Sri Lanka has unusually high rates o f child malnutrition, not only in absolute terms but also in relation to its income. The disconnect between the country’s infant mortality rate and its child malnutrition rate i s even more striking; a cross-country comparison suggests that Sri Lanka has a child underweight rate that may be three times as high as what would be expected o f a country with Sri Lanka’s level o f infant mortality.
6. Part o f the reason for the high rates o f child malnutrition must be social and cultural, since as many as 15% o f children even in the richest quintile o f households - a group that is likely to have very good economic access to food - are underweight and stunted. Among these cultural and social factors may be child feeding practices, such as denying the new- born child colostrum, short duration o f exclusive breast-feeding, early introduction o f solid foods in a child’s diet, and insufficiency and inadequacy o f weaning diets. This is seen in the sharply increased risk o f malnutrition for most Sri Lankan children in their second year o f life (beginning at age 12 months). Thus, the evidence suggests that stepping up o f efforts to provide nutritional education and counseling to expectant mothers and to adolescent girls is likely to have large pay-offs in terms o f reduced child malnutrition rates. Already, there is evidence to suggest that infant feeding practices are changing rapidly. Over the period 1993- 2000, there were sharp increases in the proportion o f children that were given colostrum immediately after birth, the percentage o f children exclusively breast-fed in their first three months o f life, and the average duration o f exclusive breast-feeding. Not surprisingly, there was a commensurate decline in rates o f child malnutrition. Thus, the incongruence between low infant mortality and high child malnutrition rates is likely to fade away over time as feeding practices and nutrition knowledge o f mothers improve.
7. It is important to note that even though Sri Lanka shows no apparent gender disparities in schooling opportunities at the primary or secondary level, there is considerable evidence o f intra-household discrimination against girls in the allocation o f nutritional inputs and health services. This i s reflected in generally higher rates o f infant mortality for females than for males. The situation i s even worse when gender disparities are disaggregated by birth order. For instance, the risk o f infant mortality for girls o f birth order 3 or higher i s
nearly 50% greater than that for boys o f the same birth order. There are significant gender disparities in the risk o f severe child malnutrition as well. The data suggest that girls under the age o f 5 are nearly 40% and 70% more likely to be severely stunted and underweight, respectively, than boys. While these patterns o f discrimination against girls are widely observed in other parts o f South Asia (e.g., Pakistan, India and Bangladesh), their presence in Sri Lanka i s surprising in view o f the high-levels o f adult female literacy and good access to health facilities for much o f the population. The findings call for further investigation into why gender discrimination, especially against higher birth-order girls, has persisted in health and nutrition opportunities but not in schooling opportunities.
8. Sri Lanka’s impressive achievements in infant and child mortality reduction should be further tempered by the presence o f the large regional disparities in these indicators. In 1996, for instance, infant mortality in the district with the highest infant mortality rate in Sri Lanka (Anwadhapura) was almost 20 times as high as infant mortality in the district with the lowest infant mortality rate (Trincomalee). There are also wide variations across districts in the pace of infant mortality reduction over time; for instance, between 1991 and 1996, 13 districts (out o f a total o f 25) showed an increase in infant mortality. Likewise, the incidence of consumption poverty varies a lot across districts. In some districts, such as Badulla and Moneragala, the incidence o f poverty i s as much as 60% higher than the national average and 6 times as high as the incidence o f poverty in the Colombo district. There i s also considerable variation in the pace of poverty reduction across districts, with some districts having seen a 15% increase in poverty incidence between 1995-96 and 2002 while other districts have recorded a 72% decrease in poverty incidence over the same period. Inter-district variations in the growth o f mean consumption expenditure account for much o f the variations in the pace o f poverty reduction. Thus, it i s clear that an important task for policy makers i s to narrow the large geographical disparities that exist in the MD indicators. This would mean targeting economic growth opportunities and infrastructural investments to the neediest and under-served districts that have poor levels o f the MD indicators and that have seen little progress in these indicators over time.
9. The analysis in this report highlights the importance o f infrastructure in attaining the MDGs. For instance, both poverty and child malnutrition are strongly correlated with electricity coverage; access to water and sanitation is associated with reduced rates o f child malnutrition; and better sanitation is associated with lower levels o f infant mortality. The simulations suggest that expanding electricity coverage from 57% to 72% would in itself reduce the child malnutrition rate by 5 percentage points. Investment in physical infrastructure (e.g., roads, electricity, water, etc.) has not received nearly as much attention in the past from Sri Lankan policy-makers as investments in health and educational interventions. The analysis in this report suggests that infrastructural investments, especially targeted to the poor and under-served districts, would help the country with attaining the M D G s speedily.
10. Consistent with the findings o f numerous empirical studies from around the world, this report finds evidence o f strong associations between female adult schooling and many o f the MD indicators. For instance, female schooling, especially at the post-primary level, i s strongly associated with poverty reduction and with lower child underweight rates. These
results suggest that continued increases in girls’ secondary and tertiary enrollment in the coming years will fuel significant improvements in many o f the MD indicators. In addition, improvements in learning levels o f both boys and girls would strengthen the economic prospects and human development attainment o f the country substantially.
11. One final area o f concern relates to consumption inequality. While Sri Lanka saw mean consumption per capita grow significantly (at the rate o f about 4% per annum) between 1995-96 and 2002, it also saw consumption inequality increase sharply. The Gini coefficient jumped up from 34% to 41% during this period. This large increase in consumption inequality makes the distribution o f per capita consumption expenditure more unequal in Sri Lanka than in neighboring India, Bangladesh or Pakistan. More importantly, a poverty decomposition exercise suggests that, instead o f declining by 6 percentage points (29% to 23%), the poverty headcount ratio in Sri Lanka would have fallen by as many as 17 percentage points (from 29% in 1995-96 to 12% in 2002) if the distribution o f consumption had remained unchanged. Thus, the sharp increase in consumption inequality witnessed by Sri Lanka during the late 1990s, greatly reduced the poverty-reducing impact o f growth. It will be important to ensure that future growth o f the Sri Lankan economy i s more pro-poor than past growth.
12. Finally, the importance o f systematically monitoring MD outcomes at disaggregated levels and evaluating the impact o f public programs cannot be overemphasized. There i s a paucity o f reliable, time-series data on many MD indicators, such as consumption poverty and child malnutrition, at the district level. The lack o f such data makes it virtually impossible to monitor progress toward attainment o f the MDGs at lower levels o f administration. In addition, most public assistance programs and interventions in Sri Lanka, such as the Samurdhi program, have not been subjected to rigorous, independent evaluation.
In order to choose the right set o f interventions with which to attain the MDGs, it i s critical to know which programs have been successful in improving MD indicators and which have not.
1. INTRODUCTION
The Millennium Development Goals
1.1 Since the launch o f the Millennium Development Goals (MDGs) at the Millennium Summit held in New York in September 2000, the MDGs have become the most widely- accepted yardstick o f development efforts by governments, donors and NGOs. The MDGs are a set o f numerical and time-bound targets related to key achievements in human development. They include halving income-poverty and hunger; achieving universal primary education and gender equality; reducing infant and child mortality by two-thirds and maternal mortality by three-quarters; reversing the spread o f HIV/AIDS; and halving the proportion o f people without access to safe water. These targets are to be achieved by 2015,
from their level in 1990 (United Nations 2000).
1.2 Almost all the countries in the world, including Sri Lanka, have committed themselves to attaining the targets embodied in the Millennium Declaration by 2015.
Unfortunately, there i s little understanding o f whether Sri Lanka will be able to attain all o f the MDGs. There i s even less understanding o f what it will take - by way o f economic growth, infrastructural investments, and social-sector interventions - to attain the different MDGs. Further, this report argues the importance o f disaggregating the MDGs for Sri Lanka, given the large geographical and socioeconomic variations in millennium development (MD) indicators across the country.
1.3 This report focuses on the attainment o f five major human development-related MDGs by sub-national units in Sri Lanka relating to poverty, under-five and infant mortality, child malnutrition, schooling enrollment and completion, and gender disparities in schooling.
The selection o f these MDGs for detailed analysis was based in large part on the availability of reliable sub-national data. For example, reliable data on disease prevalence at the district level are simply not available, and this hampers useful sub-national analysis o f the communicable disease-related MDG. The same i s true o f another important MD indicator - maternal mortality.
Data, Methodology and Caveats
1.4 Virtually all o f the analysis in this report i s based on two sets o f national household surveys. First, data from three rounds o f the nationally-representative Sri Lanka Household Income and Expenditure Survey (HIES), which were collected in 1990-91, 1995-96 and 2002, are used to analyze the levels and correlates o f consumption-poverty, schooling enrollment, and gender disparity in schooling. Second, unit record data from the 1993 and 2000 rounds o f the Demographic and Health Survey (DHS) are used to analyze the levels and correlates o f child malnutrition and infant and under-five mortality. Both the HIES and the DHS were conducted by the Department o f Census and Statistics, Government o f Sri Lanka.
1.5 The methodological approach adopted in this report is roughly as follows. We apply econometric estimation techniques to household data in order to analyze the socioeconomic and policy correlates o f the selected MD indicators. These estimates are then used to simulate
the likely trajectory o f the MD indicators under alternative scenarios o f change between now and 2015.
1.6 By its very nature, any empirical analysis i s predicated on assumptions about data quality and measurement, inferences o f causality between variables, and potential biases o f statistical and econometric estimates. The analysis presented in this report is not immune to these same concerns. It is therefore important to note at the outset that while the results and simulations presented in this report may give an impression o f precision, they are not that.’
They should be treated as indicative o f possible broad trends, and could usefully be complemented with other analyses using different methodological approaches. As long as the results are used with this understanding, they can be helpful in ‘rough-order, planning for MDG attainment.
1.7 Finally, it is essential to note an important limitation o f the simulations performed in this report. The simulations are based on statistical analysis o f household survey data. By its very nature, such an analysis tends to over-emphasize readily-measurable variables, such as household income or consumption, adult schooling levels, and access to infrastructure, and under-emphasize qualitative variables, such as the quality o f institutions, governance, and empowerment. Obviously, this does not imply that the latter variables are irrelevant to the MD indicators; indeed, institutional reform and good governance are critical to the attainment o f the MDGs. It is therefore important to view the messages o f this report as complementing those from the numerous qualitative (and detailed) studies o f health, nutrition, schooling and poverty that have been conducted in the past.
Overview of Sri Lanka’s Development Record
1.8 Sri Lanka has long been extolled in the development economics literature as a model low-income country - one that has achieved extraordinary success in attaining high levels o f male and female literacy, school enrollments and health outcomes, despite low levels o f per capita income. Only a handful o f developing countries, such as China, Vietnam, Cuba and Costa Rica, can list as many achievements as Sri Lanka on the social front. Indeed, data from the UNDP’s global Human Development Report 2004 suggests that Sri Lanka has one o f the highest ranks of all the countries in Asia when its performance on the human development index (which i s a composite index o f life expectancy, adult literacy, school enrollment, and income per capita) is compared relative to its performance o n GDP per capita (Figure 1.1).*
’
In addition to lack o f precision, the estimates presented in this report, like other econometric estimates, may be subject to systematic biases arising from measurement errors in the independent variables and from the omission o f important variables and unobserved heterogeneity from the analysis.*
In Figure 1.1, positive figures indicate that a country’s HDI rank i s higher than its rank on GDP per capita (in purchasing power parity-adjusted US$), while a negative number indicates the opposite. Thus, a high rank score on this measure indicates superior performance on human development relative to economic development.Figure 1.1 : GDP per capita (PPP US%) Rank minus Rank on Human Development Index, Selected Countries in Asia, 2004
20 - 15 -
-
10 -8
3
5 -a
a n
25
1
2216 11 12
9 5
1 1 2 2
= I ”
, I I I I , I
-15
’
Note: A positive figure indicates that a country’s HDI rank i s higher than the GDP per capita (PPP Source: UNDP, Human Development Report, US$) rank, while a negative number indicates the opposite. 2004.
1.9 Sri Lanka’s impressive performance on social indicators does not mean, however, that the MDGs are irrelevant for the country. This is so for a number o f reasons. First, many o f the MDGs are relative goals indexed to benchmark levels in 1990, so the fact that a country enjoyed superior social indicators in 1990 does not influence its prospects for attaining the MDGs by 2015. Second, Sri Lanka’s performance on income-poverty reduction - an important MDG - has lagged behind its performance on improving health and education indicators, largely because the country has generally been a slow grower during much o f its past (although not its recent past). Third, as this report will make clear, Sri Lanka has experienced a diversity o f outcomes even among the various social indicators. For instance, while the country has done very well in reducing infant, child and matemal mortality, it has not done anywhere as well in reducing child malnutrition.
1.10 This means that a large number o f Sri Lankan children who survive infancy and childhood end up suffering a lower quality o f life, at least in terms o f nutritional deprivation.
Fourth and finally, there are large inter-provincial and inter-district variations in MDG outcomes in Sri Lanka, so that even if the country as a whole attains a particular MDG, some regions in the country might still be short. For these and other reasons, it i s important to
analyze Sri Lanka’s past performance o n a variety o f MD indicators and assess its prospects for attaining the MDGs.
2. CONSUMPTION POVERTY
Introduction
2.1 Eradicating extreme poverty and hunger constitutes the first MDG. Reducing poverty and alleviating deprivation have also been at the heart o f Sri Lankan public policy over several decades. The country has made considerable progress on poverty reduction over the long-term, with income levels and living standards improving substantially since independence in 1948. However, more recently, Sri Lanka has encountered difficulties in its battle against poverty. The present chapter examines poverty rates and regional variations in poverty over the period 1990-2002, and examines the prospects o f Sri Lanka attaining the MDG o f halving the incidence o f consumption poverty between 1990 and 2015. For Sri Lanka, this would mean bringing the poverty incidence down to a level o f 13% by 2015.
Trends and Patterns
2.2 Poverty in Sri Lanka i s high and widespread. About 23% o f the population lives below the official national poverty line in seven o f the eight provinces in the country (Table 2.1). Household survey data suitable for poverty measurement does not exist for the eighth province - the conflict-affected North-Eastern Province. However, the North-Eastern Province has by far the lowest per capita income o f all the provinces, so it is likely that the incidence o f poverty in the North-Eastem Province is greater than in most o f the other
province^.^
The discussion in the rest o f the chapter focuses on poverty levels in the remaining seven provinces for which data on poverty are readily available. But i t should be borne in mind that the national poverty level, with the North-Eastern Province included, is certain to be greater, so the poverty numbers presented and discussed in this chapter should be seen as floor or minimum estimates.Table 2.1: Incidence of Poverty (YO) by Sector, 1990/91-2002
Sector 1990/91 1995196 2002
Sri Lanka 26 29 23
Urban 16 14 8
Rural 29 31 25
Estate 21 38 30
Notes: The Household Income and Expenditure Surveys 1990/91, 1995196 and 2002, on which the poverty numbers are based, were conducted in seven of the eight provinces in the country. The surveys could not be conducted in the North-Eastem Province, which has been theatre o f a separatist armed conflict for over 20 years. As such, the poverty rates above do not include the North-Eastem Province.
Source: Department o f Census and Statistics, Government o f Sri Lanka, 2004.
Of course, as in the other provinces, poverty incidence is likely to vary a great deal within the North-Eastem Province. For example, i t is likely that some o f the districts in the East, which have historically been poorer than Jaffna, have a higher incidence o f poverty.
2.3 The highest level o f poverty is in the estate sector, which comprises the plantations in the central highlands and surrounding areas. About 30% o f the population in estate areas is poor. This is followed by the rural sector, where about 25% o f the population lives below the poverty line.4 In the prosperous urban sector, in contrast, poverty levels are considerably lower - just 8%. This pattern o f poverty across sectors, where agricultural areas exhibit substantially higher levels o f poverty than areas which depend mainly on industry and services, is evident in virtually every country in the world. The wider range o f economic activities and more profitable economic opportunities available in cities and towns i s manifested in lower poverty rates in urban areas.
2.4 The time trend o f poverty shows that the proportion o f people living below the poverty line rose from 26% in 1990/91 to 29% in 1995/96 and then declined to 23% in 200L5 The increase in 1995/96 was likely the result o f that year being a drought year with rainfall in most parts o f the country being well below average. The same trend i s seen in both the rural and estate sectors which experienced rising poverty between 1990/91 and 1995/96, followed by decreasing poverty between 1995/96 and 2002. Urban poverty, in contrast, fell continually between 1990/91 and 2002. Other measures o f poverty, such as the depth and severity o f poverty, show a similar time trend and sector pattern. The depth and severity o f poverty increased from 1990/91 to 1995/96 and decreased between 1995/96 and 2002 in the country as a whole. Further, this trend was observed in both the rural and estate sectors. In the urban sector, in contrast, the depth and severity o f poverty declined throughout the time period 1990/9 1-2002.
International Comparisons
2.5 How does the trend in poverty incidence in Sri Lanka during the 1990s compare with the trends observed in other countries o f the region over the same period? Figure 2.1 shows the poverty headcount ratios (based on national poverty lines) in Sri Lanka, Bangladesh, India and Pakistan at different points during the 1990s. While there are serious methodological problems in comparing poverty incidence across countries, a broad conclusion about the pace o f poverty reduction can be made - viz., that Sri Lanka’s overall performance on poverty reduction during the 1990s has been modest and comparable to that o f Pakistan, where the poverty headcount ratio fell only from 34% in 1990-91 to 32.6% in
1998-99, but significantly short o f the performance o f India, where the poverty headcount ratio fell from 36% in 1993-94 to 26% in 1999-2000 - an annual decline o f 1.7 percentage
It should be noted that the classification o f rural and urban areas changed slightly between the 1990-91 and the 1995-96 HIES (but remained unchanged for the 2002 HIES). Hence, comparisons o f urban and rural poverty rates between 1990-91 and later years should be treated with caution. I t i s worth mentioning that the current sectoral classification used by the Sri Lanka Department o f Census and Statistics i s based on somewhat-dated a b s t r a t i v e distinctions and is in the process o f being changed. The sector-specific poverty figures cited in this report could change under the new sectoral classification scheme.
Note that the poverty estimates cited in this report for the earlier years - 1990-91 and 1995-95 - differ from those shown in the World Bank’s poverty assessment (World Bank 2002). The reason for this discrepancy i s that the Department o f Census and Statistics, Government o f Sri Lanka, updated the methodology to compute poverty estimates after the publication o f the World Bank’s poverty assessment.
points,6 or Bangladesh, where the poverty headcount ratio fell from 59% in 1991-92 to 50%
in 2000 - an annual rate o f decline o f about one percentage point. In Sri Lanka, the annual decline in poverty was only about 0.25 percentage points between 1990 and 2002.
h 0 40 -
it
Figure 2.1: Poverty Incidence (YO) in the 1990s (national poverty lines), South Asia
36
=-- I
Regional Variations
2.6 Provincial Variations. Inter-province variation in poverty levels is large (Table 2.2).
In the two poorest provinces, Uva and Sabaragamuwa, the incidence o f poverty i s 37% and 33%, respectively. The poverty level in the wealthy Westem Province, in contrast, i s only 11%. Also, inter-province differences in poverty have grown over time. Three provinces, Uva, Sabaragamuwa and North-Westem, show higher poverty levels in 2002 than in 1990/91. Poverty in the prosperous Westem Province, in contrast, has decreased sharply from 19% to 11% between 1990/91 and 2002. Three other provinces, Central, North-Central and Southern, also show lower poverty levels in 2002 than in 1990/91. Thus, regional differences in the incidence o f poverty have increased over the period 1990/91 to 2002.
There has been some controversy about the Indian poverty figures. Using an alternative methodology, Deaton and Dreze (2002) report the decline to be from 29% to 22% (Deaton and Dreze 2002), which works out to an
1.2