A Systematic Assessment of Signatures of Positive Selection Events in Natural
Populations of the House Mouse
Inaugural – Dissertation
Zur
Erlangung des Doktorgrades
der Mathematisch-Naturwissenschaftlichen Fakultät der Universität zu Köln
vorgelegt von
Meike Thomas aus Traben-Trarbach
Köln, 2006
Berichterstatter: Prof. Dr. Diethard Tautz Prof. Dr. Thomas Wiehe
Tag der letzten mündlichen Prüfung: 01. Juni 2006
List of Contents
Danksagung...III Zusammenfassung...V Abstract... VII Declaration...IX
1 General Introduction...1
1.1 Molecular Evolution – A Short Introduction...1
1.2 The house mouse...7
1.3 Aim of the study...12
1.4 Literatur...13
2 Microsatellite variability in wild populations of the house mouse is not influenced by differences in chromosomal recombination rates...20
2.1 Abstract...20
2.2 Introduction...20
2.3 Methods...23
2.4 Results...24
2.5 Discussion...26
2.6 Acknowledgements:...29
2.7 Literature...30
3 A high-throughput routine to detect signatures of selective sweeps in genome screens using microsatellites ...34
3.1 Introduction...34
3.2 The Method...35
3.3 Data Analysis...38
3.4 Software Pipeline...39
3.5 Conclusions...40
3.6 Acknowledgements...41
3.7 Literature...41
4 A Genome Screen gives first Insights into the Basic Parameters and Frequency of Signatures of Selective Sweeps in natural Populations ...42
4.1 Summary ...42
4.2 Introduction...43
4.3 Material and Methods ...47
4.3.1 DNA pooling approach ...47
4.3.2 Genotyping single samples ...47
4.3.3 Statistics ...48
4.3.4 Selection coefficients...50
4.4 Results...54
4.4.1 Genome screen applying a DNA-pooling approach ...54
4.4.2 Verification of candidate loci...55
4.4.3 Sweep valley analysis ...60
4.4.4 Verification of sweep valleys...69
4.4.5 Bottleneck scenario...71
4.4.6 Selection coefficients...72
4.5 Discussion...73
4.6 Acknowledgements...79
4.7 References...80
5 Supplement...87
6 Digital Supplement...127
Erklärung...128
Lebenslauf...129
Danksagung
Bedanken möchte ich mich bei all jenen, die mich im Laufe meiner Dissertation unterstützt haben und es somit ermöglichten, dass die Arbeit nun in dieser Form vorliegt.
Mein Dank gilt vor allem Herrn Prof. Dr. Diethard Tautz, der es mir ermöglichte meine Promotion in seiner Arbeitsgruppe durchzuführen. Seine ständige Diskussionsbereitschaft und seine Ideen haben den Erfolg dieser Arbeit maßgeblich mitbestimmt. Ohne Zweifel hat mich die Zeit in seinem Labor stark beeinflusst und mein Verständnis für die Biologie enorm gesteigert.
Besonders möchte ich Prof. Dr. Thomas Wiehe danken, der – neben der Übernahme des zweiten Gutachtens – zu allen Teilen meiner Arbeit einen wesentlichen Beitrag geleistet hat. Er war stets bereit, unzählige Fragen zur Datenanalyse und Interpretation meiner Ergebnisse ausführlich zu diskutieren und Lösungen zu erarbeiten.
Zudem danke ich Herrn Prof. Dr. Harmut Arndt für die freundlich Übernahme des Prüfungsvorsitzes und Dr. Bettina Harr als Beisitzerin in meinem Prüfungskommitee.
Einen großen Dank möchte ich auch Prof. Dr. Miguel Vences aussprechen.
Ohne ihn wäre mir der Schritt ins Tautz-Labor sicherlich nicht gelungen. Ausserdem habe ich dank ihm den Anschluss an die herpetologische Arbeit während der gesamten Zeit nicht verloren. Durch seine stetigen Arbeitsanregungen habe ich es geschafft, neben der eigentlichen Dissertation auch der Froschforschung eine erhebliche Datenmenge beizutragen.
Mein Dank für unzählige Unterstützungen, Erklärungen und Denkanstöße gilt Dr. Bettina Harr, Dr. John Baines und Dr. Arne Nolte. Die vielen Diskussionen mit ihnen haben mein Verständnis für die Zusammenhänge in der Evolutionsgenetik erheblich gefördert und somit einen großen Beitrag zum Gelingen dieser Arbeit geleistet.
Der gesamten Tautz Gruppe möchte ich für die schöne Arbeitsatmosphäre danken, besonders Ruth Rottscheidt für die vielen guten Gepräche und den täglichen Spaß in den Pausen. Dank auch an Fabian Staubach, Kathryn Stemshorn, Chris
Voolstra und Till Bayer mit denen ich neben der schönen Zeit bei der Arbeit auch noch eine Menge Spaß auf der Piste hatte.
Neben den vielen hilfreichen Programmier-Arbeiten mit denen Lars Teschke mir bei der Durchführung meiner Promotion unendlich geholfen hat, möchte ich mich bei ihm dafür bedanken, dass er immer ein offenes Ohr für all die vielen kleinen Probleme hatte, die eine Doktorarbeit so mit sich bringt. Ohne seine ständige Motivation und seine Ruhe hätte ich die Zeit sicherlich nicht so ‚entspannt’ durchlebt.
Meiner Mutter, Ruth Glauer, möchte einen ganz besonderen Dank dafür aussprechen, dass sie es mir ermöglichte, meinem Interesse an der Biologie nachzugehen, mich immer auch darin unterstützt hat weiterzumachen und den Verlauf dieser Arbeit stets mit großem Interesse verfolgte.
Bedanken möchte ich mich für die finanzielle Förderung des Maus-Projektes durch die Volkswagen Stiftung.
Zusammenfassung
Frequenz und Struktur von positiven Selektionsereignissen in natürlichen Populationen sind von großer Wichtigkeit, gehören aber zu den noch wenig verstandenen Parametern in der Evolutionsbiologie. Ziel dieser Studie ist die Untersuchung dieser Basisparameter in einem populationsbasierten Ansatz. Positive Selektionsereignisse hinterlassen populationsgenetische Spuren (‘Selective Sweeps’), welche in molekularen Studien systematisch identifiziert werden können. Positive Selektion kann zur Fixierung der vorteilhaften Mutation in einer Population führen.
Aufgrund des so genannten ‘hitchhiking effects’, geht die Variabilität in den neutralen, flankierenden Regionen, welche physisch mit dem unter Selektion stehenden Locus verbunden sind, verloren. Diese ‘Fußabdrücke’ reduzierter neutraler Variabilität können genutzt werden, um systematisch nach positiv selektionierten (adaptiven) Mutationen zu suchen und erlauben eine Abschätzung ihrer Frequenz in einer gegebenen Population.
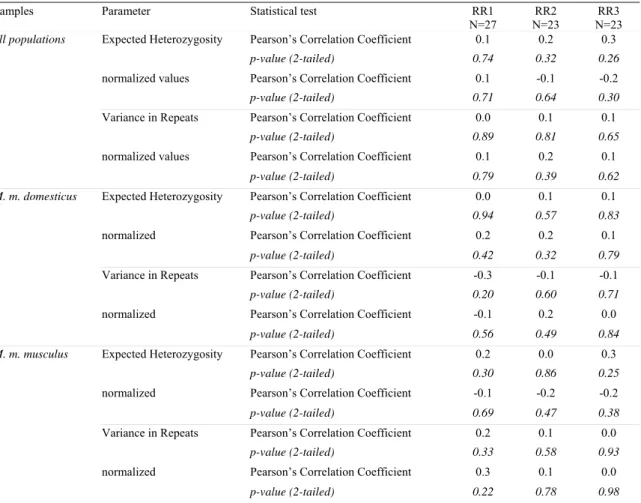
Unterschiede in der Rekombinationsrate entlang der Chromosomen können die Evolution neutraler Loci durch den ‘hitchhiking effect’ auch über einen langen Zeitraum beeinflussen. Generell sollten solche Effekte in niedrig rekombinierenden stärker als in hoch rekombinierenden Regionen sein. Detailierte Informationen der physikalischen und genetischen Karte der Hausmaus erlauben es, die Korrelation zwischen neutraler Variabilität und Rekombinationsrate in einer bestimmten chromosomalen Region zu untersuchen. Ich habe Mikrosatelliten aus chromosomalen Regionen unterschiedlicher Rekombinationsraten getestet und innerhalb von fünf beprobten Mauspopulationen (Mus musculus musculus and M. m. domesticus) keinen Hinweis auf eine Korrelation zwischen Mikrosatellitenvariabilität und Rekombinationsrate gefunden. Das deutet darauf hin, dass die hohe durchschnittliche Mutationsrate von Mikrosatelliten in Säugetieren die Effekte von weitreichendem
‘hitchhiking’ im Mausgenom ausgleicht.
Analysen, in denen die Variabilität neutraler Marker genutzt wird, um Regionen, die kürzlich unter positiver Selektion standen, zu identifizieren, werden als
‘hitchhiking mapping’ bezeichnet. Da die Genome hoeherer Eukaryoten ungefähr 40,000 selektierbare Loci enhalten und die Detektion von polymorphen Varianten des Testens von mindestens 20 Individuen aus verschiedenen Populationen bedarf, würde
ein kompletter Genome-Screen eine Bestimmung von Millionen von Genotypen bedeuten. Ich präsentiere hier eine Pool-Strategie, die es erlaubt, die Anzahl an Genotypisierungsreaktionen signifikant zu reduzieren. Die vorgestellte Hochdurchsatzroutine ermöglichte es mir, fast 1000 Mikrosatelliten in verschiedenen Populationen der Hausmaus zu untersuchen. Aus den durch diese Methode produzierten, spezifischen Mustern ist es möglich, visuell die Loci auszuselektieren, die eine populationsspezifische Reduktion in der Varibilität aufweisen. In einem zweiten Schritt werden diese Kandidaten erneut typisiert, diesmal für einzelne Individuen. Die Loci werden statistisch auf Signifikanz überprüft werden.
Eine detailierte Analyse der Kandidatenloci aus einem paarweisen Vergleich zweier Populationen ergab Resultate zur Frequenz von ‘Selective Sweeps’, der Stärke von Selektion in natürlichen Populationen und der Herkunft der selektierten Varianten. Die zwei untersuchten Populationen der Hausmaus (M. m. domesticus) trennten sich vor etwa vor 3000 Jahren nach deren Ankunft in Mitteleuropa. Die massive Invasion von Hausmäusen nach Europa ist, basierend auf fossilen Daten, gut dokumentiert. Starke, unabhängige, nachfolgende ‘Bottlenecks’ sind wegen den vergleichbaren hohen genom-weiten Variabilitäten in beiden Populationen wenig wahrscheinlich. Aus diesem Grund können komplexe demographische Einflüsse auf die Ergebnisse ausgeschlossen werden. Die identifizierten Kandidatenregionen zwischen diesen beiden Populationen werden durch die Genotypisierung flankierender Mikrosatelliten weitergehend charakterisiert. Die signifikante Abweichung der Kandidatenregionen von dem neutralen Zustand wird durch verschiedene statistische Analysen belegt. Basierend auf diesen Ergebnissen folgere ich, dass es mindestens ein positives Selektionsereignis je 100 Generationen in jeder Linie gegeben haben muss. Da keines der detektieren Sweep-Täler sehr breit ist, im Schnitt sind sie ca. 50 kb, kann gefolgert werden, dass positive Selektion im allgemeinen von Allelen vorangetrieben wird, die einen geringen selektiven Vorteil haben. Errechnete Selektionskoeffizienten variieren zwischen 0,0007 und 0,021.
Weiterhin scheint es, dass die vorteilhaften Varianten im Allgemeinen aus der bestehenden Variabiltät hervorgehen und dass positive Selektion als kontinuierlich wirkender Hintergrundeffekt in allen Populationen abläuft.
Abstract
The frequency and the structure of positive selection events in natural populations are of central importance, but one of the least known variables in evolutionary biology. The aim of this study is to investigate these basic parameters in a population based approach. Positive selection events leave population genetical signatures (selective sweeps) behind, which can be systematically identified with molecular studies. Positive selection can lead to the fixation of a favorable mutation in a population. Due to an effect called hitchhiking, variability in the neutral flanking regions which are physically linked to the target of selection is lost. This footprint of reduced neutral variability can be employed to systematically screen for positively selected (adaptive) mutations and allows to estimate their frequency in a given population.
Differences in recombination rates along the chromosomes can influence the evolution of neutral loci via hitchhiking effects even on a large time scale, which would influence the results. Generally, these effects should be stronger in regions of low recombination than in regions of high recombination. The detailed information on physical and genetic maps in the house mouse allows now to assess the correlation between neutral variability and recombination rates at given chromosomal regions. I have tested microsatellite loci from chromosomal regions which show differences in recombination rates and found no evidence for a correlation between microsatellite variability and recombination rates in samples from five wild mice populations (Mus musculus musculus and M. m. domesticus). This suggests that the high average mutation rate of microsatellites in mammals counter balances the effects of long range hitchhiking in the mouse genome.
Approaches, in which the variability of neutral markers is used to identify regions which have recently been under positive selection, is termed hitchhiking mapping. Since higher eukaryotic genomes may contain about 40,000 selectable loci and the detection of polymorphic variants requires testing of multiple individuals (at least 20) for several populations, a complete genome scan would require millions of genotypes to be determined. I present here a pooling strategy that allows to reduce the number of genotyping reactions significantly. The presented high throughput routine enabled me to investigate almost 1,000 microsatellite loci in different populations of
the house mouse. Among the composite patterns that are obtained in this way, it is possible to visually select those with population specifical reduced variability. In a second step, these candidates were then re-typed in individuals of a carefully chosen population background and statistically tested for significance.
A detailed analysis of the candidate loci identified by a single comparison yield results on the frequency of selective sweeps, the strength of selection acting in natural populations and the origin of selected variants. The two investigated populations of the house mouse (M. m. domesticus) have split upon arrival in Middle Europe about 3,000 years ago. The massive invasion of house mice into Europe is well documented based on fossil records. Strong independent subsequent bottlenecks can be ruled out because of a comparable high genome wide variability in both populations. Thus, complex demographic influences on the results can be excluded.
Identified candidate regions between the two focal populations were further characterized by genotyping additional microsatellites in the flanking regions of the identified candidates. The significant deviation of the candidate regions from the neutral state is supported by several statistical tests. Based on these results, I find that there was at least one positive selection event per 100 generations in each lineage.
Since none of the detected sweep valleys is broad, on average they are about 50 kb, I conclude that positive selection in general is driven by alleles providing weak beneficial impact. Estimated selection coefficients vary between 0.0007 and 0.021.
Furthermore, it seems that beneficial variants are generally taken from the standing variation and that positive selection is a continuously acting background effect in all populations.
Declaration
The design of the whole project was done together with Diethard Tautz. Practical laboratory work as well as the major parts of the data analysis was conducted by me.
In the different chapters of this thesis I profited from contributions of several co- authors:
Chapter 1
Sonja Ihle introduced me in the laboratory methods, and together with Susanne Krächter she collected ot the mouse samples used in this approach. Some of the microsatellite data was generated by Iary Ravaoarimanana. Thomas Wiehe provided major parts of the background knowledge on data analysis.
Chapter 2
The software pipeline to identify occurrences of dinucleotide repeats in the upstream regions of annotated genes was written by Friedrich Möller together with the help of Thomas Wiehe.
Chapter 3
Diethart and I designed the project together, and the interpretations of all the different results were aquired during numerous discussions. Laboratory work as well as the major parts of data analysis were done by me.
1 General Introduction
1.1 Molecular Evolution – A Short Introduction
Since “All living things have evolved” (Stearns and Hoekstra 2005), a main theme in biology is to understand the processes and mechanisms that facilitate evolutionary change. Irrespective of their function, such changes must have a molecular basis in order to be inherited from generation to generation. Evolutionary changes manifest as mutations in the DNA sequence of single organisms and, at a later stage, these mutations spread in gene pools of populations and species. This study focuses on the appearance and spread of new genetic variants in order to obtain a better insight of the prevalence of these key evolutionary processes.
There are two forces, which drive molecular changes and therefore cause molecular evolution: natural selection and random genetic drift. Drift describes the changes in allele frequency due to the random drawing of gametes that will form the next generation (Hartl and Clark 1997). Thus, drift acts randomly on genetic variation and its impact is larger in smaller populations. In a mutation-drift equilibrium population the probability of fixation is the observed frequency of the allele, and the expected fixation time of new alleles equals four times the effective population size measured in generations.
Natural selection describes all forms of directional changes in the allele frequencies of populations. The direction in these processes is induced from the environment. Two major forms of natural selection are acting in populations: positive selection and negative selection. In practice negative selection is often discussed in the context of background selection (e.g. Nachman 2001), purifying selection (e.g.
Hardison 2003, Khaitovich et al. 2004) or selective constraints (e.g.Eyre-Walker et al 2002, Bush and Lahn 2005). In general negative selection refers to the removal of those genetic variants that reduce the fitness of organisms. Positive selection is the force that increases the frequency of beneficial variants and therefore enables adaptive evolution. The fixation time of a favourable allele is not only dependent on the
effective population size but also on the fitness advantage of the beneficial allele. The degree of advantage is usually expressed as the selection coefficient. The value of the selection coefficient describes the decrease in allele frequency of other than the beneficial allele from one generation to the next. If the product of four times the effective population size and selection coefficient is larger than one (4Nes > 1) positive selection is acting in a population. Since the relative effect of drift is stronger in small populations, positive selection acts more effectively in large populations.
Thus, positive selection events with selection coefficients of e.g. 10-3 would be classified as strong positive selection in large populations, like in Drosophila, but as weak selection in small populations, like in mice.
Data on the occurrence of positive selection is indispensable in understanding how adaptive molecular evolution acts. Thus, traces of positive selection in genomes are an intensively studies subject (e.g. Harr et al. 2002, Beisswanger et al. 2005).
Apart of the gene, which gained a beneficial mutation, the physically linked flanking regions are also affected by the consequences of selection. Together with the beneficial allele of the target gene the flanking regions get a lift in frequency. This effect is called ‘hitchhiking effect’ (Maynard Smith and Haigh 1974). By the hitchhiking effect the neutral variability in flanking regions is wiped out during the fixation process (see Figure 1.1). Such a positive selection event is termed ‘Selective Sweep’. Thus, positive selection leaves characteristic footprints of reduced variability at linked neutral loci in the genome (Maynard Smith and Haigh 1974, Slatkin 1995).
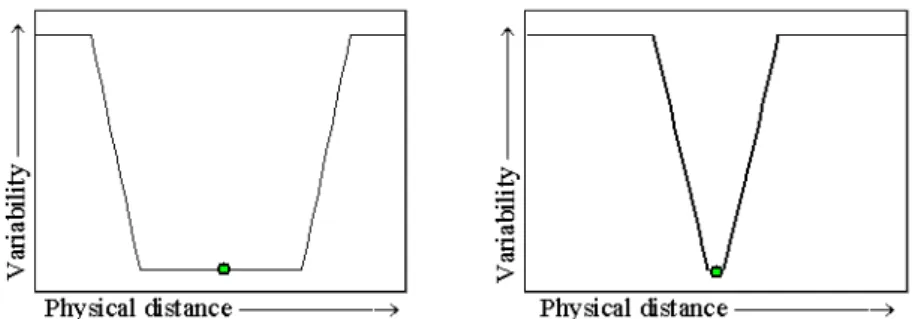
The size of the region that is affected by a selective sweep depends on the local recombination rate and the selection coefficient (Maynard Smith and Haigh 1974).
The lower the recombination rate and the higher the selection coefficient the larger is the region which is expected to exhibit the footprint of reduced variability (Figure 1.2). In the absence of recombination, hitchhiking eliminates all linked variation. In the presence of recombination, hitchhiking is incomplete since not all variation is removed (Fay and Wu 2000). Following this logic, the often observed positive correlation between levels of nucleotide diversity and recombination rate is widely interpreted as evidence of recurrent selective sweeps (Begun and Aquadro 1993, Nachman 1997, Nachman et al. 1998, Stephan and Langley 1998, Andolfatto and Prezeworski 2001, Betancourt and Presgraves 2002). For loci with very high mutation rates, genetic hitchhiking is expected to produce a correlation between variability
A B
C D
E F
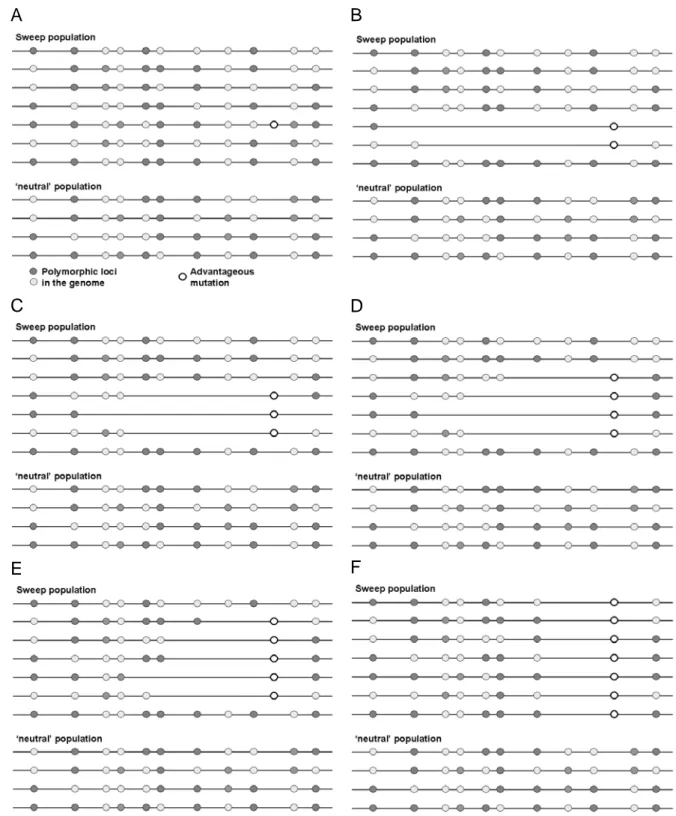
Figure 1.1 The hitchhiking effect. The figure depicts two populations, horizontal lines are chromosomes, the light and dark gray dots represent variable sites. Both populations show many neutral polymorphic sites between the different individuals. If an advantagous mutation appears in one of the two populations (A) this mutation will rise in frequency (C-E). Due to the hitchhiking effect (described by Maynard Smith and Haigh in 1974) the physically linked flanking regions will get a lift in frequency together with the advantageous allele, and thus variability between the individuals is lost in this region. During the time of fixation, the distal flanking regions recover variability because of recombination events. After such a selective sweep, a certain chromosomal area around the gene that carries the beneficial mutation exhibits reduced variability (H). Such reduced variability footprints of positive selection can be identified by comparing variability levels between distinct populations.
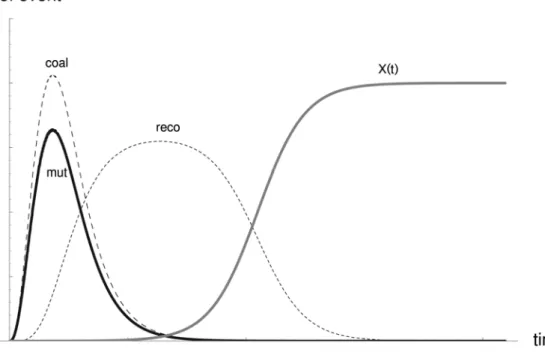
and recombination rate only if selective sweeps are very frequent. High mutation rates might counter balance the effects of low recombination rates because of accumulation of new mutations (Slatkin 1995, Wiehe 1998). Knowledge of the correlations between recombination rate and levels of polymorphism in natural populations is essential for projects in which signatures of selective sweeps are used to identify genes experiencing positive selection (Schlötterer 2002). During a selective sweep the increase in frequency of a favourable allele in time follows a sigmoid curve. A beneficial mutation appears in a population and starts at a low frequency. If it does not get lost due to drift, the frequency shows a rapid increase at a certain point in time, until the speed is reduced again before the frequency reaches a plateau, i. e. the allele is fixed. Recombination is expected to take place in the first phase of such a fixation process
alleles, which occur in a one- or few-repeat-steps distance around the sweep allele.
(Figure 1.3).
With time after the sweep event, the footprint is gradually lost. The recovery pattern is characterized by an excess of new mutations at low frequency. Thus, on the SNP level genetic hitchhiking is expected to produce a skew in the frequency distribution of segregating variants towards an access of rare polymorphisms in the population (Braverman et al. 1995). In microsatellites this recovery pattern can be observed as an increase of new
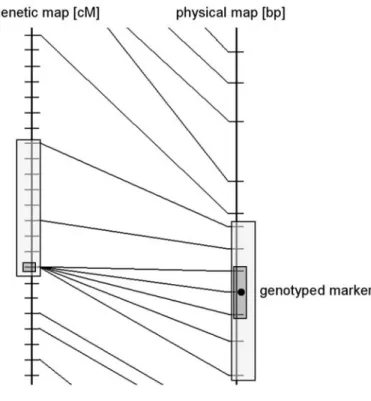
Figure 1.2 The size of the window is dependent on the local recombination rate. The left figure depicts the expected valley in a low recombining area, and the right figure shows a very narrow window, which is expected in a high recombination area for the same selection coefficients.
Screening for signatures of selective sweeps by comparing variability levels between populations is termed ‘hitchhiking mapping’ (Harr et al. 2002, Schlötterer 2003). The timeframe within which such footprints of positive selection are
observable in a hitchhiking mapping approach depends on the mutation rate of the investigated neutral marker. Suitable neutral marker systems for hitchhiking mapping are microsatellites (short tandemly repeated sequences of 1-6 bp in length) and single- nucleotide polymorphisms (SNPs). Although the substitution rates vary between different genomic regions, over the whole genome SNPs follow a more or less constant mutation rate of about 2.5 x 10⁻⁸ in humans (Nachman and Crowell 2000), 2.1 x 10⁻⁸ in mice (Nachman 1997), and 3 x 10⁻⁹ in insects (Andolfattoand Przeworski 2000). Whereas the mutation rate of microsatellites is highly locus specific. It is strongly correlated with the number of repeats a microsatellite carries. The longer a microsatellite, i.e. the more repeats it has, the faster it mutates (see Ellgren 2004 for review). The mutation rate of microsatellites is several orders of magnitude higher than of SNPs. Microsatellites of Drosophila melanogaster are short (on average up to 2 repeats) and this lowers their mutation rate. Schlötterer et al. (1998) estimated an average mutation rate of 6.3 x 10⁻⁶ per locus per generation in flies whereas for the longer microsatellites in humans, mice, rats and pigs mutation rates were estimated in a range of 10-2-10-5 (see Schug et al. 1998). Thus, especially in mammals the signatures of selective sweeps are expected to be blurred more quickly by new mutations in microsatellites than on the SNP variability level.
1
Figure 1.3 The probability that recombination, mutation or coalescence happen during the fixation time of a beneficial allele (Pennings and Hermisson in prep.).
In the genomic era the detection of positive selection on the genome scale is a challenge. Several studies on the theoretical (e.g. Maynard Smith and Haigh 1974, Wiehe 1998), as well as on the comparative genomic level (e.g.Smith and Eyre- Walker 2002, Birne and Eyre-Walker 2004, Bazykin et al. 2004, Keightley et al.
2005) and empirical data from natural populations (e.g. Payseur et al. 2002, Kauer et al. 2003, Kayser et al 2003, Storz et al 2004) have been published. There are two possible types of approaches, first, candidate gene approaches, in which the investigated genes are a priori expected to be under positive selection (e.g. resistance evolution (Kohn et al. 2000, Wootton et al. 2002), artificial selection (Vigouroux et al.
2002)), and second, whole genome approaches, where randomly selected genes throughout the genome are investigated. The first kind of approach gives insights into the general pattern of selective sweeps and can provide examples, whereas the second type leads to results concerning the frequency and intensity of positive selection in general. It is still unknown to which degree positive selection acts in nature. Do many genes change a little bit, or do just a few genes undergo great evolutionary changes?
This question can only be answered by empirical data from natural populations. The two major model organisms for such population-based approaches are Drosophila flies and humans. The focus in experimental studies, so far, is on adaptive changes connected to range expansion (Harr et al. 2002, Kauer et al. 2003, Kayser et al. 2003, Storz et al. 2004). For humans and fruitflies this is the out of Africa event. In this context, again an a priori expectation for positive selection is given. Here, selective sweeps are not expected on a certain class of genes but within the derived populations because of large changes in their environmental background. From recently published data by Haddrill et al. (2005) it is known that demographic events can lead to an overestimate of positive selection. Bottlenecks, like the one in Drosophila during the out of Africa event can produce reduced variability patterns similar to those of selective sweeps. Thus the differentiation between footprints of positive selection and bottleneck artefacts in regions identified by reduced variability in a derived population compared to an ancestral one is difficult. The selection of a suitable model system for hitchhiking mapping approaches should therefore – beside other important factors – also take care of the demographic background of the populations to be investigated.
1.2 The house mouse
The house mouse has become one of the major model organisms in bio- medical science. It provides many advantages enabling a variety of applications especially in the field of genetics (for review see Guénet and Bonhomme 2003). For several decades the mouse phylogeny and history (e.g. Boursot et al. 1993, Boursot et al. 1996), as well as its behaviour (e.g. Reimer and Petras 1967, Lidicker 1976) was intensively studied. In addition, the complete genome sequence is available since 2002 (Mouse Genome Sequencing Consortium 2002). These data combined provide a perfect background for the study of molecular evolution.
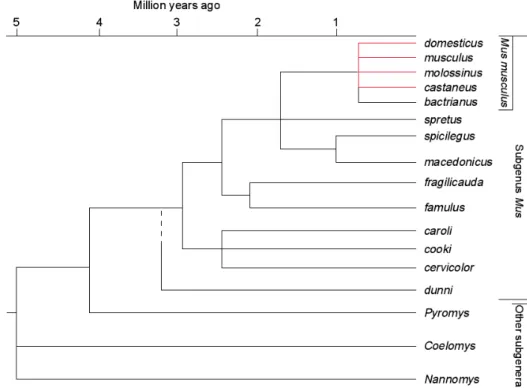
The house mouse evolved on the Indian subcontinent. Less than one million years ago the species Mus musculus split into three major sub-species (Figure 1.4).
The nominate subspecies M. m. musculus which is nowadays found all over northern Asia as well as in Eastern Europe, M. m. domesticus, which has its todays range in Western Europe, the Near East, Northern Africa, and recently introduced by humans into the New World, Subsaharan Africa and Australia, and a third subspecies, M. m.
castaneus, spread all over South East Asia.
Figure 1.4 Evolutionary tree of the genus Mus. The time scale is based on single copy nuclear DNA hybridization studies and is calibrated with the separation of Mus and Rattus, estimated at 10 Myr ago (taken from Guénet and Bonhomme 2003).
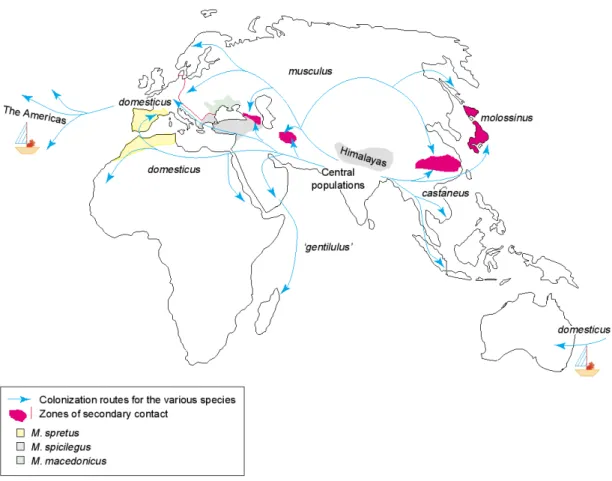
Figure 1.5 Geographical distribution of the different species of the genus Mus and routes of colonization. Mice of the American and Australian continents were imported by humans during colonization (taken from Guénet and Bonhomme 2003).
None of these subspecies are completely isolated genetically. There are several natural hybrid zones in the contact areas of their ranges (Figure 1.5). M. m.
musculus and M. m. domesticus meet in Europe, in the Caucasus, and in a region southeast of the Caspian Sea. M. m. musculus and M. m. castaneus have a contact zone in China. In Japan, these two subspecies have hybridized extensively, giving rise to an unique population often referred to as M. m. molossinus (Yonekawa et al. 1988).
The two distal subspecies M. m. domesticus and M. m. castaneus do not have a natural hybrid zone, but they can produce fertile offspring in the laboratory.
The available genome sequence of the house mouse is a mosaic of the three major lineages. About two third of the genome is of ‘domesticus’-origin and the remaining third is of non-domesticus origin, i.e. of ‘musculus’ and ‘castaneus’- origin (Wade et al. 2002, Wade and Daly 2005). In a recently published paper, Sakai et al.
(2005) showed that the ‘dometicus’ background of most common laboratory mouse strains (one of which is C57BL/6J, the strain used for the genome sequence assembly)
is mainly derived from the Western European lineage. Thus, the available genome sequence is most similar to mice from these populations.
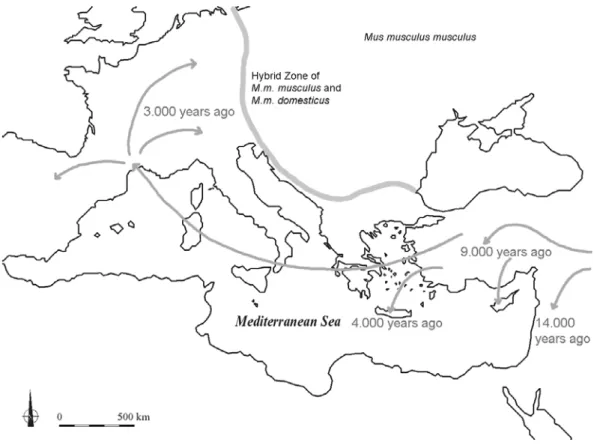
Figure 1.6 Colonization of Middle Europe by the house mouse Mus musculus domestius (Figure is based on data by Cucchi et al. (2005)). The mice followed the Neolithic in a massive invasion through Anatolia and then came into Southern France, most likely with Phoenician trading ships, from where they spread all over Western Europe.
The Western European mice have their origin in the Near East. The house mouse, M. m. domesticus moved westward from the Near East and entered Europe on the Mediterranean route. Cucchi et al. (2005) published details about the colonization of Western Europe by M. m. domesticus based on an analysis of palaeontological records. Their results clearly show that the house mouse invaded Europe not longer than 3,000 years ago via the Near East (in contrast to the route depicted in Figure 1.5 via northern Africa). While humans settled in Europe already 6,000 BC, the mice followed the Neolithic diffusion about 5,000 years later (Figure 1.6). Cucchi et al.
(2005) mention three possible reasons for this delayed invasion. First, maritime exchanges were very limited between the Eastern and Western Mediterranean Basin until 1,000 BC, which consequently leads to a very weak migratory flow, probably too weak to maintain stable pioneer populations. Second, the absence of suitable
ecological niches. Since the villages and cities w
Neolithic, commensal niches were poorly repre n
Europe than in the Near East until 1,000 BC. A sal
niches in Western Europe were favoured by the re
stable commensal environments developed. Since e
independent of human settlements, especially u it
was in an inferior position to the wood mouse he
environment increased. After that the house mouse was able to overwhelm the wood mouse in the commensal niches and colonized Europe in its entirety in a massive invasion. Thus, the populations of house mice in Western Europe represent a system which is about 9,000 generations (Karn et al
East.
ere strikingly different in the early sented and less stable in Wester
nd third, the available commen wood mouse until larger and mo the house mouse is not able to liv nder non-Mediterranean climate,
until the human pressure on t
. 2002) old and has its origin in the Near
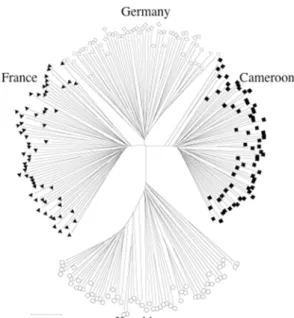
Figure 1.7 Allele sharing tree based on more than 200 microsatellites. The two western European populations, as well as samples from Cameroon can be clearly separated by this data.
Samples from a Kazakhstan population, representative of the subspecies M. m. musculus, are clearly distinct from the three M.
m. domesticus populations by a longer branch (Ihle et al. 2005).
The study here is based on samples from natural populations. In the major analysis I focus on two different populations of the Western Eurpean house mouse, one from the Cologne-Bonn-Area and the other one from the Massif Central.
Additionally to these two focal samples three other populations were included in different parts of the study, one very young ‚domesticus’ population from the recently colonized Subsaharan Africa and two populations of the subspecies M. m. musculus (one from Kazakhstan, a presumably old population, and one from the Czech Republic). In a previous study we have shown that the investigated populations are all
clearly distict, there is no significant gene flow between them (Figure 1.7, the ch Republic is not included) (Ihle et al. 2005). Thus, the sample
between the analyzed poplations, adaptive events would potentially sweep over all populations which have a reasonable exchange.
study of ev the populat samples re parts direct
population from the Cze
s allow the investigation of population specific selective sweeps. In the presence of geneflow
To summarize, the investigated populations harbour several advantages for the olutionary biology: based on fossil records the history is well documented, ions are genetically distinct, their maximum diverence time is known, both present derived populations, and a genome sequence, which is in its major
ly deduced from mice of the same geographical region is avialable.
1.3 Aim of the study
my study, I am investigating the molecular evolution in natural populations of the
microsatellite variability in natural populations. The results suggest that the high average mutation rate of microsatellites in mammals
variability can be excluded in mice.
• For systematically genome wide scans for signatures of positive selection a
ed. In Chapter 3 I introduce a new high throughput routine for genome screens using
ces the experimental effort to a minimum.
• Applying the described routine I systematically screened the genome for
minimal frequency with which positive selection events occur in natural populations. In a second step, I studied in detail the structure of
selective sweep in general.
In
house mouse.
• In Chapter 2 I tested and excluded a correlation of recombination rate with
counterbalances the effects of long-range hitchhiking in the mouse genome. Thus, a long term influence of the recombination rate on microsatellite
high throughput routine is indispensable. Variability comparisons between natural populations require large amounts of polymorphism data, i.e. an enormous experimental effort has to be perform
variability measurements of microsatellites. The routine enables a quick and reliable selection of candidate loci for selective sweeps and therefore redu
signatures of selective sweeps by comparing variability levels of microsatellites between natural populations. The results enabled me to calculate the
the detected footprints of positive selection. The patterns observed in the different regions allowed me to draw conclusions on different basic parameters of
1.4 Literatur
257- 68.
populations of Drosophila melanogaster.
Genetics 158: 657–665.
d Kondrashov, A.S. 2004. Positive selection at sites of multiple amino acid replacem
very different at the DNA level. Nature 65: 548-550.
ephan, W. and De Lorenzo, D. 2005. Evidence for a lective sweep in the wapl region of Drosophila melanogaster. Genetics Oct 3;
[Epub ahead of print].
Linkage limits the power of atural selection in Drosophila. Proceedings of the National Academy of Sciences, USA 99
Birne, N. and Eyre-Walker, A. 2004. The genomic rate of adaptive amino acid substitutions in Drosophila.
Boursot, P., Auffray, J.-C., Britton-Davidian, J. and Bonhomme, F. 1993.
Andolfatto, P. and Prezeworski, M. 2000. A Genome-Wide Departure From the Standard Neutral Model in Natural Populations of Drosophila. Genetics 156:
2
Andolfatto, P. and Prezeworski, M. 2001. Regions of lower crossing over habor more rare variants in African
Bazykin, G.A., Kondrashov, F.A., Ogurtsov, A.Y., Sunyaev, S. an
ents since rat-mouse divergence. Nature 429: 558-562.
Begun, D.J. and Aquadro, C.F. 1993. African and North American populations of Drosophila melanogaster are
3
Beisswanger, S., St se
Betancourt, A.J. and Presgraves, D.C. 2002.
n
: 13616–13620.
Molecular Biology and Evolution 21(7): 1350-1360.
The Evolution of house mice. Annu. Rev. Ecol.Syst. 24: 119-52
itochondrial DNA phylogeny. Journal of Evolutionary Biology 9 (4): 391-415.
Braverman, J.M., Hudson R.R., Kaplan, N.L., Langley, C.H. and Stepha
C. and Bruce T. Lahn, B.T. 2005. Selective Constraint on oncoding Regions of Hominid Genomes PLoS Computational Biology 1(7): e73.
, J.-C. 2005. First occurrence of the ouse mouse (Mus musculus domesticus Schwarz & Schwarz, 1943) in the Western Medite
llgren, H., 2004 Microsatellites: simple sequences with complex evolution.
Nature
Eyre-Walker, A., Keightley, P.D., Smith, N.G.C. and Gaffney, D. 2002 Quantif ing the slightly deleterious mutation model of molecular evolution.
Molecu
Fay, J. and Wu, C.-I. 2000. Hitchhiking under positive Darwinian selection.
155: 1405-1413.
ild mice: an ever-increasing contribution to a popular mammalian model. Trends in Genetics 19: 24-31.
Boursot, P., Din, W., Anand, R., Darviche, D., Dod, B., VonDeimling, F., Talwar, G.P. and Bonhomme, F. 1996. Origin and radiation of the house mouse:
M
n, W. 1995. The hitchhiking effect on the site frequency spectrum of DNA polymorphisms. Genetics 140: 783–796.
Bush, E.
N
Cucchi, T., Vigne, J.-D. and Auffray h
rranean: a zooarchaeological revision of subfossil occurrences. Biological Journal of the Linnean Society 84: 429-446.
E
reviews 5: 435-443.
y
lar Biolology and Evolution 19(12): 2142–2149.
Genetics
Guenet, J.L. and Bonhomme, F. 2003. W
Multilocus patterns of nucleotide variability and the demographic and selection history
s. PLoS Biology 1(2): e58.
s of the National Academy of Sciences, USA 99: 12949- 2954.
Ed. 3.
inauer Associates, Sunderland, Mass. 542 pp.
as, M. and Tautz, D. 2006 Tracing ignatures of selective sweeps in natural populations of the house mouse. Molecular Biolog
Karn, R.C, Orth, A., Bonhomme, F. and Boursot, P. 2002. The Complex History of a Gene Proposed to Participate in a Sexual Isolation Mechanism in House Mice. Molecular Biology and Evolution
Kauer, M.O., Dieringer, D. and Schlötterer, C. 2003. A multilocus variability s
: 1137-1148.
iology and Evolution 20: 893-900.
Haddrill, P.R., Thornton, K.R., Charlesworth, B. and Andolfatto, P. 2005
of Drosophila melanogaster populations. Genome Research 15: 790-799
Hardison, R.C. 2003. Comparative Genomic
Harr, B., Kauer, M. and Schlötterer, C. 2002. Hitchhiking mapping – a population based fine scale mapping strategy for adaptive mutations in Drosophila melanogaster. Proceeding
1
Hartl, D.L. and Clark, G.C. 1997 Principals of population genetics S
Ihle, S., Ravaoarimanana, I., Thom s
y and Evolution 23(4): 790-797.
19: 462-471.
creen for positive selection associated with the “out of Africa” habitat expansion of Drosophila melanogaster. Genetics 165
Kayser, M., Bauer, S. &Stoneking, M. 2003. A genome scan to detect candidate regions influenced by local natural selection in human populations.
Molecular B
Keightley, P.D., Lercher, M.J. and Eyre-Walker, A. 2005. Evidence for widespread degradation of gene control regions in hominid genomes. PLOS 3(2): e42.
7911-7915.
Mouse Genome Sequencing Consortium 2002. Initial sequencing and comparative analysis of the mouse genome. Nature 420(6915): 520-62.
Nachman M.W. 1997. Patterns of DNA variability at X-linked loci in Mus domesticus. Genetics 147: 1303–1316.
Nachman, M.W. 2001. Single nucleotide polymorphisms and recombination rate in humans Trends in Genetics 17(9): 481-485.
ility and recombination rates at X-linked loci in humans. Genetics 150:
1133-1141.
Khaitovich, P., Weiss, G., Lachmann, M., Hellmann, I., Enard, W., Muetzel, B., Wirkner, U., Ansorge, W. and Pääbo, S. 2004. A Neutral Model of Transcriptome Evolution. PLoS Biology 2(5): e132.
Kohn, M.H., Pelz, H.-J. and Wayne, R.K. 2000. Natural selection mapping of the warfarin-resistance gene. Proceedings of the National Academy of Sciences, USA 97(14):
Lidicker, W.Z. 1976. Social Behaviour and Density Regulation in House Mice Living in Large Enclosures. Journal of Animal Ecology 45(3): 677-697.
Maynard Smith, J. and Haigh, J. 1974. The hitch-hiking effect of a favorable gene. Genetic Research 23: 23-35.
Nachman, M.W, Bauer, V.L., Crowell, S.L. and Aquadro, C.F. 1998.
DNA variab
Nachman, M.W. and Crowell, S.L. 2000. Estimate of the mutation rate per ucleotide in humans. Genetics 156: 297-304.
. Searching for vidence of positive selection in the human genome using patterns of microsatellite variabi
Pennings, P.S. and J. Hermisson, J. The title of the paper will be Soft Sweeps III - The signature of positive selection from recurrent mutation. in preparation.
Reimer, J. D. and Petras, M.L. 1967. Breeding Structure of the House Mouse,
Sakai, T., Kikkawa, Y., Miura, I., Inoue, T., Moriwaki, K., Shiroishi, T., Satta,
Schlötterer, C. 2003. Hitchhiking mapping functional genomics from the opulation genetics perspective. Trends in Genetics 19: 32-38.
. High mutation rate for a long microsatellite allele in Drosophila melanogaster provides evidence for
ic mutation rates. Molecular Biology and Evolution 15: 1269–1247.
Schug, M.D., Hutter, C.M., Noor, M.A.F. and Aquadro, C.F. 1998.
Mutation and evolution of microsatellites in Drosophila melanogaster. Genetica n
Payseur, B.A., Cutter A.D. and Nachman, M.W. 2002 e
lity. Molecular Biology and Evolution 19: 1143-1153.
Mus musculus, in a Population Cage. Journal of Mammalogy 48(1): 88-99.
Y., Takahata, N. and Yonekawa, H. 2005. Origins of mouse inbred strains deduced from whole-genome scanning by polymorphic microsatellite loci.
Mammalian Genome 16: 11-19.
Schlötterer, C. 2002. A microsatellite-based multilocus screen for the identification of local selective sweeps. Genetics 160: 753–763.
p
Schlötterer, C, Ritter, R., Harr, B. and Brem, G. 1998
allele-specif
102/10
hhiking and associative overdominance at a icrosatellite locus. Molecular Biology and Evolution 12: 473–480.
tephan, W. and Langley, C.H. 1998. DNA polymorphism in lycopersicon and crossing-over per physical length. Genetics 150: 1585–1593.
Storz, J.F., Payseur, B.A. and Nachman, M.W. 2004. Genome scan for DNA variability in humans reveal evidence for selective sweeps outside of Africa.
Molecular Biology and Evolution 21: 1800-1811.
Vigouroux, Y., Mullen, M., Hittinger, C.T., Houchings, L. and Schlulz, L.
2002 Identifying genes of agronomic importance in maize by screening microsatellites for evidence of selection during domestication. Proceedings of the National Academy of Sciences, USA 99: 9650-9655.
Wade, C.M., Kulbokas, E.J., Kirby, A.W., Zody, M.C., Mullikin, J.C., Lander, E.S., Lindblad-Toh, K. and Daly, M.J. 2002. The mosaic structure of variation in the laboratory mouse genome. Nature 420: 574-578.
Wade, C.M. and Daly, M.J. 2005. Genetic variation in laboratory mice.
Nature Genetics 37(11): 1175-80.
3: 359–367.
Slatkin, M. 1995. Hitc m
Smith, N. G. and Eyre-Walker, A. 2002 Adaptive protein evolution in Drosophila. Nature 415: 1022-1024.
Stearns and Hoekstra 2005. Evolution an introduction. Oxford University Press. 575 pp.
S
Wiehe, T. 1998. The effect of selective sweeps on the variance of the allele
d b
Popula
.I.,
Magill, A.J. and Su, X uine selective sweeps
in Plasmodium falsiparum. Nature 418: 320-323.
Yonekawa, H., Moriwaki, K., Gotoh, O., Miyashita, N., Matsushima, Y., Shi, Zhen, X.L. and Tagashira, Y. 1988. Hybrid origin of Japanese mice Mus musculus molossinus: evidence from restriction analysis of mitochondrial DNA. M
istri ution of a linked multiallele locus: hitchhiking of microsatellites. Theoretical tion Biology 53: 272–283.
Wootton, J.C., Feng, X., Ferdig, M.T., Cooper, R.A, Mu, J., Baruch, D .Z. 2002. Genetic diverstiy and chloroq
L.M., Cho, W.S.,
olecular Biology and Evolution 5: 63–78.
2 Microsatellite variability in wild populations of the house mouse is not influenced by differences in
chromosomal recombination rates
Meike Thomas, Sonja Ihle, Iary Ravaoarimanana, Susanne Krächter,
in mammals counter balances the effects of long range hitchhiking in the mouse genome.
2.2 Introduction
Levels of polymorphism of neutral loci depend on mutation rate and effective population size. However, neutral loci can be linked to loci experiencing positive or negative selection (see Andolfatto 2001 and Schlötterer 2003 for recent reviews). In this case, parameters such as recombination rate and degree of selection on the linked locus can also influence the level of polymorphism at the neutral locus. For example, a local reduction in polymorphism can provide a signature of a selective sweep, i.e., the recent spread of beneficial mutation (Maynard Smith and Haigh 1974, Braverman et al. 1995, Slatkin 1995). Negative or background selection can also influence the
Thomas Wiehe and Diethard Tautz
2.1 Abstract
Differences in recombination rates along the chromosomes can influence the evolution of neutral loci via hitchhiking effects. Generally, these effects should be stronger in regions of low recombination than in regions of high recombination. The detailed information on physical and genetic maps in the house mouse allows now to assess the correlation between neutral variability and recombination rates at given chromosomal regions. We have chosen 29 microsatellite loci from chromosomal regions which show differences in recombination rates and have tested their variability in samples from five wild populations of Mus m. musculus and Mus m.
domesticus. Our results provide no evidence for a correlation between microsatellite variability and recombination rates. This suggests that the high average mutation rate of microsatellites
levels of polymorphism at linked loci (Hudson 1994, Charlesworth et al. 1995; Kim
this is widely interpreted as evidence
Langley 1998, Nachman et al. 1998, Andolfatto and Prezeworski 2001, Betancourt and
Knowledge of the correla polym
selective s
(Schlötterer 2002). We have started a systematic screen for selective sweeps in house
preparation). We are therefore particularly interested in whether differences in recom
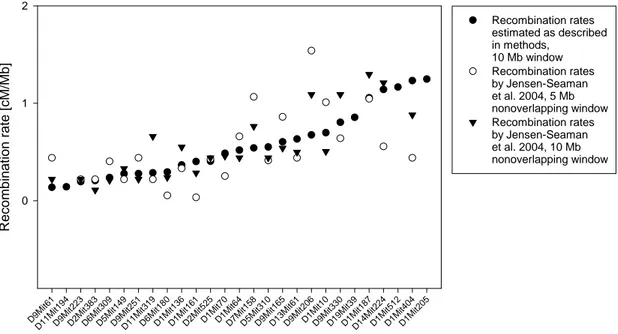
polymorphism in mouse. Recombination rates are known to differ across the mouse g
2002 for review) and detailed genomewide estimates of recombination rates are now ava
variability of 29 microstaellite loci in five wild populations and correlate these data w
l
and Stephan 2000). Several cases of correla levels of nucleotide diversity are known, and that
tions between recombination rate and
hitchhiking is common (Begun and Aquadro 1992, Nachman 1997, Stephan and
Presgraves 2002).
tions between recombination rate and levels of orphism in natural populations is essential for projects in which signatures of
weeps are used to identify genes experiencing positive selection
mouse using levels of polymorphism of mapped microsatellites (Ihle et al. in
bination rate are typically associated with differences in microsatellite
enome (e.g. Nachman and Churchhill 1996; Froenicke et al. 2002; see Nachman
ilable (Rowe et al. 2003, Jensen-Seaman et al. 2004). We have studied here the
ith the associated recombination rates. We found no evidence that microsatellites oc
of polym Nachm
ated in r or
egi phism
ons w
. This result is consistent ith different recombination
with findings in rates had signific
hum antly
ans (Payseur an different levels
d an 2000).