sustainability.hapres.com
Article
Monitoring Sustainable Development: Climate and Energy Policy Indicators
Claudia Kettner 1,*, Daniela Kletzan-Slamanig 1, Angela Köppl 1, Beate Littig 2, Irina Zielinska 2
1 Austrian Institute of Economic Research (WIFO), Arsenal Objekt 20, 1030 Vienna, Austria
2 Institute for Advanced Studies (IHS), Josefstädter Str. 39, 1080 Vienna, Austria
* Correspondence: Claudia Kettner, Email: claudia.kettner@wifo.at;
Tel.: +43-1-798-2601-406.
ABSTRACT
Both the UN SDGs and the Paris Agreement imply ambitious long-term targets that can only be met through a fundamental restructuring of economic and social systems. We propose a set of energy and climate policy indicators that allow informed policymaking and go beyond the UN indicator set. The indicators cover the whole energy system as well as the three dimensions of sustainable development. Our approach combines an energy service centered perspective with research on energy and climate indicators, and it embeds the indicator framework in the broader socio-ecologic context. We compile a set of 109 high-level energy indicators for four key sectors of energy demand (households, transport, industry and manufacturing) that can be further disaggregated to 334 indicators. For electricity and heat supply we assemble a set of 21 indicators that can be disaggregated to 54 indicators, differentiating by energy source and plant type. Interactions, i.e., synergies and conflicts, between the different target dimensions and the corresponding indicators need to be carefully considered. The main aim of the comprehensive indicator set is to help policymakers define measurable goals and strategies in the field of energy and climate policy, as well as to provide a tool for policy monitoring, evaluation and revision. The challenge in using indicator systems for policy analysis is that they have to consider a multitude of aspects in order to reflect the complexity of the issues analyzed and at the same time have to deliver concise information on various trends.
KEYWORDS: sustainable development; indicator systems; energy policy;
climate policy
INTRODUCTION
2015 was marked by two important outcomes of international negotiations: the agreement on the UN Sustainable Development Goals (SDGs) and the Paris Climate Agreement. Both imply ambitious (long-term) Open Access
Received: 17 February 2020 Accepted: 23 May 2020 Published: 28 May 2020
Copyright © 2020 by the author(s). Licensee Hapres, London, United Kingdom. This is an open access article distributed under the terms and conditions of Creative Commons Attribution 4.0 International License.
Journal of Sustainability Research 2 of 42
targets that can only be met with a fundamental restructuring of economic and social systems. The greenhouse gas (GHG) emission reductions—required to limit climate change to well below 2 °C or even 1.5 °C above pre-industrial levels, as stated in the Paris Climate Agreement—call for a fundamental decarbonization. A substantial contribution needs to come from the energy system because energy-related emissions account for the largest share in total GHG emissions, e.g., 78% for the EU total [1].
For both the Paris Agreement and the SDGs, research is needed because the scope of the required changes calls for new measurement and monitoring approaches. This comprises work on governance structures, pathway analyses, as well as suitable indicator sets that comprehensively capture the socio-economic and environmental aspects and allow depicting synergies and trade-offs between the dimensions of sustainable development as well as between targets [2,3]. Therefore, indicator sets that provide more detailed information than the set of targets and indicators proposed by the UN are called for. In this paper, we propose a novel Climate and Energy Policy (ClEP) indicator system for the EU Member States that allows for informed policymaking. Compared to those approaches which mainly focus on progress based on the UN indicator set [4], our indicator system contains more disaggregated information with a focus on energy and climate policy. The proposed sustainable energy indicators cover the entire energy system as well as the three dimensions of sustainable development. The approach combines an energy service centered perspective with research on energy and climate indicators, and it embeds the indicator framework in a broader socio-ecologic context. The main aim of the comprehensive indicator set is to help policymakers define measurable goals and strategies in the field of energy and climate policy and to provide a tool for policy monitoring, evaluation and revision. For the EU Member States, relevant data so far are mainly available at the national level. Therefore, the relevant target group is national energy and climate policymakers, allowing them to conduct performance comparisons and to identify successful solutions. Moreover, some of the indicators could complement the existing energy and climate policy indicators at the EU level. One key advantage of our indicator system is its ability to facilitate public debate on trade-offs between different targets, thereby providing a basis for informed decision-making.
For a series of issues, in particular pertaining to the social dimension of sustainable energy development, at present no data are available and therefore have to be omitted from the analysis. The closing of the gap has to be spurred by policymakers (in providing the legal basis for data collection) and statistical offices in actual data collection and processing.
This would help identify interlinkages and trade-offs between the dimensions of sustainable development as well as between different sectors.
Journal of Sustainability Research 3 of 42
The paper is structured as follows: The second section provides the broader context, embedding the climate and energy policy indicators into the socio-ecological framework defined by the UN Sustainable Development Goals. In the third section the conceptual approach of the ClEP indicator framework is presented. The fourth section discusses interactions between the target dimensions and indicators. The final section concludes.
CLIMATE AND ENERGY POLICY INDICATORS IN THE CONTEXT OF THE UN SDGS
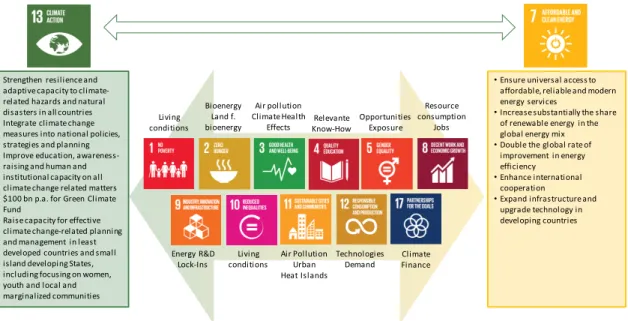
The manifold interactions between the 17 SDGs and different sub-targets constitute a broad research area [2,5–10]. The assessment of interlinkages is of high relevance because ignoring synergies or trade-offs creates a risk of unintended outcomes. This applies to the entirety of the SGDs but also to the set of energy and climate policy indicators described below. Figure 1 illustrates which thematic areas of SDGs 7 and 13 we identified as being strongly or directly linked to eleven other goals and which interactions between these objectives must be considered to achieve the targets and design adequate monitoring approaches. For instance, policies aimed at reducing energy expenditures of poor households (thus contributing to improvements in the social dimension/SDG 10) might increase energy demand and in turn emissions (with negative effects on the environmental dimension/SDG 13), if not properly designed.
•Ensure universal access to affordable, reliable and modern energy services
•Increase substantially the share of renewable energy in the global energy mix
•Double the global rate of improvement in energy efficiency
•Enhance international cooperation
•Expand infrastructure and upgrade technology in developing countries
•Strengthen resilience and adaptive capacity to climate- related hazards and natural disasters in all countries
•Integrate climate change measures into national policies, strategies and planning
•Improve education, awareness- raising and human and institutional capacity on all climate change related matters
•$100 bn p.a. for Green Climate
•FundRaise capacity for effective climate change-related planning and management in least developed countries and small island developing States, including focusing on women, youth and local and marginalized communities
Air Pollution Urban Heat Islands
Technologies Demand Living
conditions Climate
Finance Energy R&D
Lock-Ins Bioenergy
Land f.
bioenergy Relevante
Know-How Air pollution ClimateHealth
Effects Opportunities
Exposure
Resource consumption Living Jobs
conditions
Figure 1. Interaction of the SDGs “Climate Action” and “Affordable and Clean Energy” with other SDGs;
authors’ own illustration.
The indicator set is embedded in the broader socio-ecological framework defined by the UN SDGs but specifically focuses on two goals:
“Affordable and clean energy” (SDG 7) and “Climate Action” (SDG 13). It consists of operational indicators putting energy services at the center
Journal of Sustainability Research 4 of 42
because energy services generate welfare instead of energy flows [11–17].
The indicator set starts with energy services in four demand-side sectors—residential buildings, transport, manufacturing and services—which are complemented by consistent indicators for sustainable electricity and heat supply.
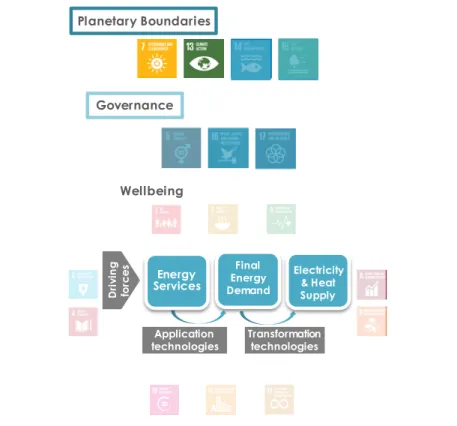
Figure 2A presents a conceptual illustration for a better understanding of the interlinkages between the SDGs. We use a “doughnut”
representation similar to other research concerned with the SDGs [18], in which the socio-ecological framework is partitioned into three layers—wellbeing, governance and planetary boundaries [2], and to which the SDGs are assigned in the context of our research. This combination of the concept of wellbeing and the concept of planetary boundaries creates a space in which sustainable development can be achieved, i.e., social goals are met while at the same time the integrity of ecosystems is preserved so that they can provide the services on which our societies depend. In this visualization we attribute ten SDGs to the layer of wellbeing (inner layer). The second layer of governance structures constitutes the supporting framework for wellbeing and comprises three SDGs. The third layer comprises the planetary boundaries, i.e., the biophysical base and natural limits for all human activities.
As emphasized in TWI2050 [19], the starting point for any clustering of SDGs must be the definition of the research question for which it is of relevance. There is no “absolute” categorization of the SDGs because they do not comprise a specific model, but TWI2050 [19] concluded that “(i) the SDGs are universal, holistic and interdependent and thereby indivisible, and (ii) any clustering method is context specific, being dependent on the question being addressed, modelling approach, or regional context.”
To develop this representation or clustering of SDGs we focused on human wellbeing and those goals that directly affect living conditions and quality of life. Our energy system approach [14] can then be integrated into this perspective (Figure 2(B)). This allows considering in more detail to what extent energy services, i.e., the use derived from
“consuming” energy, are crucial for all aspects of economic and social development. A given level of energy services can be provided by different combinations of technologies (stocks) and energy flows. The range of available technologies and energy sources thus opens up a spectrum of options entailing different environmental impacts for any given energy service level. The energy efficiency of the capital stock (i.e., both of conversion technologies and application technologies/passive systems) is one key determinant of energy flows and the corresponding greenhouse gas emissions associated with a certain level of energy services [11,14,15]. In contrast to the welfare-inducing energy services, the physical aspects of energy (flows) and related greenhouse gas emissions are part of the “planetary boundaries”.
Journal of Sustainability Research 5 of 42
Planetary Boundaries
Governance
Wellbeing
Application technologies Driving forces Energy
Services
Final Energy Demand
Electricity
& Heat Supply
Transformation technologies Planetary Boundaries
Governance
Wellbeing
(A) Embedding the SDGs into the broader socio-ecological context (B) Embedding the ClEP indicator approach into the broader socio-ecological context
Figure 2. Socio-ecological context; authors’ own illustration.
Journal of Sustainability Research 6 of 42
Thus, the detailed indicator set describes or quantifies the areas of energy and climate, on the one hand, but emphasizes the relevance of these areas for people’s wellbeing, on the other. And while the interlinkages between energy and climate are at the center of our analysis, interlinkages with other SDGs, although highly relevant (see also Figure 1), are beyond the scope of this research.
THE CLEP INDICATOR FRAMEWORK Literature Overview
The multidimensionality of sustainable development entails a high degree of complexity. Sets of indicators—such as those developed, for instance, by the EU and the UN [20–24]—are considered to be appropriate tools with which to reduce this complexity and to illustrate the interactions between society and ecosystems.
The adoption of the SDGs and the publication of the corresponding indicator framework have stimulated the latest wave of developing comprehensive indicator frameworks. The SDGs of the 2030 Agenda for Sustainable Development are the continuation of the Millennium Development Goals [23] and were adopted by 156 states in 2015 after an extensive planning and consultation process. In the SDGs, the overarching aims of ending all forms of poverty, protecting the planet and ensuring prosperity for everyone are broken down into 17 goals and 169 detailed targets. In contrast to the Millennium Development Goals, the SDGs refer not only to developing countries but to all signatories.
For the monitoring of the SDGs and the respective sub-targets, an indicator system comprising 244 indicators (or respectively 233 indicators, with some occurring more than once in the system) was developed, some of which are used to monitor more than one target [22].
In general, the goals/targets and the respective indicators are based on the three dimensions of sustainable development and can be divided into the five pillars of the Agenda 2030 (the five “Ps”—people, planet, prosperity, peace, partnership).
In the EU, the UN SDG framework has been implemented by Eurostat as well as at the Member State level, with national indicator frameworks differing from the Eurostat system. In the following, the indicators for SDGs 7 and 13 proposed by the UN are compared with the indicators put forward by Eurostat, and the indicators developed for Austria as an example of a national indicator framework. A different approach is applied by the Sustainable Development Solutions Network (SDSN) and the Bertelsmann Stiftung, who provide a composite SDG Index and dashboards describing countries’ progress towards achieving the SDGs [25]. The 2018 SDG Index includes 88 global indicators and 111 indicators for the Dashboard for 156 OECD countries. Thirty-nine of these indicators match UN indicators exactly, 28 are closely aligned, and 44 are not included in the UN framework.
Journal of Sustainability Research 7 of 42
Eurostat has developed its own indicator set that puts emphasis on interlinkages between targets by defining so-called multi-purpose indicators (monitoring more than one target). The Eurostat framework consists of 100 indicators, with a maximum of 6 indicators being assigned to each SDG.
For Austria, the national statistical office, Statistics Austria, implemented an indicator framework closely related to the UN indicators [26]. For almost half of the proposed UN indicators, national data are currently available from Statistics Austria or from other data sources.
Forty-five indicators that are not relevant to Austria (e.g., indicators related to marine life or targeted at developing countries) have been omitted. For another 19% of the proposed UN indicators no data for Austria are available. However, the national statistical office has added additional indicators that are of particular relevance from an Austrian perspective (headline indicators from the national wellbeing measurement initiative “Wie geht’s Österreich”).
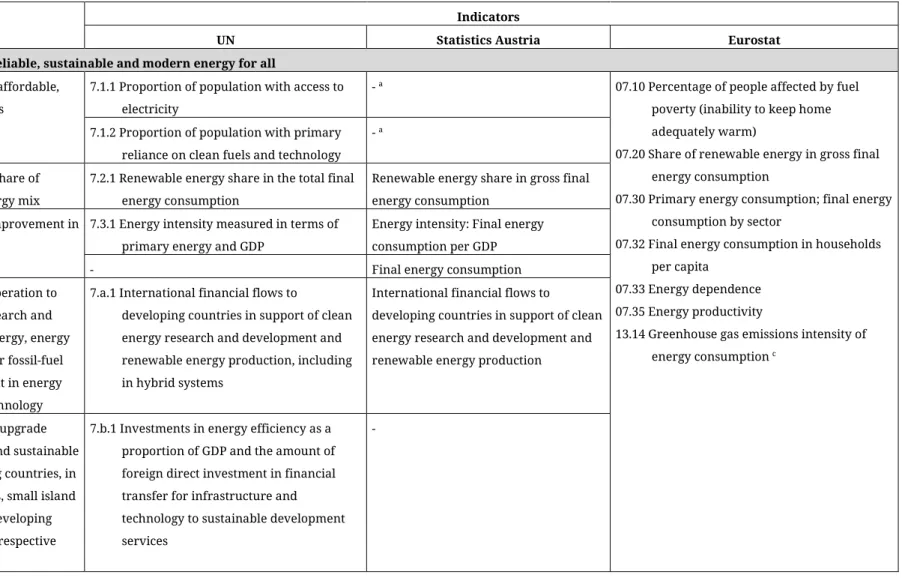
Table 1 lists the indicators used for monitoring SDG 7 “Affordable and clean energy” and SDG 13 “Climate Action” developed by the UN, Statistics Austria and Eurostat, along with the sub-targets. The indicators by the UN and Statistics Austria largely correspond to the ten sub-targets.
For SDG 7, these include providing access to affordable, reliable and modern energy services for all, substantially increasing the share of renewable energy and accelerating energy efficiency improvements, along with assistance for lower-income countries. While Statistics Austria has not adopted the indicators “7.1.1 Proportion of population with access to electricity” and “7.1.2 Proportion of population with primary reliance on clean fuels and technology” because these targets have already been achieved in Austria, final energy consumption has been included as an additional indicator. The six Eurostat indicators include information on energy poverty, final energy consumption, energy dependence, energy productivity and GHG emissions intensity of energy consumption as a multi-purpose indicator.
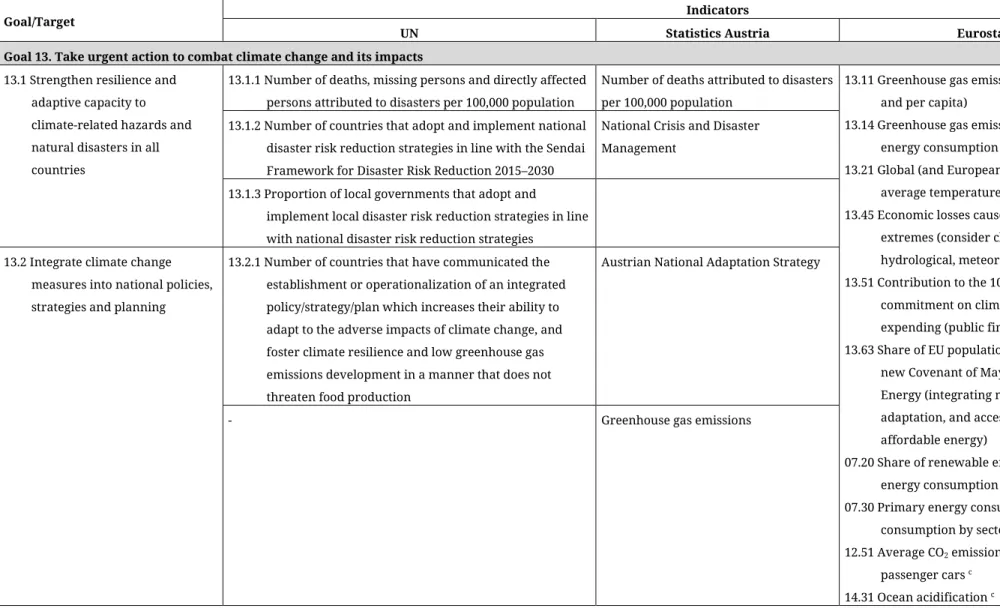
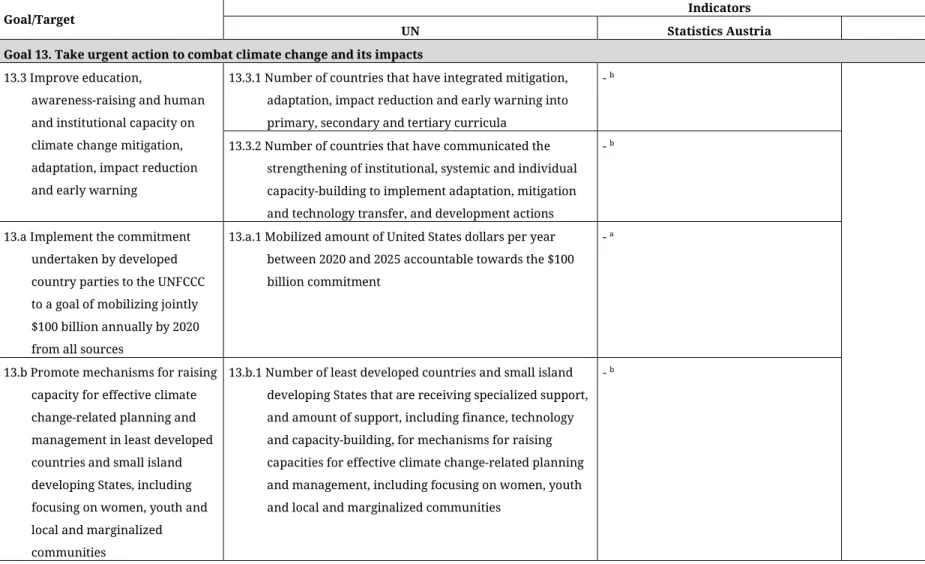
For SDG 13, the UN indicators focus mostly on a policy/finance dimension and cover both climate change mitigation and adaptation.
Most indicators have a global dimension, e.g., “13.3.2 Number of countries that have communicated the strengthening of institutional, systemic and individual capacity-building to implement adaptation, mitigation and technology transfer, and development actions”. Statistics Austria has omitted most of these global targets and adapted some of them to the national context. In addition, it included GHG emissions as an indicator. The Eurostat indicators, in contrast, focus on GHG emissions and the impacts of climate change. Moreover, Eurostat stresses the nexus between emissions and energy use by including final energy consumption and the share of renewables as multi-purpose indicators.
Journal of Sustainability Research 8 of 42
Table 1. Indicators used by statistical offices for Monitoring SDGs 7 and 13.
Goal/Target Indicators
UN Statistics Austria Eurostat
SDG 7. Ensure access to affordable, reliable, sustainable and modern energy for all 7.1 By 2030, ensure universal access to affordable,
reliable and modern energy services
7.1.1 Proportion of population with access to electricity
- a 07.10 Percentage of people affected by fuel
poverty (inability to keep home adequately warm)
07.20 Share of renewable energy in gross final energy consumption
07.30 Primary energy consumption; final energy consumption by sector
07.32 Final energy consumption in households per capita
07.33 Energy dependence 07.35 Energy productivity
13.14 Greenhouse gas emissions intensity of energy consumption c
7.1.2 Proportion of population with primary reliance on clean fuels and technology
- a
7.2 By 2030, increase substantially the share of renewable energy in the global energy mix
7.2.1 Renewable energy share in the total final energy consumption
Renewable energy share in gross final energy consumption
7.3 By 2030, double the global rate of improvement in energy efficiency
7.3.1 Energy intensity measured in terms of primary energy and GDP
Energy intensity: Final energy consumption per GDP
- Final energy consumption
7.a By 2030, enhance international cooperation to facilitate access to clean energy research and technology, including renewable energy, energy efficiency and advanced and cleaner fossil-fuel technology, and promote investment in energy infrastructure and clean energy technology
7.a.1 International financial flows to
developing countries in support of clean energy research and development and renewable energy production, including in hybrid systems
International financial flows to
developing countries in support of clean energy research and development and renewable energy production
7.b By 2030, expand infrastructure and upgrade technology for supplying modern and sustainable energy services for all in developing countries, in particular least developed countries, small island developing States and landlocked developing countries, in accordance with their respective programmes of support
7.b.1 Investments in energy efficiency as a proportion of GDP and the amount of foreign direct investment in financial transfer for infrastructure and technology to sustainable development services
-
Journal of Sustainability Research 9 of 42
Table 1. Cont.
Goal/Target Indicators
UN Statistics Austria Eurostat
Goal 13. Take urgent action to combat climate change and its impacts 13.1 Strengthen resilience and
adaptive capacity to climate-related hazards and natural disasters in all countries
13.1.1 Number of deaths, missing persons and directly affected persons attributed to disasters per 100,000 population
Number of deaths attributed to disasters per 100,000 population
13.11 Greenhouse gas emissions (indexed totals and per capita)
13.14 Greenhouse gas emissions intensity of energy consumption
13.21 Global (and European) near surface average temperature
13.45 Economic losses caused by climate extremes (consider climatological, hydrological, meteorological)
13.51 Contribution to the 100bn international commitment on climate related expending (public finance)
13.63 Share of EU population covered by the new Covenant of Mayors for Climate and Energy (integrating mitigation,
adaptation, and access to clean and affordable energy)
07.20 Share of renewable energy in gross final energy consumption c
07.30 Primary energy consumption; final energy consumption by sector c
12.51 Average CO2 emissions per km from new passenger cars c
14.31 Ocean acidification c 13.1.2 Number of countries that adopt and implement national
disaster risk reduction strategies in line with the Sendai Framework for Disaster Risk Reduction 2015–2030
National Crisis and Disaster Management
13.1.3 Proportion of local governments that adopt and
implement local disaster risk reduction strategies in line with national disaster risk reduction strategies
13.2 Integrate climate change measures into national policies, strategies and planning
13.2.1 Number of countries that have communicated the establishment or operationalization of an integrated policy/strategy/plan which increases their ability to adapt to the adverse impacts of climate change, and foster climate resilience and low greenhouse gas emissions development in a manner that does not threaten food production
Austrian National Adaptation Strategy
- Greenhouse gas emissions
Journal of Sustainability Research 10 of 42
Table 1. Cont.
Goal/Target Indicators
UN Statistics Austria Eurostat
Goal 13. Take urgent action to combat climate change and its impacts 13.3 Improve education,
awareness-raising and human and institutional capacity on climate change mitigation, adaptation, impact reduction and early warning
13.3.1 Number of countries that have integrated mitigation, adaptation, impact reduction and early warning into primary, secondary and tertiary curricula
- b
13.3.2 Number of countries that have communicated the strengthening of institutional, systemic and individual capacity-building to implement adaptation, mitigation and technology transfer, and development actions
- b
13.a Implement the commitment undertaken by developed country parties to the UNFCCC to a goal of mobilizing jointly
$100 billion annually by 2020 from all sources
13.a.1 Mobilized amount of United States dollars per year between 2020 and 2025 accountable towards the $100 billion commitment
- a
13.b Promote mechanisms for raising capacity for effective climate change-related planning and management in least developed countries and small island developing States, including focusing on women, youth and local and marginalized communities
13.b.1 Number of least developed countries and small island developing States that are receiving specialized support, and amount of support, including finance, technology and capacity-building, for mechanisms for raising capacities for effective climate change-related planning and management, including focusing on women, youth and local and marginalized communities
- b
a Not relevant for Austria/already achieved, b Indicator at UN level, c Multipurpose indicator.
Journal of Sustainability Research 11 of 42
The indicator systems described above cover the three pillars of sustainable development [27], also recognizing the central role of energy and climate change. Given that the scope of these indicator systems is very broad, they are not suitable for a detailed monitoring or steering of policy towards achieving the SDGs. Several indicator sets are available that focus on energy as a key element in sustainable development, most notably the Sustainable Energy Development (SED) Indicators [28]
devised by the International Energy Agency (IEA) and the International Atomic Energy Agency (IEA), and the IAEA Energy Indicators for Sustainable Development [29]. These will be described in more detail below.
The SED indicators measure the progress towards “the provision of adequate energy services at affordable cost in a secure and environmentally benign manner, in conformity with social and economic development needs” [28]. IEA and IAEA propose 41 indicators for sustainable energy development that cover the whole energy system and its driving forces. This means the indicators cover primary energy supply, transformation technologies and final energy demand as well as energy intensities, the fuel mix and energy service demand. Economic and social factors (e.g., GDP, prices, population growth) affect the energy system and emissions resulting from energy consumption and energy supply.
The IEA/IAEA SED indicators have been applied to a number of countries (e.g., Lithuania [30], Cuba [31] and Mexico [32]). Depending on the challenges of energy policy and data availability, in most cases only a subset of indicators was used. Davidsdottir et al. [33] applied a set of SED indicators to Iceland, UK, USA, Sweden, Brazil and Mexico. In addition, Davidsdottir et al. [33] and Ibarrarán Viniegra et al. [34] show that the SED indicators can be communicated more easily when they are aggregated as a composite index, the so-called Sustainable Energy Index, which consists of one sub-index for each dimension of sustainable development.
Other indicator frameworks address energy security instead of sustainable energy consumption. If energy security is defined broadly, there is a strong overlap with sustainable energy development. The broad notion of energy security has economic, social and ecological aspects, albeit often with a stronger focus on economic aspects. Relevant works in this context include [16,17,35–39]. With respect to climate change, several indicator systems are also available. These indicators or indices, however, follow a less comprehensive approach, addressing mainly environmental aspects. Examples include the National Climate Indicators System Report [40], the Climate Change Performance Index [41], and the Climate Change Cooperation Index [42].
The ClEP Approach
The IEA system of Sustainable Energy Development (SED) indicators [28] provides a broad range of indicators for all levels of the energy
Journal of Sustainability Research 12 of 42
system. This indicator set is the starting point for choosing relevant indicators in the demand-side sectors (residential buildings, mobility, manufacturing, services) as well as electricity and heat supply that could be applied to monitor progress in energy and climate policy at the EU or Member State levels. With respect to final energy demand, the focus is on indicators that relate to energy services because these determine welfare and economic development. The conceptual development of indicators was based on our extensive screening of available databases (e.g., Odyssee database, IEA database or Eurostat) regarding the availability of relevant indicators. Restrictions on data availability (many indicators are not available for all countries and years) co-determined the final set of indicators, i.e., we only included indicators for which at least some data for the EU Member States were available.
Data availability was acceptable for the economic and ecological dimensions but is particularly limited for the social dimension. Thus, additional information would be required to comprehensively track changes in energy use patterns and related social impacts. Gaps exist in the available data sets especially but not exclusively for the new EU Member States, where it is not possible to compile a longer time series.
Moreover, for our analysis, more refined data on the use categories of final energy demand would be useful as well as more detailed information on the efficiencies of appliances (e.g., disentangling the effect of usage time from technical efficiency), non-motorised transport, investment costs, levelized costs of generation, life cycle emissions and other environmental effects such as land use and water use.
Comprehensive and comparable data on energy poverty and mobility behaviour, as well as on the quality of employment at sectoral level, would also significantly improve the assessment of sustainable energy development.
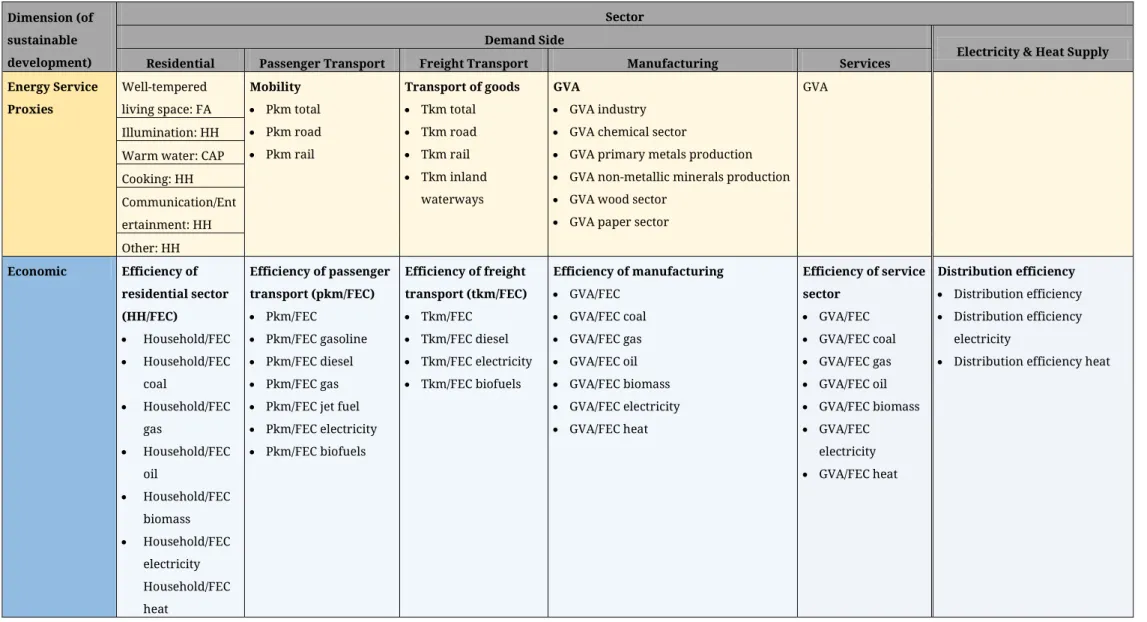
In identifying indicators for sustainable energy demand, all levels of the energy system must be considered, from energy services via final energy demand to primary energy supply. Given that data on energy services are not available, proxy indicators must be specified to capture energy service demand. These proxies include transport performance, i.e., passenger and tonne kilometres for mobility as a proxy for the energy service “access to people, goods and services at different distances”, the floor area of residential buildings as a proxy for “living space at a comfortable room temperature” or “lighting”, population for
“information, communication and other services related to consumer electronics” or “cooking” and gross value added as a proxy for energy services in the sectors manufacturing and services.
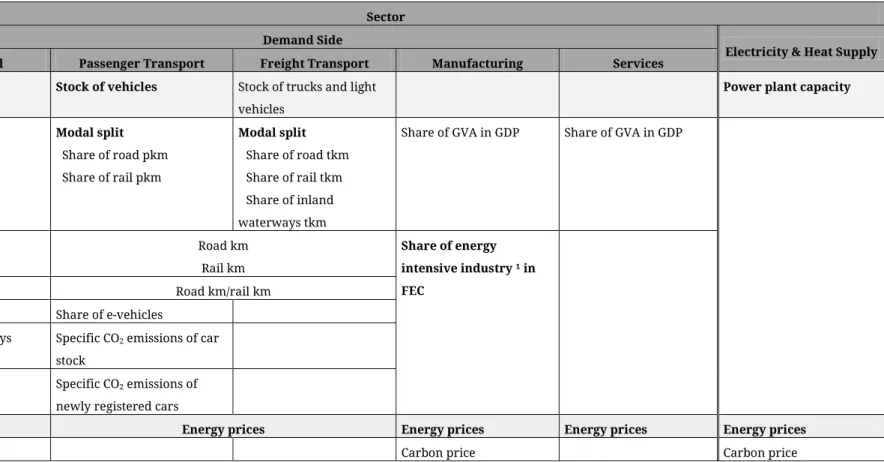
Table 2 shows the structure of the ClEP indicator framework (in Table A1 in the APPENDICES the disaggregated list of indicators is provided).
For each sector, the indicators are arranged in five modules comprising context indicators, energy service indicators and energy system indicators covering the three dimensions of sustainable development.
Journal of Sustainability Research 13 of 42
Context indicators include e.g., average household size, energy prices or heating degree days. For the demand-side sectors, indicators for the economic dimension include the efficiency of energy service provision (i.e., the energy service proxy divided by final energy consumption), energy costs, and patents related to energy efficiency. Economic indicators for electricity and heat supply capture transformation and distribution efficiencies, energy technology patents, and public energy R&D expenditures. The environmental dimension covers the share of renewable energy as well as CO2, NOx and SO2 emissions and intensities for all sectors. For the social dimension, we developed indicators for the following sectors: residential buildings, passenger transport, and electricity and heat supply. These indicators cover i.a. the affordability of energy-related appliances and comfortable room temperature, household equipment rates with certain appliances, differences in the shares of energy costs in household expenditure by income quintiles, or the share of electric and alternative vehicles in new registrations.
In contrast to the demand-side sectors, electricity and heat supply is only indirectly related to energy services. Final energy demand and energy supply technologies determine the energy input required to supply power and heat. Thus, emissions are a result of the transformation technologies used (plant types), the fuel mix and the level of final demand. The structure of energy indicators for this sector hence deviates from the demand-side sectors. The social indicators for energy supply include the gender pay and employment gap, wage issues, and work health aspects.
For the four demand-side sectors, a set of 109 aggregate energy indicators has been assembled. These indicators have been further disaggregated to 334 indicators (e.g., the energy efficiency of electricity and heat supply can be disaggregated by plant type, and household energy efficiency can be differentiated by use category). For electricity and heat supply, we compiled a set of 21 energy indicators providing an aggregate view of the sector. These indicators were further disaggregated to about 54 indicators, differentiated by energy source and plant type.
Journal of Sustainability Research 14 of 42
Table 2. List of indicators.
Dimension [of sustainable development]
Sector Demand Side
Electricity & Heat Supply
Residential Passenger Transport Freight Transport Manufacturing Services
Drivers/Context Housing stock Stock of vehicles Stock of trucks and light vehicles
Power plant capacity
FA per capita Modal split Share of road pkm Share of rail pkm
Modal split Share of road tkm Share of rail tkm Share of inland waterways tkm
Share of GVA in GDP Share of GVA in GDP
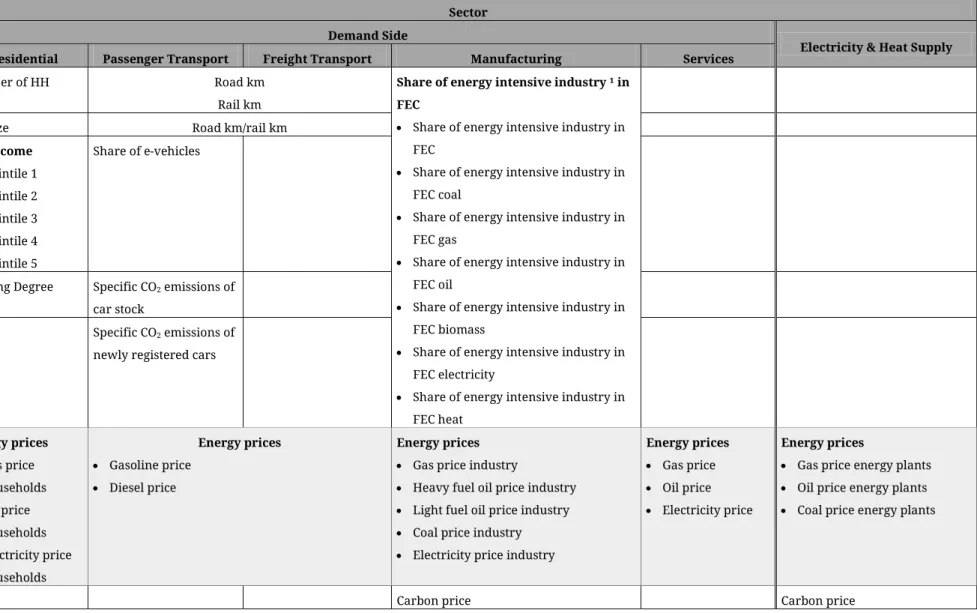
Number of HH Road km
Rail km
Share of energy intensive industry ¹ in
HH size Road km/rail km FEC
HH income Share of e-vehicles
Heating Degree Days Specific CO2 emissions of car stock
Specific CO2 emissions of newly registered cars
Energy price Energy prices Energy prices Energy prices Energy prices
Carbon price Carbon price
Journal of Sustainability Research 15 of 42
Table 2. Cont.
Dimension [of sustainable development]
Sector Demand Side
Electricity & Heat Supply
Residential Passenger Transport Freight Transport Manufacturing Services
Energy Service Proxies
Well-tempered living space: FA
Mobility: pkm Transport of goods: tkm GVA GVA
Illumination: HH Warm water: CAP Cooking: HH
Communication/Entertain ment: HH
Other: HH
Economic Efficiency of residential sector (HH/FEC)
Efficiency of passenger transport (pkm/FEC)
Efficiency of freight transport (tkm/FEC)
Efficiency of manufacturing
Efficiency of service sector
Distribution efficiency Transformation efficiency
FEC FEC FEC FEC FEC Transformation input
(TI)
Transformation output (TO)
Share of energy
expenditure in household expenditure
Share of transport expenditure in household expenditure
Share of costs Share of costs
Public R&D expenditures energy efficiency buildings
Public R&D expenditures transport Public R&D expenditures energy efficiency industry
Public energy R&D expenditures
Applied patents energy efficiency buildings
Applied patents energy efficiency transport Applied patents mitigation industry
Applied energy technology patents
Journal of Sustainability Research 16 of 42
Table 2. Cont.
Dimension [of sustainable development]
Sector Demand Side
Electricity & Heat Supply
Residential Passenger Transport Freight Transport Manufacturing Services
Ecological Share of RES Share of RES Share of RES Share of RES Share of RES Share of RES in TI
CO2 emissions CO2 emissions CO2 emissions CO2 emissions CO2 emissions CO2 emissions
NOx emissions NOx emissions NOx emissions NOx emissions NOx emissions NOx emissions
SO2 emissions SO2 emissions SO2 emissions SO2 emissions SO2 emissions SO2 emissions
CO2 efficiency of FEC CO2 efficiency of FEC CO2 efficiency of FEC CO2 efficiency of FEC CO2 efficiency of FEC CO2 efficiency of TI NOx efficiency of FEC NOx efficiency of FEC NOx efficiency of FEC NOx efficiency of FEC NOx efficiency of FEC NOx efficiency of TI SO2 efficiency of FEC SO2 efficiency of FEC SO2 efficiency of FEC SO2 efficiency of FEC SO2 efficiency of FEC SO2 efficiency of TI Social Persons who cannot
afford a telephone
New registrations of passenger cars
Low-wage earners
Persons who cannot afford a colour TV
New registrations of electric passenger cars
Median hourly earnings
Persons who cannot afford a computer
New registrations of passenger cars w alternative drives
Temporary contracts
Persons who cannot afford a washing machine
Level of difficulty to access public transport
Incidence rate of fatal accidents at work Persons who cannot
afford internet connection for personal use at home
Persons who cannot afford a car
Flexibility of the work schedule
Population unable to keep home adequately warm by poverty status
Gender pay gap
Journal of Sustainability Research 17 of 42
Table 2. Cont.
Dimension [of sustainable development]
Sector Demand Side
Electricity & Heat Supply
Residential Passenger Transport Freight Transport Manufacturing Services
Share of Heating costs in HH income
Gender employment gap
Equipment rate-fridge Equipment rate-freezer Equipment rate-washing machine
Equipment rate-dishwasher Equipment rate-TV
CAP—persons; E&H—electricity and heat; FA—floor area; FEC—final energy consumption, GDP—gross domestic product; GVA—gross value added; HH—households, pkm—person kilometres;
RES—renewable energy sources; R&D—Research and Development; TI—transformation input; TO—transformation output; tkm—tonne kilometres. Indicators in bold can be broken down into sub-indicators.
¹ Energy intensive industry here includes chemical sector, primary metals production, non-metallic minerals production, paper production, and wood production.
Journal of Sustainability Research 18 of 42
AVAILABLE DATA SOURCES FOR THE CLEP INDICATORS
In order to compile the indicators for the EU Member States, several databases need to be deployed. Data are available from the following databases:
• Odyssee database [43]: data on energy service proxies (floor area of dwellings, number of households, passenger and freight transport performance, gross value added of the manufacturing and service sectors), and the related efficiency data, information on the different capital stocks and equipment rates, sectoral shares of renewable energy sources and final energy consumption by energy source;
• The European Environment Agency’s database [44]: CO2 emissions of newly registered vehicles;
• IEA database [45–47]: transformation input and output by energy source, plant capacities, energy prices and sectoral public energy expenditure;
• UNFCCC National Inventories [1]: GHG emission data;
• Eurostat database [48–52]: household income and expenditures, social indicators (except for equipment rates);
• OECD database [53]: patent data;
• EEX [54]: data on carbon prices.
We aimed at identifying official data sources for the indicators that are available for all (or at least for the majority of) the EU Member States (like the Eurostat database, the OECD database, the EEA database or the UNFCCC National Inventories). Especially with respect to energy services and stocks, relevant data was not available from official statistical sources, so we relied on the Odyssee database in this regard. The latter provides information on final energy consumption by end-use category, the underlying drivers of energy demand, disaggregated energy efficiencies and CO2 related indicators; data are provided by national institutions (e.g., energy agencies or statistical organizations) from all EU countries as well as Norway, Switzerland and Serbia. Moreover, we suggest using information on energy prices and sectoral public energy expenditure from the IEA database due to better data availability as compared to the Eurostat database. The detailed list of data sources for the individual indicators can be found in Table A2 and Table A3 in the APPENDICES.
A GLANCE AT INTERACTIONS BETWEEN DIMENSIONS AND INDICATORS
Given the importance of accounting for interactions between SDGs and sub-targets, we highlighted the relationship between the energy service focused ClEP indicators and the broader context of the SDGs. For example, when integrating the social dimension into the climate and energy policy indicator set, the focus is on the quality of employment on the energy supply side, whereas the focus is on daily conduct of life
Journal of Sustainability Research 19 of 42
practices in private households on the energy demand side [55]. We identified cross-cutting issues that are relevant for all areas and at the same time highlight the relation to some other SDGs: gender equality [56,57] and gender equity [58]—both for energy supply and energy demand [59], improving the quality of employment (on the energy supply side) and respectively quality of life (on the energy demand side), as well as participation on the energy supply side or inclusion on the energy demand side. Reflecting the outcomes makes the multidimensionality and the ambivalences of the different dimensions visible, in particular as a consequence of the inclusion of the social dimension. For example, an increase in physical assets such as household appliances and vehicles may mean a reduction of social inequality and/ or an increase in mobility, but at the same time can have negative impacts on the environment—depending on the choice of technologies and/or fuels. This example reveals the multiple uncertainties associated with attempts to predict how particular future trends affect everyday life, consumption and mobility behaviors.
Table 3 exemplifies interactions between different indicators and goals. Trade-offs between different SDGs become visible. Depending on the underlying assumptions, different development paths are conceivable, with varying impacts on the environment as well as economic and social development.
Table 3. Interdependence table of social indicators and their impact on the SDGs.
Social Population able to keep home
adequately warm New registrations of passenger cars with electric or alternative drives GHG emission
reduction GHG emission
reduction
Social
Reduced number of low-wage
earners 2 2 −1 −2 1 1 −1 −1
Reduced gender employment gap 1 1 1/−1 −1 1 2 1/−1 1
The evaluation of interactions follows Nilsson et al. [5] and ranges from -3 to +3: −3 denotes cancelling targets while +3 denotes indivisible targets.
Table 3 shows that an increase in the number of low-wage earners implies a considerable change in material and immaterial deprivation.
This may entail, for instance, an increase in the proportion of the population unable to sufficiently heat their home or a lower number of newly registered electric cars and cars with alternative drive systems.
This would negatively impact the achievement of SDG 7 “Ensure access to affordable, reliable, sustainable and modern energy for all”. At the same time, this raises the question of whether the purchase of a more energy-efficient car would replace an existing conventional vehicle or if it would add an additional car to the household’s stock. The latter may
Journal of Sustainability Research 20 of 42
possibly mean an increase in mobility, in particular of women and young adults in the household, since they are often the users of the additional car, which in turn would have a negative effect from an environmental perspective and respectively SDG 13 “Take urgent action to combat climate change and its impacts”. By contrast, if increased mobility implies that women drive more, it would positively affect SDG 5 “Achieve gender equality and empower all women and girls” by increasing mobility options and the opportunities for participation in the labour force or other social activities. These different lines of argumentation illustrate that, depending on the assumptions made or the focus chosen, the effects would need to be judged differently.
These observations point to the comprehensive political and social challenges, both regionally and globally, of finding and deploying holistic and coherent measures that address the complex interactions between the SDGs in unison. It should be noted that all SDGs are “integrated and indivisible” and therefore should be considered equal [24]. Focusing on individual goals and ignoring others creates the risk of overlooking relevant side effects and failing to recognise and make use of potential synergies [2].
Added to this is the problem of data availability mentioned before. The lack of data can distort the picture, if indicators for relevant impacts and policy areas are missing.
CONCLUSIONS
The UN SDGs and the Paris Climate Agreement both imply ambitious (long-term) targets that can only be met with a fundamental restructuring of economic and social systems. In this context, monitoring of progress towards achievement of goals is essential and requires thorough measurement systems.
The complexity calls for indicator systems instead of single indicators.
Although the list of indicators proposed to monitor the 17 SDGs and the corresponding 169 targets is already very comprehensive, more detailed indicator sets for individual SDGs are required for the monitoring and steering of policy. Moreover, the General Assembly of the UN proposed complementing the UN indicator set with operational indicators at the national and regional levels to be developed by the countries and which would reflect their particular circumstances [24]. Against this background, we propose a set of indicators that allow monitoring of progress towards energy and climate policy targets at the EU and Member State levels.
We combine the energy service perspective with research on sustainable energy development indicators and apply this approach in the broader context of the SDGs. Furthermore, we put particular emphasis on the consideration of the social dimension and the development of respective indicators. The proposed sustainable energy indicators cover the three dimensions of sustainable development. As for
Journal of Sustainability Research 21 of 42
the SDGs, interactions (i.e., synergies and conflicts) between the different target dimensions and the corresponding indicators need to be carefully considered.
As shown in Kettner et al. [60], a composite index can be used to complement comprehensive indicator systems such as the one at hand.
Composite indices are a common method used to condense multifaceted information and to improve the communicability of results. In Kettner et al. [60], this approach was applied to assess the sustainable energy development in nine EU countries using a subset of indicators. One group of composite indices focussed on the dimension of sustainable development and the other on the sectoral disaggregation, providing concise information on trends in each country. Recently, composite indices that summarise global progress while considering possible conflicts and trade-offs between individual targets and indicators have been developed based on a Goal Programming Model [61,62] or a Multidimensional Synthesis of Indicators approach [63]. Applying these methods to our indicator set would presumably deliver valuable insights but would require better data availability.
Given the complexity of the issue and the gaps in data availability/adequate indicators, it is challenging to interpret certain observable trends. For instance, an increase in electric cars can have both beneficial and detrimental effects on the environment, depending on whether these cars are substitutes for fossil-fuel-powered cars or additional vehicles. By contrast, an increasing number of vehicles can enhance mobility and thereby be interpreted as an improvement in the social dimension of sustainable development. However, the net effect on mobility is again impossible to assess because no data on non-motorised transport are available and particularly due to the complex underlying interactions. This needs to be kept in mind when using the indicator system for policy analysis. The analysis highlights the importance of taking into account the multitude of interactions between different sustainable development targets. The comprehensive assessment helps prevent perverse outcomes and contributes to fully utilising the potential for achieving synergistic outcomes for other targets. Applying advanced statistical methods such as principal component analysis would shed light on correlations between the individual indicators. This would require, however, further advances in data and indicator availability for a larger number of EU Member States because many indicators currently are available only for a small number of countries and individual years.
Journal of Sustainability Research 22 of 42
AUTHOR CONTRIBUTIONS
All authors jointly designed the study and developed the indicator framework. All authors contributed to writing the paper.
CONFLICTS OF INTEREST
The authors declare that there is no conflict of interest.
FUNDING
This research was funded by the Climate and Energy Funds within the Austrian Climate Research Programme (ACRP).
ACKNOWLEDGMENTS
We would like to thank Katharina Köberl and Susanne Markytan for excellent research assistance.
Journal of Sustainability Research 23 of 42
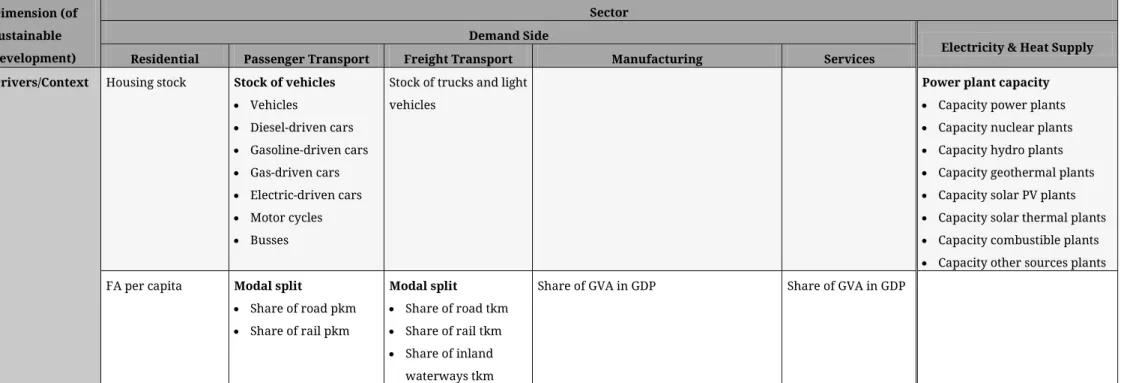
APPENDICES
Table A1. Detailed list of indicators.
Dimension (of sustainable development)
Sector Demand Side
Electricity & Heat Supply
Residential Passenger Transport Freight Transport Manufacturing Services
Drivers/Context Housing stock Stock of vehicles
• Vehicles
• Diesel-driven cars
• Gasoline-driven cars
• Gas-driven cars
• Electric-driven cars
• Motor cycles
• Busses
Stock of trucks and light vehicles
Power plant capacity
• Capacity power plants
• Capacity nuclear plants
• Capacity hydro plants
• Capacity geothermal plants
• Capacity solar PV plants
• Capacity solar thermal plants
• Capacity combustible plants
• Capacity other sources plants FA per capita Modal split
• Share of road pkm
• Share of rail pkm
Modal split
• Share of road tkm
• Share of rail tkm
• Share of inland waterways tkm
Share of GVA in GDP Share of GVA in GDP