Research Collection
Working Paper
A Safe Harbor: Wealth-Income Ratios in Switzerland over the 20th Century and the Role of Housing Prices
Author(s):
Baselgia, Enea; Martínez, Isabel Z.
Publication Date:
2020-12
Permanent Link:
https://doi.org/10.3929/ethz-b-000458727
Rights / License:
In Copyright - Non-Commercial Use Permitted
This page was generated automatically upon download from the ETH Zurich Research Collection. For more
information please consult the Terms of use.
KOF Working Papers, No. 487, December 2020
A Safe Harbor: Wealth-Income Ratios in Switzerland over the 20th Century and the Role of Housing Prices
Enea Baselgia and Isabel Z. Martínez
ETH Zurich
KOF Swiss Economic Institute LEE G 116
Leonhardstrasse 21
8092 Zurich, Switzerland
Phone +41 44 632 42 39
Fax +41 44 632 12 18
A Safe Harbor: Wealth-Income Ratios in Switzerland over the 20th Century and the Role of Housing Prices ∗
Enea Baselgia † Isabel Z. Martínez ‡ December 15, 2020
Abstract
We estimate the ratio of private wealth to national income, β
pt, for Switzerland over the period 1900–2018. Our results indicate that the development of β
ptin Switzerland did not follow a U-shaped pattern as in most European countries, but that the evolution was extraordinarily stable, with β
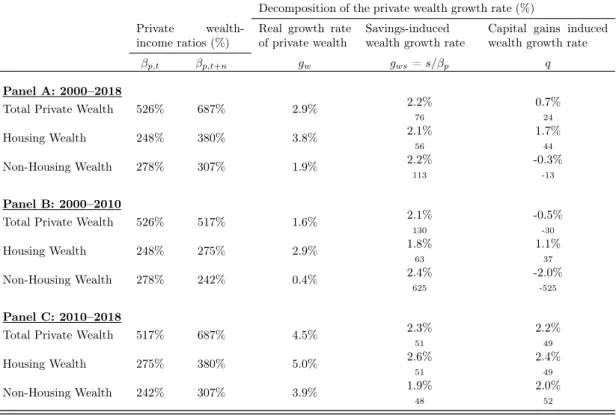
ptoscillating around 500% over most of the 20th century. How- ever, the wealth-income ratio has been on the rise since the turn of the century to reach 721% in 2017—an unprecedented level in the past. This considerable increase is mainly driven by large capital gains in housing wealth since 2010. We present new cross-country evidence that capital gains in housing wealth have become an important driver of rising wealth-income ratios in a series of developed economies.
JEL-Classification: N34, D31, D33, E01
Keywords: wealth-income ratio; income distribution; economic growth; housing prices
∗
We thank Luis Bauluz, Reto Föllmi, David Gallusser, Daniel Kaufmann, David Torun, and Christoph Schal- tegger for helpful comments. Both authors greatly appreciate financial support through SNSF Grant 176458 “The Influence of Taxation on Wealth and Income Inequality”.
†
University of St.Gallen, SIAW Institute, Bodanstrasse 8, CH–9000 St.Gallen, Switzerland. E-mail:
enea.baselgia@unisg.ch
‡
ETH Zurich, KOF Swiss Economic Institute, Leonhardstrasse 21, CH–8092 Zurich, Switzerland. E-mail:
martinez@kof.ethz.ch
1 Introduction
How important wealth is relative to income in an economy and how and why their rela- tionship changes over time are fundamental economic questions. Where data is available, recent decades have shown that wealth concentration is on the rise. If at the same time total wealth is gaining importance relative to income, wealth inequality (as well as inher- ited wealth) is likely to play a bigger role for the overall inequality of economic resources.
In their seminal contribution, Piketty and Zucman (2014) find that over the 20th century, wealth-income ratios have followed a U-shaped pattern in many industrialized economies, returning back to their high pre-WWI levels. This indeed suggest that wealth is becom- ing more important relative to income than it was in the post-war period, characterized by high growth and low inequality.
In this paper, we put together new historical wealth and income series to estimate wealth-income ratios for Switzerland, a case which is of great interest. It is a small country but major industrialized economy with a large financial sector and low taxes by international standards, which attracts rich taxpayers. Due to its long history in bank- ing secrecy, Switzerland also plays a major role in the tax sheltering of large fortunes (Zucman, 2013). In contrast to the countries studied in Piketty and Zucman (2014), Switzerland was only a bystander in the military conflicts that influenced the history and economic development of the Western world in the 20th century. And while other industrialized countries adopted anticapital policies after WWI, as Piketty and Zucman (2014) put it, Switzerland had significantly less tight financial market regulations than its neighbors. Particularly, Switzerland allowed imports as well as exports of capital—
which most European countries strongly limited in the post-war period. The open capital market was an important prerequisite for the development of Switzerland’s strong, in- ternationally competitive financial sector over the 20th century (Müller, 2012). Our new long-run series furthermore allow us to put recent developments in aggregate wealth into historical perspective.
We make three major contributions. First, we estimate long-run total private wealth
series at market value, extending back until 1900. Second, for the post-1990 period, we
decompose total national wealth measured at market value into different components. To
gain an understanding of recent dynamics, we provide detailed decomposition of wealth
accumulation into saving and real capital gains and losses. Finally, we study which role
price dynamics in housing wealth have played in the recent increase in wealth-income
ratios in Switzerland and other developed economies.
Piketty and Zucman (2014) stress that wealth stock data was largely missing until recently, as “national accounts were mostly about flows, not stocks.” Switzerland is no exception, and, on the contrary, to this day suffers from substantial data scarcity compared to most other Western economies. We draw on new private wealth estimates provided by the Swiss National Bank and Schmid (2013) as well as on total wealth reported in tax statistics since the beginning of the 20th century (some of which were already used by Dell et al., 2007). Using these new series our estimates of total private wealth are significantly higher than those of Brülhart et al. (2018). In light of our private wealth estimate, we revise the existing series of the Swiss wealth-income ratio.
Our results suggest that the evolution of the wealth-income ratio in Switzerland did not follow a U-shaped pattern like previously assumed, but rather that the evolution was extraordinarily stable over the 20th century. After the First World War, the wealth- income ratio in Switzerland oscillated around 500% until the eve of the Great Recession.
Since 2010, we are witnessing an unbroken, steep upward trend. By 2017, the wealth- income ratio had reached more than 700% for the fist time in its newer history since 1900.
Starting in the 1990s, the data allow us to study national wealth and its different components, namely public and private wealth, as well as different components of private wealth separately. While public wealth is only a small fraction of total wealth, we show that since 2005 it has been increasing as well. This finding stands in contrast to the experience of other countries. In terms of national income, public wealth almost tripled from 20% to just below 60%. Around 30% of the increase can be attributed to capital gains, the remaining 70% are the result of increased public saving. The latter is likely the result of “debt breaks” introduced at the federal and sub-federal state level (the Swiss cantons).
Decomposing private wealth into private pension wealth, net financial wealth, and housing wealth allows us to shed light on the role of housing wealth in Switzerland. Prior research by Martínez-Toledano (2020) as well as Piketty and Zucman (2014) has pointed out the importance of housing price bubbles for short- and medium-run fluctuations in wealth-income ratios. We find that the steep increase in the Swiss private wealth-income ratio observed since 2010 can by and large be attributed to rising housing prices.
To test the hypothesis that capital gains in housing or financial asset price increases
have been driving wealth-income ratios in recent decades, we turn to a multivariate
regression approach. In a panel regression framework including 12 countries and spanning
over 45 years, we find that indeed the correlation between real housing price increases and
private wealth-income ratios has become stronger in recent decades. Over the period from 1990 to 2018, a one percent annual increase in housing prices is associated with a 0.31%
increase in private wealth-income ratios. This overall result masks some heterogeneity between countries. The house price effect seems to be present in France, Italy, Spain, Norway, the United Kingdom, and the U.S., as well as in Japan and Australia (when including the 1970-1990 period) but we find no effect for Germany, Sweden, or Canada.
In Switzerland, the effect is weak and only present in the post-1990 period. Overall, the results support the hypothesis by Piketty and Zucman (2014) that asset price bubbles drive wealth-income ratios in the short- and medium-run. Steeply rising private wealth- income ratios can therefore be considered a warning signal and help designing appropriate financial and monetary policies. In turn this also implies that following the Harrod- Domar-Solow formula and abstracting from capital gains when determining the wealth- income ratio as β = s/g may be misleading in times of weaker financial regulations and potentially larger asset price bubbles. While we are not aware of any systematic research which answers the question whether asset price and housing bubbles have become more common, U.S. home price indices and the S&P 500 Shiller price-earnings ratio suggest that the size of bubbles has increased (in real terms) since 1980.
The remainder of the paper is organized as follows. Section 2 gives an overview of the literature. In Section 3 we introduce the key theoretical concepts which we aim to measure in the empirical part. Section 4 describes the data. We present our results in three steps. Section 5 presents our historical estimates of the evolution of private wealth- income ratios in Switzerland over the course of the 20th century. For the recent period 1990–2018, we decompose the national wealth-income ratio into different subcateogries.
These results are shown in Section 6. To identify potential drivers of the recent increase of the wealth-income ratio, in Section 7 we investigate the role of income growth and savings (Section 7.1), capital gains (Section 7.2), and housing wealth (Section 7.3). Section 8 concludes.
2 Related Literature
Wealth inequality and its evolution in the long run has recently gained large attention
by scholars. Due to limited data availability, studies have focused on computing top
wealth shares over the 20th century (see for example Dell et al.; Föllmi and Martínez,
2007; 2017 for Switzerland; Kopczuk and Saez; Saez and Zucman, 2004; 2016 for the
U.S.; Garbinti et al., 2020 for France). Given the much higher concentration of wealth
compared to income, focusing on the top of the distribution is justified when measuring wealth inequality.
The literature on national wealth and how it compares to national income in the long run is still very young. Its emergence is closely tied to data availability: it was only in 1993 when the System of National Accounts (SNA) first included guidelines to take stock of national wealth in a systematic and internationally comparable manner.
Not all countries have immediately adopted the guidelines and the scope of these wealth estimates varies considerably across countries: while some provide very complete and long series of national balance sheets, others only report partial results. This is in fact the case for Switzerland, as we shall see. In their seminal contribution, Piketty and Zucman (2014) were the first to make use of these new balance sheets as well as historical data from eight major developed economies 1 to study the evolution of the ratio of total aggregate wealth to national income. Waldenström (2017) compiled series going as far back as 1810 for Sweden, Artola Blanco et al. (2020) present series for Spain.
To put our results into perspective, we compare them to the evolution of the wealth- income ratios in these developed economies (and Norway, for which wealth-income ratios are available from the World Inequality Database). 2 In the meantime, all the countries covered in Piketty and Zucman’s (2014) original study have adapted their national ac- counts to the revised System of National Accounts 2008 (European Commission et al., 2009, SNA-2008). Bauluz (2019) updates Piketty and Zucman’s (2014) original series, and we use these updated series when we compare wealth-income ratios across countries.
Alvaredo et al. (2017) provide guidelines on the use of national balance sheets to compute wealth-income ratios as well as distributional national accounts, (another strand of the literature that has emerged in response to improved national accounts data). To ensure comparability, we follow these guidelines as closely as possible.
It is important to note, that we are not the very first to provide estimates of the aggregate wealth-income ratio in Switzerland. Brülhart et al. (2018) study inheritance flows in Switzerland for the period 1911–2011. Along with estimates of the ratio of bequests to national income (in analogy to Piketty, 2011, for France), the authors present estimates of private net wealth as a fraction of net national income. Their estimates show a strong increase in the private wealth-income ratio since the 1970s, similar to the one
1
Their study includes Australia, Canada, France, Germany, Italy, Japan, UK, and the U.S., Bauluz (2019) revises and updates their series.
2
We focus on wealth-income ratios in Switzerland and other developed economies. Other authors have con-
tributed series on emerging economies and young democracies, such as Piketty et al., 2019 for China, Novokmet,
2018 for the Czech Republic, Charalampidis, 2018 for Greece, Kumar, 2019 for India, Novokmet et al., 2018 for
Russia, or Orthofer, 2015 for South Africa.
observed in other European countries. Our own analysis differs significantly in several important aspects from theirs. First, we use market-value estimates of private wealth, rather than taxable wealth. Second, we combine new data sources to estimate aggregate private wealth at market value prior to 2000. This allows us to overcome the inherent undervaluation of certain assets, especially real estate, in taxable wealth. Third and in line with the guidelines established by Alvaredo et al. (2017), we include the total of private pension wealth. Since they are interested in measuring inheritance flows, Brülhart et al. (2018) exclude the non-bequeathable part of private pension wealth. Due to these differences in the measurement of aggregate net private wealth, we obtain a much more stable evolution of the private wealth-income ratio over the past century. For recent decades (1990–2018) we further decompose national wealth into public, private, and net foreign wealth, and study the evolution of private pension, housing, and financial wealth (see Section 6).
Our paper further relates to a growing literature focusing on the role of increasing house prices for wealth inequality and the observed rise in total private wealth. Already in their seminal paper, Piketty and Zucman (2014) have pointed out the importance of capital gains in the housing sector. Stressing the scarcity of housing, Rognlie (2015) also attributes major importance to the upward trend in house prices observed in many economies. Artola Blanco et al. (2020) provide a thorough review of the literature that studies house price phenomena. They find that the Spanish housing boom of the early 2000s led to an unprecedented rise in Spain’s wealth-income ratio. To our knowledge, however, our paper is the first addressing the role of housing prices for wealth income ratios directly measuring their relationship in a cross-country panel regression framework.
3 Definition of Wealth and Income Components
Building on the work of Piketty and Zucman (2014), Alvaredo et al. (2017) have developed a unified framework (the “DINA Guidelines”) to compute national wealth and income se- ries based on the internationally used 2008 System of National Accounts (SNA-2008) (European Commission et al., 2009). To ensure comparability, we follow this frame- work as close as possible, depending on the availability of the corresponding data for Switzerland.
Private wealth is denoted by W
ptand consists of net wealth (assets minus liabilities) of private households. 3 It can be decomposed as follows:
3
Nonprofit institutions serving households (NPISHs) are included in the household sector, since the frontier
between individuals and private foundations is not always clear. In the Swiss national account system, NPISHs
W
pt= K
pt+ F
pt− L
pt, (1) where K
ptare non-financial assets, F
ptare financial assets, and L
ptare financial lia- bilities of private households. Financial assets include bank accounts, stocks and bonds, as well as life insurances and funded pension wealth. In contrast, pay-as-you-go social se- curity pension wealth (called “Old Age and Survivors Insurance” (OASI)) and any other claims on future government expenditures are excluded, as well as durable goods. We follow Piketty and Zucman (2014) to ensure comparability. The exclusion of claims on future government expenditures is justified by the fact that these household assets count as liabilities for the government sector and would therefore cancel out when looking at national wealth—the more meaningful concept (see Piketty and Zucman, 2014, for a discussion).
In the literature, non-financial assets K
ptare usually decomposed further into:
K
pt= H
pt+ A
pt+ D
pt(2) Housing assets H
ptare defined as the sum of the market value of dwellings and land underlying dwellings. A
ptdenotes the value of agricultural land, and D
ptstands for other domestic capital, i.e., all non-financial assets except housing and agricultural land, such as unincorporated business assets.
Public (or government) wealth, W
gt, is defined as net wealth of public administrations and government agencies. Analogous to Equation (1), public wealth can be decomposed into public non-financial and financial assets, K
gtand F
gt, respectively, and financial liabilities of the public sector, L
gt.
The market-value of national wealth W
ntis the sum of private and public wealth.
National wealth can be split up into market-value domestic capital, K
nt, and net foreign wealth, N F A
nt:
W
nt= W
pt+ W
gt= K
nt+ N F A
nt(3) We use income net of depreciation, i.e., gross national income minus consumption of fixed capital, as recommended by Alvaredo et al. (2017). In line with the production approach, net national income, Y
t, is defined as the sum of net domestic output Y
dt(GDP minus consumption of fixed capital) plus net foreign income, r
tN F A
t: 4
and private households are reported together as one single category. Net wealth of NPISHs is usually small (e.g., in France about 1% of total net private wealth in 2010 (Piketty and Zucman, 2014)).
4
In the results section, we use the term national income which always refers to net national income.
Y
t= Y
dt+ r
tN F A
t(4) The private wealth-income ratio, β
pt, is defined as:
β
pt= W
ptY
t(5)
Analogously, β
ntdenotes the national wealth-income ratio:
β
nt= W
ntY
t(6) In a closed economy, β
ntequals the domestic wealth-output ratio β
kt=
YKtdt
. Moreover, if public wealth is zero, it holds that: β
pt= β
nt= β
kt.
Next, we turn to the accumulation of wealth. Between time t and t + 1 the accumulation of national wealth W
ntcan be split into a volume effect and a relative price effect:
W
nt+1= W
nt+ S
t+ KG
t, (7) where S
tis the net-of-depreciation national saving flow (volume effect), and KG
tare capital gains or losses (relative price effect). In the long run, where relative price effects balance out, at least theoretically, such that KG
t= 0, the steady-state national wealth income ratio is given by the Harrod-Domar-Solow formula:
β
nt−→ β
n= s
g (8)
where s is a fixed long-run saving rate, and g is a fixed growth rate of national income.
That β
ntconverges to β
nin the steady state relies on the assumption that there is no change in the relative price of assets and consumption goods over time. 5 Although this may be a plausible assumption in the long run, in the short and medium run, relative price effects, i.e., capital gains, turn out to be crucial. We thus decompose the evolution of national wealth-income ratios into two multiplicative components—the volume and the relative price effect—as follows:
β
nt+1= (1 + g
wst)(1 + q
t) 1 + g
tβ
nt, (9)
where 1+g
stwis the savings-induced wealth growth rate, 1+q
tthe capital gains induced wealth growth rate and 1 + g
tthe growth rate of national income. The savings-induced
5
For a critical discussion concerning the use of the Harrod-Domar-Solow formula see Krusell and Smith Jr
(2015).
wealth growth rate, 1 + g
stw, equals 1 +
βstnt
. The rate of capital gain or loss can then be estimated as a residual.
For an open economy, the share of capital income in national income is defined as:
α
t= r
ptW
ptY
t= r
ptβ
pt, (10) where r
ptis the average return on private wealth.
4 Data
We combine various data sources for our empirical analysis of the wealth-income ra- tio. To ensure comparability with other countries, we follow the approach and methods developed by Piketty and Zucman (2014) and established by Alvaredo et al. (2017) as closely as possible. Switzerland’s national accounts are based on the European System of National Accounts 2010 (European Union, 2013, ESA-2010), which is compatible with the SNA-2008, but Switzerland’s national accounts are considerably less detailed than those of larger European countries. We pay particular attention to the construction of a consistent, long-run estimate of total private wealth, starting in 1900. Other wealth ag- gregates, such as national wealth or public wealth, are only available from official sources for more recent decades, starting in 1990. For a detailed description of the data and list of all sources, we refer to Appendix A.
Private Wealth (W
pt). To compute long series of private wealth, we have to distinguish between three sub-periods, each of which is determined by differing limitations to data availability. To obtain a long run series of total private wealth at market value, we combine the estimates from the three sub-periods.
For the period 2000–2018, the Swiss National Bank (SNB) provides reliable data on aggregate private net wealth W
ptat market values as part of the financial accounts of Switzerland, which can be broken down into financial assets F
pt, financial liabilities L
ptand non-financial assets K
pt. The stock gross financial wealth, F
pt, consist of currency
and transferable deposits, debt securities (short-term, long-term and structured prod-
ucts), shares and other equity, units in collective investment schemes as well as insurance
and pension schemes. L
ptis composed of loans, mortgages, and other outstanding liabil-
ities. For non-financial assets, K
pt, the SNB only reports estimates on housing wealth,
H
pt. To the best of our knowledge no estimates on the value of agricultural land and A
ptand other domestic capital D
ptexist for Switzerland. Therefore, in our analysis private
non-financial assets consist only of housing wealth, such that (K
pt= H
pt), which implies that A
pt= D
pt= 0. 6 Note that by housing wealth H
ptwe refer to the market value of real estate held by private households.
No official statistics on net private wealth exist for Switzerland prior to 2000. For the period 1981–1999 we rely on the estimates of private net wealth at market value by Schmid (2013). These estimates are based on internal SNB data and were the precursors of the official statistics published later by the SNB. As Figure B1 shows, these series are virtually identical to the official statistics published by the SNB in the overlapping period 2000–2010. 7
Prior to 1981, data on market value W
ptis nonexistent and we have to take an alternative approach. Following Föllmi and Martínez (2017), we combine total wealth estimates based on tax data published in Dell et al. (2007), with historical estimates of total pension fund assets published in Leimgruber (2008). Combining wealth tax and pension data is important, because pension wealth is not taxed and is therefore missing in tax statistics. Next, we calculate the annual growth rate of this combined series and apply the growth rate to the earliest market value observation of private wealth from Schmid (2013) in 1981. This approach allows us to extrapolate the market value wealth backwards using observed changes in taxable and pension wealth (see Appendix A.1 for details). Under the assumption that the latter correspond well to changes in total private wealth, this approach should result in a consistent estimate of private wealth at market value. Figure B4 shows the annual percentage change in private wealth at market value and taxable plus private pension wealth, respectively, for the period 2003–
2016, where annual data for both series exist. Growth rates track each other extremely well—including the years around the outbreak of the Great Recession in 2008, which are characterized by large changes from year to year. We are therefore confident that our method is valid to estimate total private wealth at market value over time.
Our approach to measure total private wealth pre-1981 obviously deviates from the methodology proposed by Piketty and Zucman (2014) and established in Alvaredo et al.
(2017), which is based strictly on national accounts data. Note, however, that we refrain from the perpetual inventory method, which cumulates past investment flows. As dis- cussed in (Piketty and Zucman, 2014, p.1265), this method falls short of appropriately measuring the capital stock for several reasons. Our approach, in contrast, is based on
6
All three components (H
pt,
Apt,
Dpt) of
Kptare available on WID.world for the countries we compare our results to. In Appendix B.2 we describe how we adjusted the international data in order to compare them with the results for Switzerland.
7
At the time, the author had access to internal data at SNB. We are very grateful to him for sharing this
data with us.
changes in actual measures of total private wealth, which, however, do not capture the full capital stock in the economy at market value.
To the best of our knowledge, for Switzerland no other long-run time series of private wealth exist. Since the 1930s, national income rather than wealth has increasingly served as the main indicator for (economic) well-being (Landolt, 2014). At the beginning of the 20th century, however, several attempts were made to record Switzerland’s national wealth. Estimates for the early 1910s varied considerably between 30 and 40 billion Swiss francs (in nominal terms). Geering and Hotz (1914) estimated the value of Swiss national wealth around 1914 8 at 30 billion Swiss francs. Later valuations resulted in somewhat higher estimates, such as Landmann (1916), who estimated Swiss national wealth for the year 1913 at 34.6 billion Swiss francs and Fahrländer (1919), also for the year 1913, at 41.96 billion Swiss francs (all estimates in nominal terms). Some of these estimates also include certain assets that are excluded from our definition of wealth, in particular durable goods. For instance, the estimate of Landmann (1916) includes fire insured movable property worth 9.9 billion Swiss francs. Without these movable assets, national wealth would fall considerably to around 24.7 billion Swiss francs. This is very close to our own estimate of private wealth for 1913 of around 26 billion nominal Swiss francs. By comparison Brülhart et al. (2018) estimate private net wealth in 1911 at around 18 billion Swiss francs, which seems rather low.
Public Wealth (W
gt). All analyzed data on public wealth W
gtfor Switzerland between 1990 and 2018 can be taken from the “Government Finance Statistics Model” (GFS Model) of the Federal Finance Administration, which follows the International Monetary Fund (IMF) financial statistical standard that ensures international comparability. Note that no data on public wealth exists prior to 1990.
National Wealth (W
nt). Equation (3) shows that national wealth is the sum of W
ptand W
gt, therefore no additional data is required to obtain W
nt. Note that no data on national wealth exists prior to 1990, since no data on public wealth is available prior to 1990.
Net Foreign Wealth (N F A
nt). W
ntcan further be split into domestic capital K
ntand net foreign assets N F A
nt. For the period 2000–2018 net foreign wealth is provided by the SNB as part of the Swiss balance of payments. For the years 1995–1999 we obtain net foreign wealth from published reports of the SNB.
8
Geering and Hotz (1914) do not give a particular date for their estimate. The data used also come from
different years. The authors state, however, that national wealth may be estimated at 30 billion “today”.
Net National Income (Y
t). Similar as with private wealth, we have to rely on three different sources to obtain long run series of national income covering the entire 20th century as no uniform series exists for Switzerland. For the period 1995–2018, we use national income data as published by the Federal Statistical Office (FSO) in the Swiss National Accounts, which are fully compatible with the SNA-08 framework. Between 1929 and 1994, we use historical national income time series provided by the Historical Statistics of Switzerland (HSSO) database. Unfortunately, income concepts vary slightly between these sources. We therefore use growth rates to extrapolate income backwards from 1995 (see Appendix A.4 for details). For the years prior to 1929, finally, we have to fall back on growth rates of historical GDP estimates (rather than NNI) by Stohr (2016).
Additional Macroeconomic Data. Occasionally, we present results not as wealth- income ratios, but as aggregated real or as per capita real variables, for which we ad- ditionally use population (see Appendix A.5) and price data (see Appendix A.6). In order to split changes in total wealth into a savings and a capital gains/loss component (see Equations (7) and (9)), we use supplementary data on savings (see Appendix A.7).
Detailed methodological explanations of this decomposition can be found in Appendix A.9. Where meaningful, we compare our results for Switzerland internationally. The international wealth data presented in our analysis can be directly obtained from the World Inequality Database (WID.world; see Appendix A.8). To analyze how stock and housing prices affected changes in the wealth-income ratio, we use real house price in- dex data (see Appendix A.10) and stock market index data (see Appendix A.11), both obtained from the OECD.
5 Switzerland’s Private Wealth-Income Ratio, 1900–2018
In this section we present our estimates of the evolution of Switzerland’s private wealth-
income ratio over the 20th century. First, we describe how we compute our estimates
of private wealth-income ratios for Switzerland and why they differ significantly from
the previous estimates by Brülhart et al. (2018). Next, we explain the extraordinary
trajectory of β
ptin Switzerland over the 20th century and how it compares to other
countries.
5.1 Comparison with Prior Estimates
We compute the private wealth-income ratio β
ptfor Switzerland for the entire period 1900–2018 by dividing total estimated private wealth by total income, using the data described in Section 4. In principle, we would prefer to study the development of the national wealth-income ratio, since this concept more adequately reflects the importance of total wealth in a country (Piketty and Zucman, 2014). Due to the data limitations described above, in the Swiss case this is unfortunately not possible for long-run esti- mates. We turn to the evolution of national and public wealth—the main limiting factor for a long-run analysis of national wealth, as no estimates are available for the pre-1990 period—in recent decades in Section 6. As it will turn out, at least since the 1990s, public wealth has played a minor role in Switzerland, such that focusing on the evolution of private wealth seems justified. Given the experience in other countries, we can of course not rule out that public wealth was larger in the past in Switzerland, too. However, results in Piketty and Zucman (2014) show that in rich countries, net public wealth was always small compared to private wealth. They find that the fall in government wealth was much smaller than the rise of private wealth.
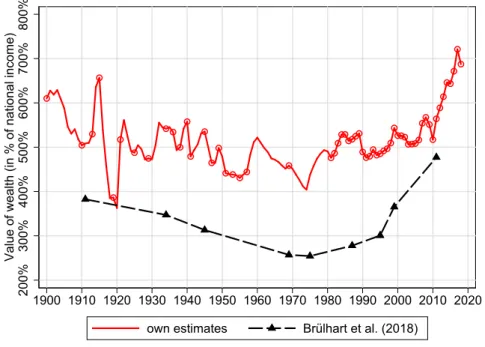
The solid red line in Figure 1 shows our estimates of Switzerland’s private net wealth in terms of national income since 1900. The hollow dots indicate the years for which total wealth data is available, either in the form of tax statistics and pension statistics (1900–1981), private net wealth estimates at market value by Schmid (2013) (1981–1999), or aggregate wealth estimates published by the SNB (2000–2018). Prior to 1981, where data is not available on an annual basis, we linearly interpolate the total wealth series for the missing years in between. We obtain our measure of interest, β
pt, by dividing these annual wealth series by national income. This explains why our series fluctuates even in years where no aggregate wealth data exist.
For comparison, the dashed black line in Figure 1 shows private wealth-income ratios presented in Brülhart et al. (2018). Again hollow dots indicate years for which they observe total aggregate wealth from tax statistics. While both series show a steep increase in the private wealth-income ratio since the mid-1990, the estimates from Brülhart et al.
(2018) indicate a lower overall level of β
pt, and they lead to a more pronounced U-shape in the long run trend.
Since both approaches use very similar national income series, the principal source
of divergence is due to different estimates of total private wealth. Figure B1 shows the
wealth estimate of Brülhart et al. (2018) for the period 1981-2018 along with the data on
which our wealth estimates are based. Two main reasons explain the significant difference
between the two estimates of the private wealth-income ratio.
First, we use data on private net wealth at market prices, while Brülhart et al. (2018) estimate net private wealth on the basis of tax data. The authors emphasize that net private wealth estimates based on wealth tax statistics will be downward biased, because i) tax valuations of housing wealth are below market value, and ii) because compulsory private pension-fund wealth is exempt from taxes and hence not covered in tax data.
Although they attempt to correct for the undervaluation of tax data, their estimate of total private wealth remains below official estimates published by the SNB. According to Brülhart et al. (2018), real estate is valued at approximately 70% of market value.
To account for this undervaluation of real estate wealth, they add a 30% mark-up to all their tax-based wealth series. While prior to 1981 we have to rely on tax data to estimate total wealth, too, we use a different approach to Brülhart et al. (2018): rather than using the level of total wealth observed the tax data, we use changes in combined historical tax and pension wealth data to extrapolate backwards the level of total private wealth from 1981, the first year for which private wealth at market value is available (see Appendix A.1 for details).
The second reason lies in the focus of the two papers and how, therefore, tax-free pension wealth is taken into account. Both approaches complement the tax series with historical pension assets data found in Leimgruber (2008). However, since Brülhart et al.
(2018) are interested in inheritances, they correct their tax wealth series only for the part of pension assets that is drawn as a lump sum on retirement and is therefore bequeathable.
They assume that an estimated 70–80% of total pension wealth will be drawn as ordinary annuities while the rest of the pension wealth is drawn as lump-sum payouts. Hence, they only add 20–30% of total pension assets to their tax-based wealth series. This is certainly justified if one is interested in inheritable wealth, but the approach misses part of total private net wealth—the measure we are interested in in the paper at hand. Since undisbursed pension assets are an integral part of the assets of Swiss households built up through mandatory savings, they should be fully included in the sum of net private wealth.
Due to the exclusion of a major part of the pension fund assets and in comparison
with historical wealth estimates discussed in Section 4, we consider the private wealth
series presented by Brülhart et al. (2018) to be somewhat too low. In particular, their
very dramatic increase in the private wealth-income ratio between 1980 and 2010 appears
hardly plausible when comparing it with the estimates of Schmid (2013). In addition, our
finding of a very stable long-run evolution of the private wealth-income ratio supports
earlier results by Föllmi and Martínez (2017) on the relatively stable development of wealth and income inequality in Switzerland over the course of the 20th century. Finally note that we use wealth tax statistics for more years than Brülhart et al. (2018) and that we allow β
ptto fluctuate not only with wealth but also with income.
200% 300% 400% 500% 600% 700% 800% Value of wealth (in % of national income)
1900 1910 1920 1930 1940 1950 1960 1970 1980 1990 2000 2010 2020 own estimates Brülhart et al. (2018)
Figure 1: Different Private Wealth Estimates for Switzerland, 1900–2018
Note: This figure shows our estimate of the private wealth-income ratioβpt
for Switzerland in comparison with the estimates submitted by Brülhart et al. (2018), which are based on federal wealth tax statistics. Note that the marked points show observations for which we do have data on private wealth. For the years in between, we have interpolated our wealth series linearly. Thus, the total fluctuation between the marked years results exclusively from the change in national income. The data sources for our new historic private wealth estimates of Switzerland are described in appendix A.1. The observations of Brülhart et al. (2018) are linearly interpolated.
5.2 Long-Run Evolution in International Comparison
In this section, we compare the evolution in Switzerland to that of all other countries for which long-run estimates exist, namely Germany, France, the United Kingdom, the United States (Piketty and Zucman, 2014), Sweden (Waldenström, 2017), and Spain (Artola Blanco et al., 2020). Figure 2 shows that our results in terms of the general level of β
ptare well in line with those of other countries.
At the onset of the 20th century, Switzerland’s wealth-income ratio was at a relatively high level of roughly six times national income. This level was similar to that observed in other countries at that time—roughly in-between Old Europe (Germany, France, United Kingdom) and Spain and the United States (Figure 2).
The observed decline in β
ptin Switzerland between 1900 and 1910 was due to increases
in real income: between 1900 and 1910, real per capita net national income grew by 21%, while real wealth per capita stagnated (see Fig. B2). The very large swings between 1913 and 1922 were caused by the shock of the First World War (1914–1918). Switzerland experienced a steep rise in price levels and real income fell sharply during the war. At the same time, total private wealth declined too, such that β
ptfell from 654% in 1915 to 383% in 1918. As a result of the subsequent recovery of private wealth after the war and the stagnation of real national income between 1918 and 1922, β
ptrecovered to a large degree. The few observations of this tumultuous time should be interpreted with care, as data quality is likely limited. Note however, that other countries shown in Figure 2, in particular Sweden and the U.K., experienced similar dynamics during this period leading up to the Great Depression.
In stark contrast to other countries, the wealth-income ratio in Switzerland reached pre-war levels in the 1920s. By that time, France, Germany, or Sweden had already experienced a large decline in their private wealth-income ratio, reaching historically low levels. The shocks of WWI (as well as later in WWII) led to a massive decline of private wealth in Old Europe. Importantly, this was mainly caused by real capital losses and only partly by war destruction (Piketty and Zucman, 2014).
After overcoming the post-World War I recession of the early 1920s, Switzerland recorded above-average growth in national income from 1922 until the onset of the Great Depression (Woitek et al., 2012), leading to a slight decline in β
pt. Between 1929 and 1939, Switzerland lived through a decade of declining per capita income (Woitek et al., 2012), and β
ptrose back to 550%. While in other countries such as the U.K. or Sweden, but also in France and Germany, we observe similar movements in β
ptover this time, the magnitude of the changes is much smaller in Switzerland. As a result, β
ptremains relatively stable in Switzerland.
Compared to the First World War, World War II hardly seems to have left its mark on the private wealth-income ratio in Switzerland. We observe sharp declines in the U.S., France, the U.K., and—to a smaller degree—Germany, but the decline in Switzerland is moderate and unsteady. Real income and real wealth remained more or less constant over the period 1939–1945.
After the end of WWII, Switzerland recorded unprecedented, high growth rates. Real national income grew by an average of 5.3% per year until 1970 (Figure B2), contributing to a decline in β
pt. From the 1970s onward, however, real income growth fell to 1.8%
(average of the 1970–1995 period) and was therefore particularly low—also relative to
other countries. The low average income growth rate can be explained by the slump in
economic growth in the 1970s and the deep recession and stagnation phase of the 1990s (Woitek et al., 2012). As a result, β
ptreturned to its 20th century average of 500%.
In contrast, wealth-income ratios rose steadily over the second half of the past century in Germany, the United Kingdom, France, and—although to a lesser extent—also in the United States. Piketty and Zucman (2014) attribute this increase to a long-term recovery in asset prices. They argue that the long-run swing in relative asset prices was itself driven by changes in capital policies. In their view, anticapital policies depressed asset prices in the post war period. When these policies were gradually lifted from the 1980s onward, asset prices started recovering to eventually reach pre-war levels.
We are not aware of any systematic research which answers the question whether over the long run covering the entire 20th century, asset price and housing bubbles have become more common or more pronounced. But the Case-Shiller home price index for the U.S. as well as the Shiller price-earnings ratio (i.e., the cyclically adjusted price-to- earnings ratio, short: CAPE) suggest that the magnitude of large bubbles which were of macroeconomic importance has increased over time. These findings are in line with the fact that some of the largest bubbles in economic history built up post-1980, including Japan’s real estate and stock market bubble of the 1980s, which burst in 1991; the “Dot- com Bubble”, which peaked in 2000; and the U.S. housing bubble bursting in 2009. For Switzerland, we know that in the 1980s a real estate bubble was building up to burst in 1990 (see Fig. B15.a), which shows real annual changes in housing prices). This explains the sharp drop in β
ptbetween 1989 and 1991.
After the turn of the millennium, we observe a steep increase in β
ptin several countries, including Switzerland. Within less than 20 years, the Swiss wealth-income ratio rose from 500% to 700%. Also Sweden, France, the United Kingdom, and Spain have been experiencing rapid increases in their wealth-income ratios. Artola Blanco et al. (2020) find that, at least for Spain, the increase was mainly caused by a large housing bubble which burst in the Great Recession. We come back to the role of capital gains in housing wealth in Switzerland and other countries in Sections 6 and 7.
The long run-evolution of the private wealth-income ratio in Switzerland can be sum- marized as follows. Over the past century, a series of economic shocks and major historical events have inevitably contributed to considerable fluctuations in β
pt, also in Switzerland.
However, Figure 2 clearly shows that throughout the 20th century in no other country private wealth-income ratios were as stable as they were in Switzerland. β
ptoscillated around 500% until the eve of the Great Recession, averaging 490% over the period 1920–
2005. This finding of a very stable long-run evolution of the private wealth-income ratio
supports earlier results of Föllmi and Martínez (2017) on the stable level of top wealth shares in Switzerland over the course of the 20th century.
Results by Piketty and Zucman (2014) show that recent wealth-income ratios in Old
Europe (particularly in France and the United Kingdom) have almost returned to their
high levels of the early 20th century. They rightly conclude that in Europe, β
pthas
followed a pronounced U-shaped pattern over the 20th century. Our conclusion is that
the evolution in Switzerland is better described by a J-shaped pattern: a stable evolution
over the 20th century, followed by a very steep increase in the private wealth-income ratio
in recent years, which in turn resulted in a level of β
ptunprecedented in the entire 20th
century. Switzerland therefore resembles the evolution in Spain, where the marked rise
in β
pthas been driven by real-estate bubbles (Artola Blanco et al., 2020).
200% 300% 400% 500% 600% 700% Value of wealth (in % of national income)
1900 1910 1920 1930 1940 1950 1960 1970 1980 1990 2000 2010 2020 Switzerland Germany
France United Kingdom
(a) Switzerland, Germany, France and the United Kingdom
200% 300% 400% 500% 600% 700% Value of wealth (in % of national income)
1900 1910 1920 1930 1940 1950 1960 1970 1980 1990 2000 2010 2020 Switzerland Spain
Sweden United States
(b) Switzerland, Spain, Sweden and the United States
Figure 2: Private Wealth-Income Ratio in International Comparison, 1900-2018
Note: This figure shows the historical evolution of the private wealth-income ratioβpt
for the countries indicated
from 1900 to 2018.
βptindicates how many years it would take to accumulate total private wealth if none of na-
tional income would be spent on consumption. Note that the marked points for Switzerland indicate observations
for which we have wealth-data. The years in between are linearly interpolated. The data sources for Switzerland
are described in detail in appendix A.1. The series for Germany, France, the United Kingdom and the United
States are based on Piketty and Zucman (2014), from Artola Blanco et al. (2020) for Spain and from Waldenström
(2017) for Sweden. All these have been updated and are available for download from
https://wid.world.6 Wealth-Income Ratios – Recent Evolution
For the time from 1990 onward, detailed data on the different components of national wealth allows us to study the evolution of these components—namely private, public, and net foreign wealth—in turn.
6.1 National Wealth
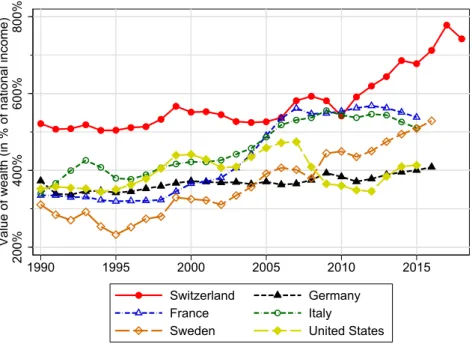
Figure 3 shows the national wealth-income ratios for Switzerland, Germany, France, Italy, Sweden, and the United States over the period 1990–2018. Switzerland stands out with the highest wealth-income ratio among these economies. We can further distinguish two periods in Switzerland: the years 1990–2006, where the total wealth-income ratio was remarkably stable, ranging around 500 to 550% of annual national income, and the period since 2006 where we observe an increase from 540 to 740%.
This period of rising importance of wealth in comparison to income started during the economic expansion prior to the Great Recession. In contrast to other European countries, the Great Recession and the following European debt crisis only led to a very brief contraction in Switzerland’s wealth-income ratio between 2008 and 2010. This dip in 2010 was the combined result of i) a drop in wealth per capita (see Fig. B3); and ii) an increase in national income per capita of 15% between 2008 and 2010 after the 11% fall between 2006 and 2008 as a result of the Great Recession (see Fig. B2). In other countries, there is hardly any change visible around the 2007–2011 period, with the exception of the U.S. In the U.S., the Great Recession led to a strong drop in the national wealth-income ratio and stabilized after 2009 at around 380–400% of national income—substantially below the 2007 level of almost 500%.
Switzerland’s steady growth in the national wealth-income ratio since 2010 stands in
strong contrast to other countries’ experience. Only in Sweden do we observe an upward
trend throughout the period 1995–2018. At 740%, however, the wealth-income ratio in
Switzerland is around two years of national income higher than in Sweden. Most other
countries saw their wealth income ratio stagnate or fall after the Great Recession.
200% 400% 600% 800% Value of wealth (in % of national income)
1990 1995 2000 2005 2010 2015
Switzerland Germany
France Italy
Sweden United States
Figure 3: National Wealth-Income Ratios in International Comparison, 1990–2018
Note: This figure shows the evolution of the national wealth-income ratioβnt
for several countries from 1990 to 2018.
βntis derived by dividing the sum of net private wealth,
Wpt, and net public wealth,
Wgt, by net national income,
Yt. Both, private and public wealth, are the sum of financial and non-financial assets minus financial liabilities. In order to present series which are harmonized across countries and over time, non-financial assets of private households,
Kpt, only include of housing wealth (i.e.,
Kpt=Hpt). The data sources for Switzerland are described in detail in appendix A.1 and A.2. The series for Germany, France, Italy and the United States are based on Piketty and Zucman (2014), and from Waldenström (2017) for Sweden. All these have been updated and are available for download from
https://wid.world.6.2 Public Wealth
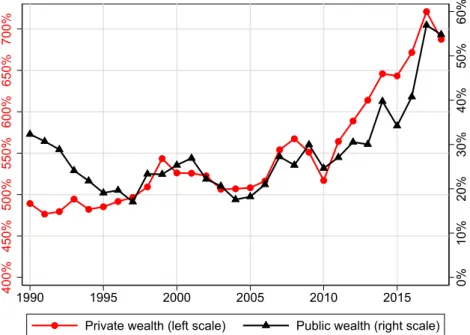
The share of public wealth in total national wealth is relatively low, ranging between 3 to 7% in the period 1990–2018. As a consequence, the value of public wealth measured in national income is low. As Figure 4 shows, it would take around half a year’s national income to buy all the government owned assets—compared to the 7 annual national incomes needed to match private wealth. Even though estimates of public wealth at market value are likely less precise than those for private wealth (since the market value of assets such as schools, hospitals or highways cannot be measured directly; see Piketty, 2014, for a discussion) and assuming a relatively large margin of error, it is apparent that national wealth consists largely of private wealth.
Interestingly, the increasing wealth-income ratio can be observed in both, public and
private wealth-income ratios. Over the entire observable period Switzerland’s public
wealth-income ratio rose from 32% in 1990 to 55% in 2018. For both series, the increase
has become very steep since 2010.
This upward trend in public wealth stands in clear contrast to most other countries’
experiences (shown in Figure B7), as they have seen a decline in public wealth measured in national income over this period—particularly, Italy (-81pp), Germany (-65pp) or the U.S. (-46pp). These developments are the result of continuing public deficit spending.
Over the period 1995–2010, 30–45% of private savings in these countries were absorbed by government budget deficits, as governments ran these deficits to pay current expenses, rather than for investments—with the result that they saw their public net wealth shrink (Piketty, 2014, p. 185–186).
Piketty (2014) further shows that in some countries such as Germany and France, public wealth accounted for up to one-third of national wealth between 1950 and 1970.
In recent years, that figure was down to 3–5% in both countries. Due to the lack of data, we are unfortunately not able to compute series on public wealth in Switzerland for the time before 1990 to understand the long run trend in public wealth. Since 1990, however, the share of public wealth in national wealth has been rather stable and even increasing in recent years.
0% 10% 20% 30% 40% 50% 60%
400% 450% 500% 550% 600% 650% 700%
1990 1995 2000 2005 2010 2015
Private wealth (left scale) Public wealth (right scale)
Figure 4: Private and Public Wealth in Percent of National Income in Switzerland, 1990–2018
Note: This figure displays both the evolution of the private wealth-income ratioβpt
and the public wealth-income
ratio
βgtof Switzerland between 1990 and 2018. Where private wealth
Wptis the sum of private non-financial
assets (consisting only of housing wealth) and financial assets minus financial liabilities. Public wealth
Wgtis the
net wealth of all public administrations and government agencies at all government levels. Where
Wgtis the sum
of its sub components non-financial assets
Kgt, financial assets
Fgtand financial liabilities
Lgt. For both public
and private wealth the development is shown in terms of national income
Yt. The data sources are described in
detail in appendix A.1 for private wealth and in A.2 for public wealth.
Three key factors have contributed to the observed increase in public wealth in Switzerland since 2004, the year public wealth was at its lowest value in the period we study. First, price effects led to significant capital gains. Second, the introduction of the debt brake at national level in 2003 (and subsequently in a series of cantons), led to a substantial reduction in public debt. Third, the exceptional monetary policy with negative interest rates and the strong Swiss currency lead to large seigniorage incomes from the Swiss National Bank over the past years.
The increase in the public wealth-income ratio can be the result of saving as well as price effects leading to capital gains as shown in the decomposition in equation (9).
Re-arranging equation (9) allows to estimate the price effect, (1 + q
t), on the change in β
gfrom public saving rate (1 + g
wst) and income growth rate (1 + g
t):
(1 + q
t) = 1 + g
t1 + g
stwβ
gt+1β
gtAccordingly, around 30% of the increase in public wealth-income ratio between 1995 and 2018 can be attributed to capital gains.
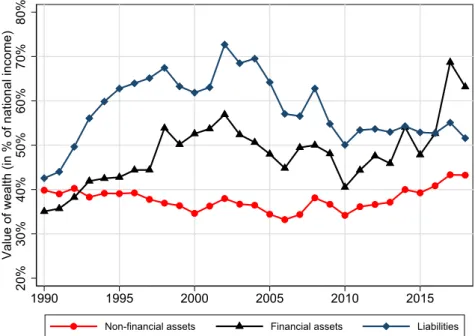
The decomposition above implies that the other 70% of the increase has to be at- tributed to public savings. 9 This is in line with Figure 5, according to which debt reduction has contributed the most towards the increase of total net public wealth. Li- abilities fell substantially after 2002, from 73% to 52% in 2008. The timing coincides well with the introduction of the “debt brake” at the federal level in 2003, a fiscal rule which requires the government to save during economic expansions, thereby reducing and avoiding structural deficits. 10 Using a synthetic control approach, Schaltegger and Salvi (2016) show that the debt brake indeed contributed substantially towards the significant public debt reduction that took place since 2003. Similar developments are observed at the cantonal level, as cantons also adopted “debt brakes” and similar budget rules in the 2000s (see Yerly, 2013, for an overview).
The increase in public wealth during this period was further fueled by monetary policy.
With the aim to counteract the appreciation of the Swiss Franc, the Swiss National Bank (SNB) has adopted a quantitative easing policy which includes negative interest rates.
As a side effect, this significantly reduced the burden of public debt service. In addition, the SNB’s policy generated large seigniorage incomes, of which two thirds are distributed to the cantons and one third to the central government. Between 2003 and 2011, the SNB
9
Note that net public savings (see Tab. B1) and capital gains in public wealth (see Tab. B5) exhibit significant fluctuations over time.
10
For additional information see:
https://www.efv.admin.ch/efv/en/home/themen/finanzpolitik _grundlagen/schuldenbremse.htmldistributed 2.5 billion and more each year to the cantons and the federation together.
Taken together, all these developments led to an increase in financial public wealth.
20% 30% 40% 50% 60% 70% 80% Value of wealth (in % of national income)
1990 1995 2000 2005 2010 2015
Non-financial assets Financial assets Liabilities
Figure 5: Decomposition of Total Net Public Wealth in Switzerland, 1990–2018
Note: This figure shows the evolution of three main components of net public wealthWgt
: public non-financial assets
Kgt, public financial assets
Fgtand public financial liabilities
Lgtmeasured in national income
Ytbetween 1990 and 2018.
Wgtis the sum of all net wealth of public administrations and government agencies at all government levels. Note that public financial liabilities
Lgtare actually negative. To obtain net public wealth
Wgtone has to subtract
Lgtfrom the sum of
Kgtand
Fgt. The corresponding data sources are described in appendix A.2.
The increase in financial assets described in Figure 5 reflects the evolution at both, the cantonal and federal levels; increases in non-financial assets happened at the municipality and cantonal levels while they fell for the confederation (see Fig. B8). The value of non- financial assets in terms of national income remained relatively stable over the past three decades.
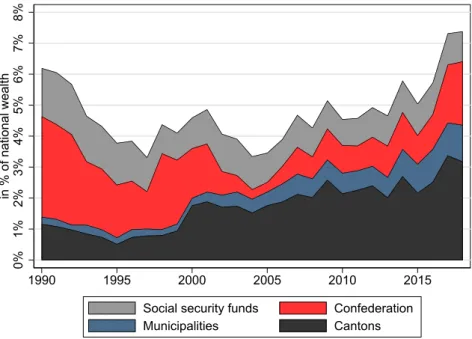
To uncover heterogeneity in net public wealth at different government levels, we fur- ther decompose total public wealth into wealth held by the Swiss Federation, the cantons (i.e., Switzerland’s federal states), municipalities, and social security funds.
Figure 6 reveals the relative importance of public wealth as a share of total wealth since 1990 by state level. Undoubtedly, a major shift has taken place from the central government (federal government including social security funds) to the lower levels of government, i.e., the municipalities and cantons.
At the federal level, the development is striking: net wealth measured in national
income fell from 17% in 1990 to as little as 1.6% in 2005. Since then a gradual recovery has been observed, although at 15.5% the wealth-income ratio at the federal level remains below its 1990 level. The situation is completely different for the cantons as well as for the municipalities. The entire increase in Switzerland’s public net wealth—relative to national income—has taken place at these two levels of government. The rise in cantons’
public wealth accounts for roughly 17.5pp of the total 22.5 percentage point increase in the public wealth-to-income ratio. Municipalities added another 7.6pp of the total 22.5pp increase in the public wealth-to-income ratio. This leaves the federal level and the social security funds with a negative contribution (-1.7pp and -0.9pp, respectively) to the public wealth-income ratio between 1990 and 2018 (see Fig. B9).
0% 1% 2% 3% 4% 5% 6% 7% 8% in % of national wealth
1990 1995 2000 2005 2010 2015
Social security funds Confederation
Municipalities Cantons
Figure 6: Public Wealth by Government-Level as Share of National Wealth, 1990–2018
Note: This figure displays the evolution of net public wealthWgt
of Switzerland as share of total national net wealth
Wntfrom 1990 to 2018 decomposed by the four government levels indicated above. The data sources are described in detail in appendix A.2.
6.3 Private Wealth and the Rise in Housing Wealth
Since private wealth makes up around 95% of national wealth in Switzerland, private wealth parallels the evolution of national wealth—which is not the case in all countries.
Particularly, Italy is much richer in private wealth than in national wealth, indicating high
public debt levels, while Sweden has high levels of net public wealth, which contributes
about one fifth to total national wealth (see Fig. B5).
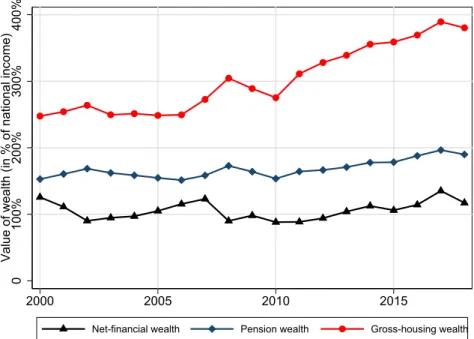
The composition of net private wealth in Switzerland shown in Figure 7 reveals that the evolution of total wealth can be traced back almost one to one to housing wealth.
Net-financial wealth has been very stable at around 100% of national income, and pension wealth has risen steadily but slowly to just below 200% of national income. This slow but steady increase in pension wealth is the combined result of pension reforms and individual responses to demographic change and longer life expectancy.
0 100% 200% 300% 400% Value of wealth (in % of national income)
2000 2005 2010 2015
Net-financial wealth Pension wealth Gross-housing wealth
Figure 7: Main Components of Private Wealth in Switzerland, 2000–2018
Note: This figure shows the evolution of three main components of private wealthWpt
: gross housing wealth, net financial wealth and pension wealth measured in national income
Ytbetween 2000 and 2018. The sum of these three sub components add up to total net private wealth as depicted in Figure B5. Detailed information on these three subcomponents can be found in appendix A.1.
The strong increase in housing wealth as share of total wealth is striking, especially because, like Germany, Switzerland is a land of tenants: the homeownership rate amounts to 38% of households and was at 32% in 1990. 11 Although there has been an increase in homeownership, the increase in housing wealth especially after 2010 has been much stronger.
One likely explanation is the observed sharp increase in real housing prices, shown in Figure 8. While real estate prices in Switzerland started to rise already after 2003, the increase clearly became steeper after 2010. In an environment of a strong currency and extremely low—since December 2014 even negative—interest rates, investment op-
11
Source: Swiss Census 1990, 2010.
portunities have become more attractive but also harder to find. Real estate is seen as an alternative asset class to government bonds and stocks, granting high returns. Pri- vate households as well as institutional investors (e.g., pension funds) and firms have been seeking out investment opportunities in real estate (Wijburg and Aalbers, 2017).
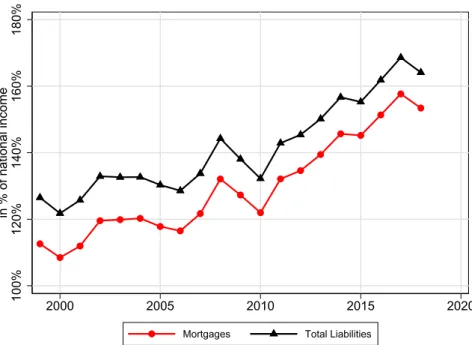
Prevailing low interest rates therefore have likely increased the demand for real estate (Wildauer and Stockhammer, 2018; André, 2010). This is supported by the finding that during that time also mortgage debt levels have increased by one quarter, going from 122% of national income in 2010 to 153% in 2018, as shown in Figure 9.
The increase in housing wealth relative to national income is by no means a unique Swiss feature. Appendix Figure B6 shows how the value of housing wealth in national income has been rising for a series of countries, except the U.S. Figure 8 further reveals the general trend in rising housing prices across Europe and in the U.S. The correlation of private wealth with real estate prices seems especially pronounced in countries where homeownership is widespread. This is the case in Italy (73% of population life in self- owned dwelling), Sweden (66%), France (64%) and the U.S. (66%). 12
The relationship between real estate prices, homeownership rates and the total private wealth-to-income ratio seems particularly plausible in the U.S. case, where homeowner- ship fell from a peak of 69% in 2005 to 63% in 2016. Prices fell sharply in 2007 and 2008 and only started rising again after 2011. The U.S. therefore experienced the combination of a crisis in the real estate market, which drove down homeownership rates and prices, and the destruction in financial assets caused by the Great Recession.
We come back to the role of capital gains and savings in housing wealth in Section 7, where we argue that this increase in housing wealth is driven by a relative increase in housing prices.
At the same time, also annual population growth spurred, increasing from 0.24%
in 1997 to 1.27% in 2008. Ever since it has remained above 1%, larger than in most other developed economies. 13 Population growth also contributed to increased housing demand. Because it takes time to increase housing supply and moreover urban land is fixed and therefore scarce. This idea dates back to Ricardo’s (1817) famous principle of scarcity; recent empirical contributions supporting this view include Rognlie (2015), Knoll et al. (2017), or Grossman and Steger (2017). The increased demand for housing from continuous population growth and low interest rates therefore ultimately led to the observed increase in real estate prices.
12
Sources: Eurostat (IT, SW, FR, 6-year average 2012–2017); U.S. Census (US).
13
Data source: The World Bank.
ρ=0.92 5 5.5 6 6.5 7 Wealth-income ratio
80 100 120 140
Real estate price index (2010=100) 2000 2010 2020
Switzerland
ρ=-0.70 2.8 3 3.2 3.4 3.6 3.8 Wealth-income ratio
100 110 120 130 140
Real estate price index (2010=100) 2000 2010 2020
Germany
ρ=0.97
1.5 2 2.5 3 3.5 4 Wealth-income ratio
40 60 80 100 120 140
Real estate price index (2010=100) 2000 2010 2020
Sweden
ρ=0.67
4.5 5 5.5 6 6.5 Wealth-income ratio
70 80 90 100 110
Real estate price index (2010=100) 2000 2010 2020
Italy
ρ=0.97 3 3.5 4 4.5 5 5.5 Wealth-income ratio
40 60 80 100 120
Real estate price index (2010=100) 2000 2010 2020
France
ρ=0.66
3.4 3.6 3.8 4 4.2 4.4 Wealth-income ratio
90 100 110 120 130
Real estate price index (2010=100) 2000 2010 2020
United States
Real estate price index Net Private Wealth-Income Ratio
Figure 8: Wealth-Income Ratios and Real Estate Price Indices, 1995–2017
Note:
This figure shows private wealth-income ratios in Switzerland, the U.S., Sweden, Germany, Italy and France
along with real house price indices of each of those countries. The price indices were obtained online from the
OECD in September 2020. The data for the real house price indices are described in appendix A.10. Appendix
Figure B10 illustrates private wealth-income ratios along with real house price indices for the U.K., Australia,
Canada, Spain, Japan and Norway.
100% 120% 140% 160% 180% in % of national income
2000 2005 2010 2015 2020
Mortgages Total Liabilities
Figure 9: Private Debt-Income Ratios in Switzerland, 1999–2018
Note: