Supporting Sensor Orchestration in Non-Stationary Environments
Christoph-Alexander Holst
Institute Industrial IT
Ostwestfalen-Lippe University of Applied Sciences Lemgo, Germany
christoph-alexander.holst@hs-owl.de
Volker Lohweg
Institute Industrial IT
Ostwestfalen-Lippe University of Applied Sciences Lemgo, Germany
volker.lohweg@hs-owl.de
ABSTRACT
The aim of sensor orchestration is to design and organise multi- sensor systems both to reduce manual design efforts and to facilitate complex sensor systems. A sensor orchestration is required to adapt to non-stationary environments, even if it is applied in streaming data scenarios where labelled data are scarce or not available. With- out labels in dynamic environments, it is challenging to determine not only the accuracy of a classifier but also its reliability. This contribution proposes monitoring algorithms intended to support sensor orchestration in classification tasks in non-stationary envi- ronments. Proposed measures regard the relevance of features, the separability of classes, and the classifier’s reliability. The proposed monitoring algorithms are evaluated regarding their applicability in the scope of a publicly available and synthetically created collection of datasets. It is shown that the approach (i) is able to distinguish relevant from irrelevant features, (ii) measures class separability as class representations drift through feature space, and (iii) marks a classifier as unreliable if errors in the drift-adaptation occur.
CCS CONCEPTS
•Computer systems organization→Sensor networks;
KEYWORDS
sensor orchestration, concept drift, non-stationary environment, fuzzy pattern classifier
ACM Reference Format:
Christoph-Alexander Holst and Volker Lohweg. 2018. Supporting Sensor Orchestration in Non-Stationary Environments. InProceedings of ACM International Conference on Computing Frontiers 2018, Workshop on Sensor Data Fusion and Machine Learning for next Generation of Cyber-Physical- Systems (SEFUMAL’18).ACM, New York, NY, USA, 8 pages.
1 INTRODUCTION
Sensor orchestrationrefers to the design and processing of multi- sensor systems. A sensor orchestration is required to select and parametrise sensors, extract and select appropriate features, and model the monitored system, e. g., for a classification task. It, thus, facilitates complex, multi-sensory application scenarios, which
Permission to make digital or hard copies of part or all of this work for personal or classroom use is granted without fee provided that copies are not made or distributed for profit or commercial advantage and that copies bear this notice and the full citation on thefirst page. Copyrights for third-party components of this work must be honored.
For all other uses, contact the owner/author(s).
SEFUMAL’18, May 2018, Ischia, Italy
© 2018 Copyright held by the owner/author(s).
would, engineered manually, be too time-consuming, too cost- ineffective or even infeasible. The termorchestrationoriginates from service-oriented architectures and is defined as follows by the International Organization for Standardization.
Definition 1(Orchestration [12]). An orchestration is the result of assembling a collection of services for a particular purpose where one particular element is used by the composition to oversee and direct the other services.
This definition does not distinguish between stationary and non- stationary processes. Nonetheless, multi-sensor systems are subject to dynamic changes due to sensor ageing effects, referred to as sensor drift, or environmental changes, referred to asprocess drift [14]. Process drift occurs due to, e. g., changes in the environment’s temperature or lighting. A sensor orchestration is, thus, required to self-monitor and adapt at runtime in order to compensate occurring drift. Important self-monitoring measures are (i) the relevance of each feature to the classification task and (ii) the separability of class representations. These measures enable an orchestration system, firstly, to identify and remove insignificant features and, secondly, to improve the classification by adding new features from a feature pool.
Sensor drift as well as process drift affect the feature space of a classification task. In general, changes in the underlying data distri- bution of features over time is referred to asconcept drift[11, 25].
Concept drift occurs in different ways. In [20, 24], sudden, gradual, incremental, and reoccurring drifts are identified. In sudden drift, a concept is replaced by another abruptly. Gradual drift describes a transition phase, in which two concepts mix, before the former concept is replaced. Incremental drift is a slow change of concepts, in which a concept drifts at small intermediate steps. Finally, a reoccurring drift refers to a situation where a concept reappears, i. e., a concept changes to a former, already known, concept. In the application area of industrial machines, sensor ageing effects as well as environmental changes occur incrementally and slowly. A sudden drift indicates sensor or machine defect, which needs to be detected separately. Therefore, the focus of this contribution is on incremental drift.
The challenge of classification and self-monitoring is aggravated in non-stationary streaming applications withextreme verification latency. Verification latency refers to the time between a received sensor measurement (data instance) and the availability of its actual label [19]. In a scenario with extreme verification latency, initially labelled data may be available for training purposes, but streamed data is unlabelled, i. e., the latency approaches infinity. Applications of multi-sensor systems in industrial systems, especially condition
Permission to make digital or hard copies of part or all of this work for personal or classroom use is granted without fee provided that copies are not made or distributed for profit or commercial advantage and that copies bear this notice and the full citation on the first page. Copyrights for third-party components of this work must be honored. For all other uses, contact the Owner/
Author.
CF '18, May 8–10, 2018, Ischia, Italy
© 2018 Copyright is held by the owner/author(s).
ACM ISBN 978-1-4503-5761-6/18/05.
https://doi.org/10.1145/3203217.3203228
monitoring, often show extreme verification latency. In such ap- plications labelled data is costly and hard to come by. It is, e. g., not feasible to train every type of error of a machine. Therefore, classifiers are trained in situations in which the system operates in its normal condition. It is assessed by a human operator whether a machine is in a normal condition. Streamed data is then unlabelled due to the cost of class labels.
Regardless of how sophisticated a drift-adapting algorithm is, the performance or accuracy, under extreme verification latency, may and will probably deteriorate at some point in time. In order to facilitate a safe application, especially in industrial environments, it is crucial that an algorithm monitors its current status and reliability.
A sensor orchestration system can only react by, e. g., adding new sensors, extracting new features, or requesting human intervention if a reliability measure is available. However, it is challenging both to determine the reliability and accuracy of a classifier if no labelled data is available to compare the classifications to.
This contribution proposes monitoring algorithms applicable to classification problems in multi-sensor systems. They are intended to support sensor orchestration in non-stationary environments with extreme verification latency. The monitoring algorithms com- prise measures for the relevance of features, for the separability of classes, and for the classifier’s reliability. The measures are based on the implemented drift-adapting classifier. This classifier is built based on a cluster-guided approach proposed in [22].
This paper is structured as follows. Related work regarding sen- sor orchestration and learning under incremental drift is discussed in Sec. 2. The proposed approach towards monitoring key charac- teristics of a multi-sensor classification in non-stationary environ- ments is presented in Sec. 3. Subsequently, the proposed algorithms are evaluated w. r. t. a publicly available collection of datasets in Sec. 4. Finally, this paper closes with a conclusion and an outlook for future work in Sec. 5.
2 RELATED WORK
Research in thefield of sensor orchestration has only gained atten- tion in recent years. Iswandy and König have developed a frame- work and design methodology for multi-sensor systems [13]. The authors focus their orchestration system on sensor parametrisation, signal conditioning, and sensor and feature selection utilisingge- netic algorithmsandparticle swarm optimisation. They identify the need for a multi-sensor system to adapt to environmental changes, referred to asself-monitoringandself-repair/healing(also:self-x properties), but leave out adaptation specifics for future work. The design methodology of [13] has been picked up and extended in the dissertation of Thongpull [23]. Regarding adaptation to environ- mental changes, the author proposes hardware-based adaptation mechanics such as, e. g., the self-calibration of single sensors by measuring reference objects. Additionally, the implementation of adapting techniques specific to particle swarm optimisation is pro- posed, including resetting the optimisation algorithm periodically.
However, the author states that, due to the complexity of the task, the integration of self-x properties are to be addressed in potential future work.
Fritze et al. have proposed an automated orchestration system of information fusion systems based on semantic self-descriptions
of sensors [10]. These self-descriptions provide details about the capabilities of a sensor and include context information about its deployment environment. The self-descriptions are processed on a central device, which orchestrates the information fusion system by logical inference utilising a rule-based system. The orchestration system adapts to failing sensors or newly available sensors, but does not check if a multi-sensor system is still able to fulfil its task after a sensor has malfunctioned. Furthermore, it does not adapt to drift in non-stationary environments.
A recent discussion and review of state-of-the-art work regard- ing learning in non-stationary environments and concept drift has been given in [15]. Khamassi et al. group drift-adapting learners intosingle learnersandensemble learners. Ensemble learners refer to the combinatorial utilisation of multiple single learners. The strength of ensemble learners is that they complement the indi- vidual weaknesses of each single learner. This requires learners which are diverse. The drawback of applying ensemble learners is that they require substantial computational efforts. Therefore, only state-of-the-art single learner approaches are presented in the following.
Souza et al. [22] have developed a framework for classification of non-stationary data streams referred to asStream Classification Al- gorithm Guided by Clustering(SCARGC). Unlabelled data is grouped into batches and then partitioned into clusters. The clusters are tracked as they drift through the feature space by mapping the class labels of clusters of the previous batch to the clusters of the current batch. The clusters are then used to retrain the classifier.
The approach generally works with any cluster and classifier algo- rithm. The batch size affects the adaptability of the drift-adapting algorithm. Small batch sizes enable an algorithm to adapt to drift swiftly, but the algorithm is then prone to noisy data and outliers.
Using large batch sizes, an algorithm is more robust but it is risked that it adapts not swiftly enough.
The same authors have proposed the use ofMicro-Clustersfor classification of drift-afflicted data streams [21]. This method man- ages without batching the streaming data. A Micro-Cluster is a compact representation of a cluster consisting of a few cluster fea- tures. These features are updated with each received data point.
This approach performs slightly worse than SCARGC but alleviates the need for setting an appropriate batch size.
Another framework addressing incremental drift in extreme verification latency has been presented in [9], referred to asModular Adaptive Sensor System. Here, training data is initially grouped by a clustering algorithm. Unlabelled streamed data is then classified by the distance to the cluster centroids and, subsequently, added to the cluster with minimum distance. Afterwards, the cluster centroid is updated. The update rule is dependent upon a learning rate.
Selecting an appropriate learning rate is non-trivial and has the same effects as the size of a batch. This framework utilises the clustering algorithm as classifier implicitly. It is designed to work with any clustering algorithm.
The presented related work regarding learning in non-stationary environments focus on improving classification accuracy or propos- ing new approaches for drift adaptation. Concepts for creating feedback of the adapting classifier are not considered.
Khamassi et al. [15] also distinguish between approaches that determine the performance of a drift-adapting classifier in a super- vised and an unsupervised way. Supervised methods rely on predic- tion feedback such as accuracy, precision, sensitivity or specificity of the classification. The degradation of a classifier’s performance is then related to its reliability. These indicators have the benefit that they are independent from the implemented learner, but they require the availability of labelled data. Unsupervised methods, which rely only on unlabelled data, are rarely available. An unsu- pervised method to predict the accuracy of a classifier is presented in [18]. The authors utilise the classifier’s uncertainty distribution over a number of batched streamed samples. They propose that a classifier is less accurate the more the uncertainty distributions of its two most likely classes overlap. It is assumed that a classifier’s uncertainty distribution of the two most likely classes corresponds to a bimodal density distribution and that each mode follows a Gaussian distribution.
In summary, state-of-the-art sensor orchestration systems ei- ther do not consider adaptation in non-stationary environments [10], implement adaptation techniques only partly [13, 23], or rely on hardware-based adaptation mechanics [23]. Works regarding machine learning under extreme verification latency focus on im- proving the drift-adaptation itself. Approaches which determine the performance, and thus indirectly the reliability, of a classifier without relying on labelled data, such as [18], are rarely available.
Therefore, an approach for supporting sensor orchestration with various feedbacks is proposed in the next section. The algorithms which generate the feedback rely on the implemented drift-adapting classifier.
3 APPROACH
In this section, algorithms for monitoring key characteristics of a multi-sensor classification are proposed. The algorithms measure the relevance of each feature, the separability of class representa- tions, and the classifier’s reliability. These measures are suggested to be utilised as feedback for sensor orchestration systems. They are based on the implemented cluster-guided classifier, which is capable of adapting to incremental drift in scenarios with extreme verification latency proposed by Souza et al. [22]. Thus, before the actual monitoring algorithms are presented, details about the im- plemented data stream classification algorithm are given in thefirst part of this section.
In this approach, the classification of a streamed data point is carried out in three steps as implemented in [1, 5]. Thefirst step is to determine the degree of class membership of a data point for each combination of classes and features individually. The memberships of each feature are then aggregated per class. Finally, the aggregated memberships are used for the actual classification.
The classification of individual features is implemented utilising theModified Fuzzy Pattern Classifier(MFPC). The MFPC is proposed in [16] based on theFuzzy Pattern Classifierintroduced in [3]. It is optimised for hardware-based implementations [16] and has been successfully used in real-world applications such as in [8].
An MFPC determines the fuzzy membership of a measurement valueθof a featuref to a specific classc. The fuzzy membership
cfµ(θ):R→[0,1]determines to which degreeθrepresentsc. The
fuzzy membership function is modelled as a unimodal potential function of the form
cfµ(θ)=
!2−d(θ,pl)ifθ ≤θ0,
2−d(θ,pr)ifθ>θ0; d(θ,pl,r)= |θ−θ0| (1+pce) ·Cl,r . The parameter vectorspl=(θ0,Cl,D,pce)andpr=(θ0,Cr,D,pce) are learned partially based on measurement data. The parameter θ0is referred to asmodeand is obtained by the arithmetic mean of the training data. Theclass bordersClandCr are computed by the minimum and maximum of the training data. The parameters slope steepnessDandpercental elementary fuzzinesspceare to be set manually. In our approach, an MFPC is trained for each feature and each class. LetMbe the set of all MFPCs,Cthe set of classes, andF be the set of features, then|M| = |C| · |F|. Aggregation of all fuzzy memberships belonging to the same class is carried out by thefuzzified balanced two-layer conflict solvingµBalTLCS information fusion operator [17]. This results in two outputs; the fused information result itself (cµ) plus an importance measure (cimp), both in[0,1]. A measurement valueθ is then classified based on the maximum operator as follows:
ˆ
y(θ)=arg max
c∈C cµ(θ).
If there is no unambiguous maximum value, i. e. multiple classes have the same aggregated class memberships, then
ˆ
y(θ)=arg max
c∈C′ cimp(θ),
in whichC′is the set of classes having the same aggregated class memberships.
In order to enable the MFPCs to adapt to incremental drift, they are repeatedly retrained on clustered data obtained by thefuzzy c-meansalgorithm introduced in [6] and improved in [2]. Streamed data is gathered in a batch. As soon as the batch reaches a specified size, the batched data are partitioned into|C|clusters. Thus, the number of classes is to be known beforehand. The batch size and the size of the initial training data is to be set manually. Thefirst clustering takes place on the labelled training data. Class labels for the clusters are obtained by the labels of the training dataset. Con- secutive clusters (taken from the incoming streamed and batched data) are labelled by taking the euclidean distances between the centroids of newly found clusters and old clusters (belonging to the last iteration). A newly found cluster gets the class label of the old cluster, to which the euclidean distance is minimal.
The complete sequence of steps, which are carried out after training on the initially labelled data is completed, is summarised in the following.
(1) The algorithm classifies incoming data points with the MFPC andµBalTLCS,
(2) it collects streamed data points in a batch, (3) clusters batched data with fuzzy c-means,
(4) maps class labels of current clusters to newly found clusters in the next batch, and
(5) relearns all MFPCs on new clusters.
Potential sources of errors regarding the adaptation towards drift are to be found in steps 3 and 4. If classes overlap in the feature space, it is difficult to separate them in appropriate clusters. Monitoring the class separability, as it is introduced in Sec. 3.2, addresses this
potential source of error and allows an orchestration system or human expert to react. Furthermore, a faulty mapping of class labels from current to new clusters may lead to a situation in which labels between classes get switched. Consequently, the classifiers of the affected classes get retrained on wrong data. Considering the potential severe consequences of mixed-up class labels, it is crucial that this error case is detected by monitoring algorithms. This is approached with an algorithm monitoring the classifiers reliability in Sec. 3.3.
3.1 Feature Relevance
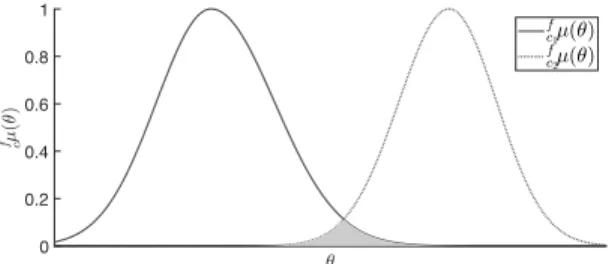
Features may become irrelevant to a classification task caused by incremental drift. In the following, the relevance of a feature is determined utilising all MFPCs of all classesc ∈C trained for a specific feature f. A feature is then regarded as relevant if the fuzzy membership functionsfcµ(θ)do not overlap geometrically. If, however, allcfµ(θ)take up the same space geometrically, i. e. over- lap completely, then the associated feature does not add value to the classification. The degree, to which the membership functions overlap, is determined by taking the area of the conjunction of the membership functions in relation to the area of the disjunction as visualised in Fig. 1. Conjunction and disjunction are obtained by the minimum (min) and the maximum (max) operator, respectively.
0 0.2 0.4 0.6 0.8 1
Figure 1: Fuzzy membership functions of a single feature representing two classes. The relevance of a feature is deter- mined by the degree of overlap, i. e., by the relation of the conjunction (shaded area) to the disjunction of the member- ship functions.
Thefeature relevanceis then defined as:
Definition 2(Feature Relevance). Letcbe a class in the set of all available classesC. Letkbe a streamed data instance,bsbe the size of the batched data, and letbk=⌊k/bs⌋be the number of the batch kbelongs to. The feature relevance is then determined by
rf[bk]=1−
∫
θ∈R
minc∈C fcµbk(θ)
∫
θ∈R
maxc∈C
cfµbk(θ). (1) The feature relevance is a real number in the unit interval (rf[bk]∈ [0,1]), withrf[bk]=0 stating absolute irrelevance andrf[bk]=1 stating maximum relevance.
If an irrelevant feature is detected, a sensor orchestration has then the option to safely remove this feature without affecting the
performance of the classification. Each feature entails computa- tional and, in case of distributed systems, communication costs.
They need to be extracted from the sensor signal and add to the complexity of the information fusion. By removing an irrelevant feature, these costs are saved.
Incremental drift may cause a feature to become irrelevant, but, as the drift continues, the same feature may once again become relevant. In this case, an orchestration system risks to remove a feature prematurely. To avoid such a premature removal, the feature relevance is smoothed with an exponential moving averagefilter so that
rf[bk,ω]=(1−ω) ·rf[bk−1,ω]+ω·rf[bk], (2) whereω∈[0,1]is an adjustable smoothing factor.
3.2 Class Separability
In real world applications, classes, which are very well separable in the training data, may become inseparable under the effect of drift.
Even the most sophisticated or best algorithms may be unable to appropriately separate classes in the given feature space. Another possible situation, which occurs frequently in real world applica- tions, is the defect of a sensor. Consequently, features extracted from the defect sensor’s signal are suddenly not available anymore.
In this case, well separable classes may become inseparable due to such a defect.
In the following, a class separability measure is proposed which is based on geometric relation of fuzzy membership functions, similar to determining the feature relevance in the previous section. Two classes are well separable if the membership functionfcµ(θ)of at least one featuref ∈Fis geometrically distinct from the others.
Based on this, aclass separabilitymeasure is proposed as follows:
Definition 3(Class Separability). The class separability of two classesc1andc2
s[bk,c1,c2]=1−min
f∈F
#$$$
%
∫
θ∈R c∈{minc1,c2}
fcµbk(θ)
∫
θ∈R c∈{cmax1,c2}
fcµbk(θ)
&' ''(
. (3)
It is defined as a measure in[0,1]. A separability close to 1 refers to distinct classes, whereas a value close to 0 indicates that the two classes entangle in the feature space.
Equation 3 measures the separability of two classes. The inten- tion behind this measure is to determine if the utilised classifier requires additional features. In a multi-class classification problem, all classes are examined regarding their separability pairwise. Ad- ditional features are required if one pair of classes is not clearly separable. Therefore, anoverall class separabilityis proposed which outputs the worst, i. e. minimal,s[bk,c1,c2]for all available pairs of classes.
Definition 4(Overall Class Separability). Let the setI={(i,j)|i,j∈ {1,2, . . . ,n},i<j}be the index set addressing all available pairs ofnclasses. The set describes all possible combination of classes so that each class is paired once with all other classes. The overall class separability is then determined as
s[bk]= min
(i,j)∈Is[bk,ci,cj]. (4)
Similar to Eq. (2), an exponential moving averagefilter with smoothing factorω∈[0,1]is applied tos[bk]so that
s[bk,ω]=(1−ω) ·s[bk−1,ω]+ω·s[bk]. (5) Whereas the feature relevance measure indicates that the amount of features can be reduced, the overall class separability measure informs that additional features are required. In case ofs[bk,ω]≪1, a sensor orchestration system has two options to expand the feature space. It can rely on a feature reserve, if previously created and available, and add a new feature from this reserve. It can also search for new features by applying different feature extraction algorithms.
If expanding the feature space is not possible, then the intervention of a human expert is necessary.
3.3 Reliability Monitoring
Even the best drift adapting classifier risks to become unreliable un- der extreme verification latency. Because only unlabelled streamed data is available to the orchestration, feedback from the classifier is especially important. A degradation of the classifier’s performance may otherwise remain unnoticed by an orchestration system or human operator. In the following, an algorithm is proposed which monitors the reliability of the adaptation process without relying on labelled data. It is based on the adapting process itself.
As identified previously, a primary possibility of failure is the mapping of class labels from one clustered batch to the next. The mapping is based on the euclidean distance between two cluster centroidscci =(cc1,cc2, . . . ,ccn), which is determined by
d(cc1,cc2)= )*+n
i=1
,cc1i ·cc2i- .
A potential faulty mapping occurs if at least two new cluster cen- troidscccb
k of batchbk have a similar distancedto the same old cluster centroidcccb
k−1. Thus, the relation between the minimal distance and the second minimal distance gives information about the potential risk of the mapping. This relation is computed once for allcccbk−1withc ∈C. The momentary reliability is then the minimum of these relations. Formally, it is defined as follows:
Definition 5(Momentary Reliability). LetCbe the set of all class indices andcccb
kbe a vector describing a cluster centroid belonging to classcat batchbk. Let min
d∈Dc(d,n)be a function returning the n-th minimum of all elements inDc ={d(cccb
k−1,ccib
k),i ∈C}}. Then the momentary reliability is determined by
ρp[bk]=1−min
c∈C#$
%
dmin∈Dc(d,1)−min
d∈Dc(d,2)
dmin∈Dc(d,2) &' (
. (6)
The momentary reliability is a measure in[0,1]. Values close to 1 indicate a high reliability and values close to 0 indicate a low reliability.
The momentary reliability provides information about the status of the current batch. The reliabilityρp[bk+1]of the next batch is unaffected ofρp[bk]. Even if a low reliability occurs atbk, the reliability of the next batch may be close to 1 again. Though, if a drift compensating algorithm has shown a low reliability once, a class
label switch may have happened rendering all future classifications as unreliable. Therefore, a sustained reliability is defined as:
Definition 6(Sustained Reliability). The sustained reliability is the minimum of all momentary reliabilitiesρpcomputed so far. It is, thus, determined by
ρ[bk]=minbk
i=1ρp[i]. (7)
The sustained reliability stores the worst momentary reliability occurred so far. It is proposed to rely on this measure as feedback to superordinate systems.
4 EVALUATION
The proposed monitoring algorithms for supporting sensor orches- tration systems are evaluated in the following section separately.
First, the drift-adapting algorithm combining fuzzy c-means, MFPC, andµBalTLCS is examined with regard to its general applicability.
Subsequently, the algorithms for assessing feature relevance, class separability, and classifier reliability are assessed individually.
The evaluation is carried out on 15 synthetically created datasets provided in [4, 7, 22]. The datasets contain an amount of data points varying from 16,000 to 200,000 and consist of two tofive features, most of them exposed to incremental or gradual drift, representing two tofive classes. Data points are sampled from Gaussian distri- butions, thus data is affected by noise. As class distributions drift through the feature space, they pass each other and intermingle.
Noise and class mingling present a challenge for adapting classifiers.
The collection of datasets is made available online1by the authors of [22] including a visual presentation of the drift occurring in the datasets. Naming conventions of the datasets are given there as well.
The applicability of fuzzy c-means clustering algorithm, MFPC, andµBalTLCS fusion operator to the problem of unlabelled stream- ing data in non-stationary environments is evaluated under three different scenarios.
• First, all MFPCs are only trained on the initially labelled data.
They are not retrained on drifted data, but remain static.
• Second, the MFPCs are constantly retrained after a new streamed data point has arrived using a sliding window. The sliding window size is set to 300 data points. In this case, the true label of the streamed data is used to train the MFPCs.
Labels are available instantly after the prediction has been made by the classifier, i. e., labels are available with zero verification latency.
• Third, the MFPCs are retrained on clusters obtained by the fuzzy c-means algorithm, as described in Sec. 3. New data is batched into a batch size of 300 data points. Only initial data points are labelled, streamed data points are unlabelled.
This represents a scenario with extreme verification latency.
It is referred to as cluster-guided approach in the following.
In each scenario, an MFPC is trained on an initial labelled dataset for each feature and for each class. The size of the labelled training dataset is set to 300 data points. An MFPC is characterized by a parameter vector, of which the parametersslope steepnessDand
1https://sites.google.com/site/nonstationaryarchive/, accessed on 2018-02-10
Table 1: Average accuracy of the sliding window approach and the approach combining fuzzy c-means clustering and the MFPC classifier applied to the synthetic datasets from [4, 7, 22].
Dataset Static Sliding fuzzy c-means and MFPC
1CDT 0.9607 0.9992 0.9990
2CDT 0.5451 0.9510 0.9264
1CHT 0.7573 0.9950 0.9948
2CHT 0.4783 0.8901 0.8726
4CR 0.2507 0.9990 0.9991
4CRE-V1 0.2549 0.9797 0.8467
4CRE-V2 0.2676 0.9178 0.6989
5CVT 0.4486 0.8981 0.8498
1CSurr 0.6552 0.9026 0.8035
4CE1CF 0.8616 0.9772 0.9265
UG_2C_2D 0.4832 0.9565 0.9550
MG_2C_2D 0.5291 0.8699 0.7524
FG_2C_2D 0.8022 0.8871 0.5827
UG_2C_3D 0.6954 0.9477 0.9484
UG_2C_5D 0.6556 0.9258 0.9175
GEARS_2C_2D 0.9573 0.9553 0.9580
percental elementary fuzzinesspceare set manually in this evalu- ation. They are set identically for each membership function to D=2 andpce=0.075. Fuzzy memberships obtained by the MFPCs are then fused for each class by theµBalTLCS operator.
In the sliding window scenario, information about class mem- berships is instantly available. Therefore, it is to be expected that the classification in this scenario outperforms the classification in the third scenario. It, thus, serves as a reference value.
The quality of the classification is assessed by itsaccuracya. The accuracy is updated as soon as a new data point is received. The accuracy is computed as an evaluation metric. In a classification task under extreme verification latency, this metric is not available, e. g., to monitor the reliability of the adapting classifier. The accuracy up to a specific data point is then determined as follows:
a[k]= .k i=1tc[i]
k ;tc[i]=
!1 if true classification fori, 0 if false classification fori. (8) Thefinal accuracy (over all available data points) achieved in the three outlined scenarios is depicted in Table 1. With the exception of datasets4CRE-V1,4CRE-V2,FG_2C_2D, andMG_2C_2D, the fuzzy c-means and MFPC approach shows classification accuracies in the range of 0.85 and 0.99. With the exception of datasetFG_2C_2D, the accuracies are significantly improved in comparison to the static approach.
Datasets4CRE-V1,4CRE-V2,FG_2C_2D, andMG_2C_2Dshow a notable drop in accuracy of the cluster-guided algorithm in com- parison to the sliding window approach (difference in accuracies greater than 0.1). Although thefinal accuracy over the total datasets is low, the accuracy over time is stable for datasets4CRE-V1,4CRE- V2, andMG_2C_2D(∀k ≤kx :a(k) ≥0.9) up to a specific data
instance (kx≈9·104for4CRE-V1,kx≈10·104for4CRE-V2, and kx ≈6·104forMG_2C_2D). From this point on, the accuracies start to deteriorate. These sudden degradations hint at a false mapping of the old cluster labels to the new clusters. In Sec. 4.2 and Sec. 4.3 it is evaluated whether the proposed monitoring algorithms are able to detect this deterioration. The datasetFG_2C_2Dis the only one for which the accuracy of the cluster-guided algorithm is significantly worse than the static approach. In this case, a faulty class label mapping occurs directly as the data begins to stream. This results in a classification accuracy of nearly 0.5, which is not better than guessing.
4.1 Feature Relevance
In the following, the approach of monitoring the relevance of fea- tures, as proposed in Sec. 3.1, is evaluated with regard to theOne Class Horizontal (1CHT)dataset. This dataset comprises two classes represented each by two distinct featuresf1andf2. Of these two classes, thefirst (c1) is stationary throughout the dataset, whereas the second (c2) drifts horizontally through the feature space. Thus, the measurement valuesθ[k]off1belonging to the second class re- main stationary in the same area, though they are affected by noise.
The measurement values off2belonging to the second class are affected by drift. Furthermore, the valuesθ[k]off1are not clearly separable. Hence, they provide no added value for the classification task and it is to be expected that the membership functions of their MFPCsfc11µandfc12µoverlap significantly resulting in a low relevance rf1.
The relevances of both features obtained from Eq. (1) and the filtered relevances obtained from Eq. (2) with a smoothing factor ofω =0.2 are shown in Fig. 2. Featuref1shows low relevances, plotted as solid lines, for all batchesbthroughout the dataset as expected (∀b:rf1[b,ω=0.2]≪1). In contrast tof1, featuref2has a higher relevance throughout the dataset. In the beginning of the streamed dataset, classesc1andc2are close together in the feature space. Accordingly,rf2[1]has a low value of 0.39. The relevance of f2then starts to increase asc2drifts horizontally trough the feature space and decreases again asc2reverses its drift.
0 15 30 45
0 0.2 0.4 0.6 0.8 1
Figure 2: Feature relevance measures for featuresf1andf2
from dataset1CHT. Whereasf2shows a high relevance for the most part of the dataset,f1is irrelevant to the classifica- tion task (∀bk:rf1[bk,ω=0.2]≪1).
A sensor orchestration system working with the dataset1CHT would be expected to removef1from the feature space as it detects its irrelevance, but needs to keepf2to be able to distinguish the classes. An orchestration system would need to set a threshold.
If the relevance of a feature falls below this threshold, it could beflagged for removal. Determination of this threshold is not a focus of this paper, though in the example of the dataset1CHTany threshold smaller thanrf2[bk,ω =0.2] =0.39 and greater than rf1[bk,ω=0.2]=0.04 would suffice.
4.2 Class Separability
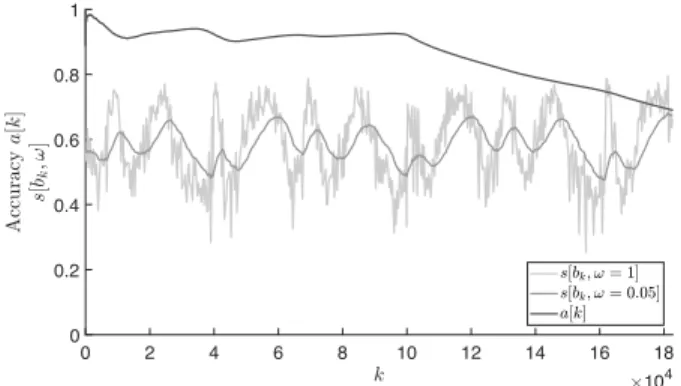
In this section, the approach for determining the overall class sep- arability is evaluated on theFour Classes Rotating with Expansion V2 (4CRE-V2)dataset. The4CRE-V2dataset comprises four classes represented by two features. The four classes rotate through the feature space and move towards and from each other cyclically.
As they drift towards each other, the class representations overlap in the feature space. They are, thus, difficult to separate clearly at specific times. Furthermore, this dataset is one of the worse perform- ing datasets regarding their accuracy. The accuracy experiences a sudden deterioration. It is to be evaluated if monitoring class separability is able to detect this deterioration.
The class separabilities obtained from Eq. (4) and Eq. (5) are shown in Fig. 3 together with the accuracya[k]. A smoothing fac- tor ofω =0.05 has been used for this part of the evaluation. At k≈10·104it is clearly visible that the accuracy starts to deteri- orate. Moreover, Fig. 3 shows that the class separability measure reproduces the oscillatory contracting and expansion of the classes.
Nonetheless, the degradation of accuracy atk ≈ 10·104is not indicated by the class separability measure.
0 2 4 6 8 10 12 14 16 18
104 0
0.2 0.4 0.6 0.8 1
Figure 3: Accuracya[k] and class separabilitys[bk,ω] for dataset4CRE-V2with batch numbersbk=⌊k/300⌋. The class separability oscillates as the classes move towards and away from each other. The drop of accuracy at approximately k≈10·104is not indicated bys[bk,ω].
Figure 3 also shows the effect of the exponential moving average filter on the class separability. There is a temporary drop in overall class separabilitys[bk,ω=1]atk=15.6·104down to 0.26. With- out an averagefilter, this temporary drop may lead to premature warnings for the orchestration system.
4.3 Reliability Monitoring
Similarly to Sec. 4.2, the4CRE-V2dataset is used to evaluate the al- gorithms determining the classifier’s reliabilitiesρpandρ. Figure 4 depicts both reliabilities obtained from Eq. (6) and Eq. (7) as well as the classification accuracy. The momentary reliabilityρpof the classifier shows three prominent negative peaks atk≈{4·104,10· 104,16·104}. These negative peaks suggest that a faulty mapping of class labels from the current clusters to newly found clusters did possibly occur. As can be seen from the plot of the accuracy, a mismapping atk≈4·104did not happen, else the accuracy would have decreased from this point on. Such a decrease occurs instead atk≈10·104, which is successfully indicated and detected by the reliability monitoring algorithm, in contrast to the class separability algorithm. However, as the accuracy is unknown in an application with extreme verification latency, the classifier is to be assessed as unreliable after thefirst negative peak inρp. This is indicated by the sustained reliabilityρplotted in Fig. 4 as a dotted line.
0 2 4 6 8 10 12 14 16 18
104 0
0.2 0.4 0.6 0.8 1
Figure 4: Accuracya[k] and classifier’s reliabilities ρp[bk] and ρ[bk] for dataset 4CRE-V2 with batch numbersbk =
⌊k/300⌋. Atk≈{4·104,10·104,16·104}the momentary relia- bilityρp[bk]exhibits negative peaks, which indicate possible faulty mappings from old to new clusters. The accuracy drop atk≈10·104indicates that indeed a faulty mapping has oc- curred. Although the accuracy is stable ink≈[4·104,10·104], the classifier is not reliable anymore afterk≈4·104(shown by the dotted line).
5 CONCLUSION
Sensor orchestration in non-stationary environments is dependent upon feedback from the orchestrated multi-sensor system. The or- chestration system is only able to adapt to environmental changes or sensor ageing effects if this feedback is available. Multi-sensor systems in industrial applications often represent an extreme ver- ification latency scenario. Since only unlabelled streamed data is available to the orchestration at runtime, feedback is especially important else the performance of, e. g., a classifier may deteriorate without notice.
This contribution proposes the application of monitoring algo- rithms to support sensor orchestration in non-stationary environ- ments under extreme verification latency. Valuable information
in multi-sensor classification tasks are the relevance of individ- ual features, the separability between class representations, and the current reliability of the drift-adapting algorithm. The drift- adapting classifier, implemented in our approach, is based on the cluster-guided method proposed in [22]. It is implemented utilising the MFPC as base classifier modelling the class representation of each feature. The fuzzy memberships obtained by the MFPCs are aggregated with theµBalTLCS fusion operator resulting in a class membership for each class. Final classification is then carried out by taking the maximum class membership as prediction label. The adaptation of the MFPCs to concept drift is guided by the fuzzy c-means clustering algorithm, i. e., each MFPC is periodically re- trained on clustered batches of data. Feature relevance and class separability are determined by computing the overlapping regions of the fuzzy membership functions belonging to the same feature or to the same class, respectively. A potential cause of error in the drift-adapting algorithm is identified, which is the mapping of the class label from current to new clusters. This is utilised for the reliability measure. It detects situations, in which a faulty mapping is likely, and marks the classifier as unreliable from thereon.
The proposed monitoring algorithms are evaluated regarding their applicability in the scope of synthetically created datasets provided by [4, 7, 22]. It is shown that the proposed approach, ap- plied to the1CHTdataset, distinguishes relevant from irrelevant features. The class separability and reliability measures are eval- uated w. r. t. the4CRE-V2dataset. The evaluation shows that the class separability measure reflects the movement of classes as they intermix and separate in the feature space. The reliability mea- sure successfully detects a faulty mapping during clustering of the streamed data in the4CRE-V2dataset. Consequently, the classifier is marked as unreliable.
The proposed monitoring algorithms are yet to be implemented into a sensor orchestration system. Such a sensor orchestration, then, needs to be evaluated on real-world datasets with a large enough feature pool so that, after an initial feature selection, fea- tures can be dynamically added or removed at runtime. It is to be shown whether the proposed monitoring algorithms are beneficial to a sensor orchestration on such a real world dataset. The pro- posed approach is not evaluated regarding its scalability in this paper. Future work needs to address this and optimise the approach with regard to its runtime.
ACKNOWLEDGMENT
This work was partly funded by the German Federal Ministry of Education and Research (BMBF) within the Leading-Edge Clus- ter “Intelligent Technical Systems OstWestfalenLippe” (it’s OWL) (Grant No. 02PQ1020).
REFERENCES
[1] Christian Bayer, Martyna Bator, Uwe Mönks, Alexander Dicks, Olaf Enge- Rosenblatt, and Volker Lohweg. 2013. Sensorless Drive Diagnosis Using Auto- mated Feature Extraction, Significance Ranking and Reduction. In2013 IEEE 18th Conference on Emerging Technologies Factory Automation (ETFA), Carla Seatzu and Richard Zurawski (Eds.). IEEE, 1–4.
[2] James C. Bezdek. 1981.Pattern Recognition with Fuzzy Objective Function Algo- rithms. Springer, Boston, MA.
[3] Steffen F. Bocklisch (Ed.). 1986.Fuzzy sets applications, methodological approaches, and results: Proceedings of the International Workshop on Fuzzy Sets Applications.
Mathematical research, Vol. 30. Akademie-Verlag, Berlin.
[4] Gregory Ditzler and Robi Polikar. 2013. Incremental Learning of Concept Drift from Streaming Imbalanced Data. IEEE Transactions on Knowledge and Data Engineering25, 10 (2013), 2283–2301.
[5] Helene Dörksen and Volker Lohweg. 2015. Automated fuzzy classification with combinatorial refinement. In2015 IEEE 20th Conference on Emerging Technologies Factory Automation (ETFA). IEEE, 1–7.
[6] J. C. Dunn. 1973. A Fuzzy Relative of the ISODATA Process and Its Use in Detecting Compact Well-Separated Clusters.Journal of Cybernetics3, 3 (1973), 32–57.
[7] Karl B. Dyer, Robert Capo, and Robi Polikar. 2014. COMPOSE: A semisupervised learning framework for initially labeled nonstationary streaming data. IEEE transactions on neural networks and learning systems25, 1 (2014), 12–26.
[8] Jan-Friedrich Ehlenbröker, Uwe Mönks, and Volker Lohweg. 2016. Sensor Defect Detection in Multisensor Information Fusion. Journal of Sensors and Sensor Systems5, 2 (2016), 337–353.
[9] Christopher Frederickson, Thomas Gracie, Steven Portley, Michael Moore, Daniel Cahall, and Robi Polikar. 2017. Adding adaptive intelligence to sensor systems with MASS. In2017 IEEE Sensors Applications Symposium. IEEE, 1–6.
[10] Alexander Fritze, Uwe Mönks, Christoph-Alexander Holst, and Volker Lohweg.
2017. An Approach to Automated Fusion System Design and Adaptation.Sensors 17, 3 (2017), 601.
[11] João Gama, Indr˙eŽliobait˙e, Albert Bifet, Mykola Pechenizkiy, and Abdelhamid Bouchachia. 2014. A Survey on Concept Drift Adaptation.ACM Comput. Surv.
46, 4 (2014), 44:1–44:37.
[12] ISO/IEC 18384-1:2016. 2016. Information technology – Reference Architecture for Service Oriented Architecture (SOA RA) – Part 1: Terminology and concepts for SOA. (2016).
[13] Kuncup Iswandy and Andreas König. 2009. Methodology, Algorithms, and Emerging Tool for Automated Design of Intelligent Integrated Multi-Sensor Systems.Algorithms2, 4 (2009), 1368–1409.
[14] Petr Kadlec, Bogdan Gabrys, and Sibylle Strandt. 2009. Data-driven Soft Sensors in the process industry.Computers & Chemical Engineering33, 4 (2009), 795–814.
[15] Imen Khamassi, Moamar Sayed-Mouchaweh, Moez Hammami, and Khaled Ghédira. 2018. Discussion and review on evolving data streams and concept drift adapting.Evolving Systems9, 1 (2018), 1–23.
[16] Volker Lohweg, Carsten Diederichs, and Dietmar Müller. 2004. Algorithms for Hardware-Based Pattern Recognition.EURASIP Journal on Applied Signal Processing2004, 12 (2004), 1912–1920.
[17] Volker Lohweg and Uwe Mönks. 2010. Sensor Fusion by Two-Layer Conflict Solving. In2nd International Workshop on Cognitive Information Processing (CIP 2010). IEEE, 370–375.
[18] Edwin Lughofer, Eva Weigl, Wolfgang Heidl, Christian Eitzinger, and Thomas Radauer. 2016. Recognizing input space and target concept drifts in data streams with scarcely labeled and unlabelled instances. Information Sciences355-356 (2016), 127–151.
[19] Gary R. Marrs, Ray J. Hickey, and Michaela M. Black. 2010. The Impact of Latency on Online Classification Learning with Concept Drift. InKnowledge Science, Engineering and Management, Yaxin Bi and Mary-Anne Williams (Eds.).
Springer Berlin Heidelberg, 459–469.
[20] Sergio Ramírez-Gallego, Bartosz Krawczyk, Salvador García, MichałWoźniak, and Francisco Herrera. 2017. A survey on data preprocessing for data stream mining: Current status and future directions.Neurocomputing239 (2017), 39–57.
[21] Vinícius M. A. Souza, Diego F. Silva, Gustavo E.A.P.A. Batista, and João Gama.
2015. Classification of Evolving Data Streams with Infinitely Delayed Labels. In IEEE 14th International Conference on Machine Learning and Applications. IEEE, 214–219.
[22] Vinícius M. A. Souza, Diego F. Silva, João Gama, and Gustavo E. A. P. A. Batista.
2015. Data Stream Classification Guided by Clustering on Nonstationary En- vironments and Extreme Verification Latency. InProceedings of the 2015 SIAM International Conference on Data Mining, Suresh Venkatasubramanian and Jieping Ye (Eds.). Society for Industrial and Applied Mathematics, 873–881.
[23] Kittikhun Thongpull. 2016. Advancing the automated design of integrated in- telligent multi-sensory systems with self-X properties. (Doctoral dissertation), Forschungsberichte Integrierte Sensorsysteme, Vol. 7. Universität Kaiserslautern, Kaiserslautern.
[24] Indr˙eŽliobait˙e. 2010. Learning under Concept Drift: An Overview.Computing Research Repository (CoRR)abs/1010.4784 (2010).
[25] Indr˙eŽliobait˙e, Mykola Pechenizkiy, and João Gama. 2016. An Overview of Concept Drift Applications. InBig Data Analysis: New Algorithms for a New Society, Nathalie Japkowicz and Jerzy Stefanowski (Eds.). Springer International Publishing, 91–114.
![Table 1: Average accuracy of the sliding window approach and the approach combining fuzzy c-means clustering and the MFPC classifier applied to the synthetic datasets from [4, 7, 22].](https://thumb-eu.123doks.com/thumbv2/1library_info/5234672.1670959/6.918.111.411.208.519/average-accuracy-approach-approach-combining-clustering-classifier-synthetic.webp)