1
Originally published as:
Lithium isotopic fractionation during weathering and erosion of shale
Grit Steinhoefel, G., Brantley, S. L., Fantle M. S. (2021): Lithium isotopic
fractionation during weathering and erosion of shale. Geochimica et
Cosmochimica et Acta 295, 155-177. doi: 10.1016/j.gca.2020.12.006
2
Lithium isotopic fractionation during weathering and erosion of shale
Geochimica et Cosmochimica et Acta (2021), doi: 10.1016/j.gca.2020.12.006
Grit Steinhoefel1*, Susan L. Brantley1,2, Matthew S. Fantle1
1Department of Geosciences, Pennsylvania State University, University Park PA 16802 (USA)
2Earth and Environmental Systems Institute, Pennsylvania State University, University Park PA 16802 (USA)
Corresponding author*: Grit Steinhoefel, grit.steinhoefel@awi.de, phone: +49+49(471)4831- 2093, present address: Alfred Wegener Institute, Helmholtz Centre for Polar and Marine Research, D-27570 Bremerhaven (Germany).
Highlights:
We investigate Li isotopes and concentration in a shale catchment
The relative rates of Li incorporation into secondary minerals control 7Li of water
Subsurface erosion of clay particles controlls 7Li and Li depletion in soils
Subsurface erosion in shale is likely a prominent component of global weathering
Abstract
Clay weathering in shales is an important component of the global Li budget because Li is mobilized from Li-rich clay minerals and shale represents about one quarter of the exposed rocks on Earth. We investigate Li isotopes and concentrations to explore implications and mechanisms of Li isotopic fractionation in Shale Hills, a first-order catchment developed entirely on shale in a temperate climate in the Appalachian Mountains, northeastern USA. The Li isotopic compositions (7Li) of aqueous Li in stream water and groundwater vary between 14.5 and 40.0‰. This range is more than half that observed in rivers globally. The 7Li of aqueous Li increases with increasing Li retention in secondary minerals, which is simulated using a box model that considers pore fluid advection to be the dominant transport process, silicate dissolution to be the source of Li to the pore fluid, and uptake of Li by kaolinite, Fe-
3
oxides, and interlayer sites of clays to be the sinks. The simulations suggest that only those deep groundwaters with 7Li values of ~15‰ are explainable as steady state values; those fluids with 7Li values >18‰, especially near-surface waters, can only be explained as time- dependent, transient signals in an evolving system. Lithium is highly retained in the residual solid phase during chemical weathering; however, bulk soils (0.5 ± 1.2‰ (1 SD)) and stream sediments (0.3%) have similar, or higher, 7Li compared to average bedrock (-2.0‰). This is attributed to preferential removal of clay particles from soils. Soil clays are isotopically depleted in 7Li (7Li values down to -5.2‰) compared to parental material, and 7Li values correlate with soil Li concentration, soil pH, and availability of exchangeable sites for Li as a function of landscape position (valley floor versus ridge top). The strong depletion of Li and clay minerals in soils compared to bedrock is attributed at least partly to loss of Li through export of fine-grained clay particles in subsurface water flow. This process might be enhanced as the upper weathering zone of this catchment is highly fractured due to former periglacial conditions. The Li isotopic composition of vegetation is similar to soil clay and both are distinct from mobile catchment water (in soil pore water, stream and groundwater). Extrapolating from this catchment means that subsurface particle loss from shales could be significant today and in the past, affecting isotopic signatures of soils and water. For example, clay transformations together with removal of clay particles before re-dissolution support weathering conditions that lead to a low aqueous Li flux but to high 7Livalues in water.
1. Introduction
Chemical weathering of silicate minerals promotes secondary mineral formation and the release of aqueous cations and alkalinity to the ocean. These reactions are linked to the long-term carbon cycle by removing atmospheric CO2 through solubilization of silicate minerals and to the short-term cycle by supplying nutrients to facilitate biological activity.
Both of these processes can sequester carbon in carbonates and organic matter in the marine sedimentary column. Therefore, weathering is a key process that regulates atmospheric CO2
over geological time scales (Walker et al., 1981; Berner et al., 1983; Kump et al., 2000). Over the Cenozoic, weathering fluxes and intensity have varied in ways that have impacted climate, atmospheric composition, and seawater chemistry, and these changes have been explored by seawater records of isotopes such as Sr and Os (e.g., Peucker-Ehrenbrink and Ravizza, 2000;
Peucker-Ehrenbrink and Fiske, 2019) and more recently in records of beryllium isotopes
4
(10Be/9Be) (Willenbring and von Blanckenburg, 2010; Wittmann et al., 2017; Valletta et al., 2018) and Li isotopes (Hall et al., 2005; Hathorne et al., 2006; Misra and Froelich, 2012;
Dellinger et al., 2018; Roberts et al., 2018). For example, the seawater Li isotope curve shows an increase of about 9‰ during the Cenozoic to the modern δ7Li value of 31‰ (Misra and Fröhlich, 2012; Hathorne et al., 2006), which has engendered a debate over the primary controls on the Li isotopic composition of the continental weathering flux. Most interpretive studies focus on clay formation as a key mechanism controlling Li isotopic fractionation (Bouchez et al., 2013; Li and West, 2014; Wanner et al., 2014; Vigier and Godderis, 2015;
Rugenstein et al., 2019). A few studies have also explored 7Li in clastic sediment records and in stalagmites as a tracer of paleo weathering intensities on the glacial-interglacial time scale (Dosseto et al., 2015; Bastian et al., 2017; Dellinger et al., 2017; Pogge von Strandmann et al., 2017a).
Lithium isotopic fractionation occurs during clay formation and adsorption processes, both of which favor the incorporation of the light nuclide (Huh et al., 1998; Zhang et al., 1998;
Pistiner and Henderson, 2003; Williams and Hervig, 2005; Pogge von Strandmann et al., 2006;
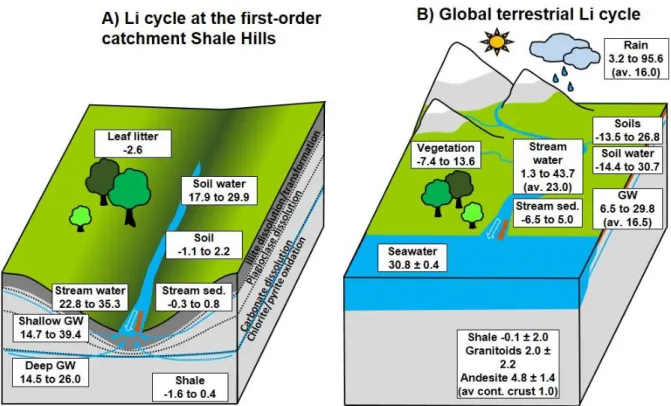
Vigier et al., 2008; Teng et al., 2010; Wimpenny et al., 2010, 2015; Hindshaw et al., 2019a; Li and Liu, 2020). Such reactions have been interpreted to generate variable 7Liaq values in aqueous Li in rivers that range from 1.3 to 43.7‰ (high compared to bedrock). The global average for large rivers is about 23‰ (Huh et al., 1998; Hindshaw et al., 2019a). The difference in Li isotopic composition between aqueous Li in river water and bedrock, 7Liaq-rock, is thought to be controlled by the balance between Li released by mineral dissolution and Li uptake by secondary mineral formation (Bouchez et al., 2013).
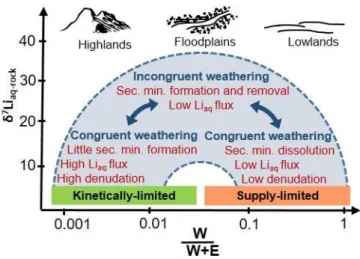
Lithium isotopic systematics thus have strong implications for understanding the partitioning of minerals into those that solubilize during chemical weathering versus less soluble minerals that are removed by physical erosion at the land surface. These two fluxes - referred to here as W (chemical weathering flux) and E (physical erosion flux) respectively - can be summed to describe the denudation flux, D (Riebe et al., 2017). Lithium isotopes are considered useful in understanding the partitioning into W and E because 7Liaq-rock is sensitive to the weathering intensity (= W/D). Perhaps most importantly, a study on the Amazon basin together with data from other large river systems elucidated a bell-shaped relationship between 7Liaq-rock and weathering intensity (see Fig. 1 for a schematic) that was attributed to
5
changes in the weathering regime (Dellinger et al., 2015). Kinetically-limited systems were thought to be characterized by high D (caused by high E) and low W/D. Under such conditions, typically reflected by highlands, mineral dissolution prevails over secondary mineral formation and systems are characterized by a high aqueous Li flux and little isotopic fractionation. These conditions result in low 7Liaq values in river water that are closer to bedrock values (e.g., Kisakürek et al., 2005). A somewhat similar situation occurs for supply-limited systems that prevail in lowlands (e.g., old shield terrains) where W/D is high due to low E (e.g., Clergue et al., 2015). As in the case above, mineral dissolution dominates over secondary mineral formation because clay minerals start to dissolve, resulting in relatively low 7Liaq values in river water and a low aqueous Li flux. A different situation exists for mid-range W/D, typically occurring in floodplains: a high rate of secondary mineral formation promotes high 7Liaq
values in river water but a low aqueous Li flux (Bagard et al., 2015; Pogge von Strandmann et al., 2017b).
To advance Li isotopes as a proxy for present-day and paleo-weathering processes, and to understand how isotopic fractionation relates to W and E, it is essential to elucidate the controls of Li isotopic fractionation for aqueous and particulate Li riverine export. Given that two thirds of the exposed continents are today covered by sedimentary rocks that contain a low fraction of primary minerals other than quartz (Holland, 1978; Gaillardet et al., 1999;
Hartmann and Moosdorf, 2012; Dellinger et al., 2014), we present Li isotopic results for a shale-underlain watershed. The weathering of shale in particular is important because this lithology comprises more than half of sedimentary rocks while containing a high abundance of Li-rich clay mineral phases (Teng et al., 2004).
At its most simple, shale is dominated by clay and quartz, with variable but generally less abundant feldspar, carbonate minerals, iron oxides, and lithic fragments. In the catchment investigated here (Shale Hills), Li release during weathering is dominated by clay mineral reactions, as feldspar is low in abundance, and quartz dissolution rates are extremely slow as in most canonical shales (Jin et al., 2010). What is not as well known, however, is how much shale is lost to chemical weathering versus physical erosion (i.e. the weathering intensity W/D). Accordingly, this study fills in a critical gap in knowledge regarding Li isotopic fractionation associated with shale weathering. We investigate Li isotopic systematics associated with the weathering of Silurian gray shale at Shale Hills which is part of the
6
Susquehanna Shale Hills Critical Zone Observatory (SSHCZO), U.S.A. We report the Li isotopic compositions and Li concentrations of soils and stream sediments, as well as stream water, soil water, and groundwater, and relate the effective isotopic fractionation observed in the system to specific processes; further, we quantifyaqueous and particulate Li fluxes associated with shale weathering at the watershed scale.
2. Field Site and Sample Descriptions
The SSHCZO (Fig. 2) is part of a network of Critical Zone Observatories (CZO) established in the U.S.A. and proliferating worldwide to investigate the interaction of geochemical, geomorphological, hydrological, and biological processes in the weathering zone over different climatic conditions, tectonic settings, and lithologies (e.g., Brantley et al., 2018).
The earliest focus site in the SSHCZO was Shale Hills, a V-shaped forested catchment, with a first-order ephemeral stream. Shale Hills covers an area of about 0.08 km2 in the northern part of the Appalachian Mountains in the central part of the state of Pennsylvania (USA). It is a well-characterized system (Brantley et al., 2018), as previous studies provide extensive data sets from field monitoring, elemental and isotopic measurements, and mineralogical investigations as well as abundant constraints developed from modelling (Lynch and Corbett, 1985; Lin et al., 2006; Qu and Duffy, 2007; Ma et al., 2010, 2011a, b, 2013, 2014, 2015; Jin et al., 2011; Jin and Brantley, 2011; Yesavage et al., 2012; Thomas et al., 2013; West et al., 2013;
2014; Noireaux et al., 2014, in press; Shi et al., 2014; Sullivan et al., 2016a; Herndon et al., 2018). Shale Hills is also one of a handful of watersheds where multiple isotopes have been measured on samples from identical locations, offering unparalleled capacity to test isotopic systematics as well as weathering processes (Sullivan et al., 2016b).
The study region is characterized by a humid-temperate climate, with an average annual precipitation of 102 cm y-1 and a mean annual temperature of 10.1°C (based on a 30- year record, NOAA, 2017). Stream discharge is high (ca. 0.05 m3 s-1) during snowmelt in spring and storm events in summer and fall, whereas the stream during the generally dry summer is more strongly affected by groundwater inflow (Jin et al., 2011; Kuntz et al., 2011; Thomas et al., 2013; Sullivan et al., 2016a). The stream goes dry in late summer and early autumn except for large storms during those dry months. Almost 90% of the water that enters the catchment and is not lost to evapotranspiration leaves as interflow, defined here to be shallow
7
groundwater that flows downslope along transiently perched water tables into the stream (Sullivan et al., 2016a). The rest of the water leaves through infiltration to deep, regional groundwater that flows out of the catchment in the subsurface, sometimes entering the stream near the outlet.
The catchment is developed on the Silurian Rose Hill Formation in the Clinton Group and comprises mainly gray shales with minor carbonate and increasing carbonate and sandy layers toward the catchment outlet (Lynch and Corbett, 1985; Sullivan et al, 2016a; Brantley et al., 2018). The region is relatively undeveloped and largely pristine, and is covered by a mixed forest impacted by previous clear-cuts (most recent logging occurred in the 1930s) and minor impacts from regional eolian industrial pollution (Lin et al., 2006; Herndon and Brantley, 2011; Ma et al., 2014).
At Shale Hills, weathering takes place in reaction fronts from the depth of the groundwater table in bedrock up to the soil zone (Brantley et al., 2013). Chemical weathering of clays and feldspars is kinetically-limited (Gu et al., 2020). In contrast, weathering of pyrite and carbonate occurs rapidly and these minerals are not exposed at the land surface (Gu et al., 2020). Such mineral weathering has been shown to be localized in several reaction fronts that initiate at various depths (Fig. 3a) : 1) pyrite is completely depleted in soils and weathered rock by oxidative dissolution down to tens of meters depth under the ridges and 6 m under the valley floor; 2) carbonate is completely removed down to tens of meters depth under the ridges and to 2 m beneath the valley; 3) chlorite weathering generally initiates at the same depths as pyrite oxidation and continues upward to the soil zone; 4) plagioclase is depleted by weathering down to 5 or 6 m; 5) illite mineral dissolution initiates at approximately the depth that the weathered rock disaggregates into soil, i.e., above about 1-2 m depth depending upon landscape position (Jin et al., 2010, 2011; Brantley et al., 2013; Sullivan et al., 2016a). The best approximation to the parental shale composition is derived from samples from deep cores of the bedrock. However, the weathered rock (referred to at the SSHCZO as
“saprock”) above the pyrite and carbonate weathering fronts retain most of the physical attributes of pristine bedrock. The typical saprock composition is 58 wt.‰ illite, 30 wt.‰
quartz, 11 wt.‰ “chlorite” (chlorite-like minerals which includes chlorite, vermiculite, and hydroxy-interlayered vermiculite (HIV)), and trace amounts of both feldspar (plagioclase and alkali-feldspar) and Fe-oxides (Jin et al., 2010; Jin and Brantley, 2011). The deep weathering
8
associated with the pyrite and carbonate has little effect on the Li chemistry because the Li concentration in carbonates and pyrite is very low compared to silicate minerals; in addition, although chlorite weathering initiates under the ridges upon oxidative weathering of pyrite, the extent of “chlorite” weathering in the saprock remains exceedingly small (Gu et al., 2020).
Bulk soils in Shale Hills are affected by the mineralogy of parental material but contain organic matter and as much as 3 wt. % kaolinite and are depleted in illite and “chlorite”.
Weathering of the carbonate-depleted saprock has been summarized by the following mineral transformations: 1) plagioclase → kaolinite, 2) illite → vermiculite, 3) chlorite → vermiculite, 4) vermiculite → HIV, 5) HIV → kaolinite + Fe-oxyhydroxide, and 6) pyrite → Fe-oxyhydroxide (Jin et al., 2010). Mass balance calculations using the mass transfer coefficient show that 20 to 50% of many elements have been lost from the soils as solutes whereas the other fraction is lost as micron-sized particles from throughout the soil column and from the subsurface saprock (e.g., Jin et al., 2010; Hasenmueller et al., 2017; Kim et al. 2018, 2019; Bern and Yesavage, 2018, 2019). The soil system at the catchment scale is approaching a steady state after the Last Glacial Maximum: the regolith production rate rate of physical erosive removal of soil within error, at least at the ridgetops. Values of both these rates have been summarized based on U disequilibrium and 10Be concentrations (West et al., 2011, 2014; Ma et al., 2010, 2013). While the rates of these two processes are equal within a factor of 2, some sediments are still retained in the catchment especially on the southern side toward the valley as the catchment appears to be moving toward a new steady state after the Last Glacial Maximum when the catchment experienced periglacial conditions.
Sample material for this study, further described below or in published papers, includes the major Li reservoirs in the catchment: bedrock, soils, stream sediments, groundwater, soil water, stream water and vegetation. The vegetation is represented by a composite leaf litter sample collected at several leaf litter traps distributed in the catchment (Herndon et al., 2015; Smith et al., 2017). Lithium concentration and Li isotopic composition of rock and soils were analyzed on well-investigated archived samples (sampling described in Jin et al. (2010)) from deep cores (DC1 and DC2) and from soil profiles from the southern planar transect along the north-facing hillslope (Fig. 2). Mineral and chemical composition of these samples were reported previously (Jin et al., 2010; Sullivan et al., 2016a).
9
Two samples were used to characterize the sediment carried by stream water: sample
“Weir” consists of sediments that were trapped behind a weir box installed at the outlet of the stream and sample “SSL” refers to the suspended sediment load collected by filtering stream water (20 L) to remove particles larger than 0.45 µm. Sample “SSL” was collected the 26th of May 2014 during the wet season during low discharge to obtain fine-grained suspended sediments rich in weathering products. Water samples include soil water from suction-cup lysimeters installed in nested sets at the southern planar transect (Jin et al., 2010), stream water, and groundwater from wells sampled between October 2013 and August 2014.
Groundwater wells are described in detail by Sullivan et al. (2016a). Additional water samples were taken from Shaver’s Creek, the stream into which the first-order stream at Shale Hills flows (Brantley et al., 2018).
3. Methods
3.1. Field measurements and element concentration measurements
Field parameters of water samples including pH, temperature (T), specific conductance (SPC), dissolved oxygen (DO), total dissolved solids (TDS) and oxidation reduction potential (ORP) were determined using a multi-parameter unit YSI Profession Series probe. All water samples including soil water from lysimeters were filtered using a Nalgene filter unit (0.45 µm Nylon filter). Cations including Al, Ca, Fe, K, Mg, Na, Sr, Mn, and Si were determined by inductively coupled plasma emission spectrometry (a Perkin-Elmer Optima 5300 ICP-AES). The analytical precision is about ± 3% for major elements and ± 10% for minor elements. Lithium concentrations were measured using a Thermo Fisher Scientific X Series 2, quadrupole inductively coupled plasma mass spectrometer (ICP-MS) with a precision of ± 5%. Precision was determined by long-term analyses of reference samples. The concentrations of the anions Cl-, NO3-, PO43-, and SO42- were determined by ion chromatography (Dionex Ion Chromatograph ICS-250). The dissolved organic carbon (DOC) content was determined by a total organic carbon (TOC) analyzer (Shimadzu TOC-VCPH). The chemical composition and the mineral composition of the investigated rock and soil samples are published in Jin et al. (2010).
Major and minor elements for suspended sediments were determined by ICP-AES after digestion as described in section 3.2.1.. Lithium concentrations were determined on digested bedrock, soil, and river sediment samples by ICP-MS. All concentration measurements were
10
performed at the Pennsylvania State University (U.S.A.) in the Laboratory for Metals and Isotopes in the Environment (LIME). The mineralogy of the suspended sediment load sample was investigated by X-ray diffractometry (XRD) (PANanalytical Empyrean X-Ray diffractometer) in the Material Characterization Laboratory (MCL) at the Pennsylvania State University (U.S.A.).
3.2. Lithium isotope measurements 3.2.1 Sample preparation
Between 100 and 300 mg of powdered rock and bulk soil (size fraction < 2 mm) were dissolved in a 1:3 mixture of concentrated HNO3 and HF in acid-cleaned Teflon vials on hotplates at 90°C. After 24 hours, 1 ml HClO4 was added to the mixture that was subsequently dried down at 120°C to a volume of ~ 1 ml. The vials were then capped and kept at 150°C overnight. After cooling, a mixture of concentrated HF and aqua regia was added to each vial and the closed vials were heated at 150°C overnight. Clear, particle-free solutions were finally evaporated at 150°C and subsequently fluxed with concentrated HNO3 at 90°C for 5 h. MilliQ water (18.3 M) was added to each vial and the samples were heated at 90˚C until solutions were clear and particle-free, at which point they were dried down completely. The mixed leaf litter sample was digested following the same steps after rinsing in MilliQ water and ultrasonication. Finally, samples were oxidized several times by adding and drying down a mixture of concentrated HNO3 and H2O2.
Filtered water samples were treated by evaporating sufficient volume in Teflon vials to obtain 100 to 200 ng Li. Samples were then oxidized several times in a mixture of concentrated HNO3 and H2O2 to remove organics prior to ion chromatographic purification of Li.
3.2.2 Ion exchange chromatography and Li concentration measurements
The method for Li purification was adapted from Rudnick et al. (2004) and involved a two-stage cation exchange chromatographic procedure. Columns (BioRad Poly-Prep Chromatography Columns) were filled with pre-cleaned Biorad resin AG® 50W-X12 resin (100- 200 mesh size) for both purification steps. To eliminate major elements, samples were loaded onto columns in 1.5 ml 0.15 M HCl and eluted with 30 ml 0.15 M HCl. The collected fraction was then evaporated and re-dissolved in 1 ml 0.15 M HCl prior to loading on the second
11
column, whose purpose was to separate Li from Na. The Li fraction was eluted with 16 ml of a mixture of 30% ethanol and 0.5 M HCl. Following Li elution, matrix elements were eluted by 10 ml of 6 M HCl and 10 ml MilliQ water. The resin was cleaned using 2.5 M HNO3, 6 M HCl and MilliQ water before columns were prepared for the next sample set.
The purity and yield of Li were checked by ICP-MS after column separation. Lithium concentrations were measured in both pre- and post-chromatography aliquots, and for the column cut collected after the Li cut from the second column. Yields were generally > 95%, and the cut collected after the Li cut contained < 3% of the total Li. A column yield of close to 100% is critical as Li isotopes fractionate significantly during exchange chromatography. To ensure purification, the post-chromatography Li fraction was analyzed for major cations, including Na, K, Mg, Fe, Ca and Al. The ratios of major elements to Li were ≤ 2. Samples with higher ratios, which occurred sporadically for Na/Li, were excluded from isotope analysis to ensure accurate results. Several rock standards, including AGV-2, RGM-1 and BCR-1 were digested, purified, and analyzed several times during the course of this study. The procedural blank, which was determined for each sample set and included all steps from digestion to ion exchange chromatography, was typical < 0.1 ng of Li (< 0.1% of sample Li).
3.2.3 Li isotope analyses
Lithium isotope ratios were measured on a ThermoFisher Scientific NeptunePlus multi- collector ICP-MS (MC-ICP-MS) at the Pennsylvania State University’s Metal Isotope Laboratory (MIL). All analyses were performed in low resolution mode (m/Δm > 2000, 5%) using a jet cone and a regular H-skimmer cone under dry plasma conditions (using an ESI APEX desolvation system; uptake rate ~120 µl/min). Standard and purified samples were measured in matching matrices of 0.3 M HNO3, typically at 30 ppb Li, that resulted in signal intensities between 7 and 10 V for 7Li on a Faraday cup equipped with a 1011 Ω resistor.
We applied a standard-sample-bracketing technique to correct for the instrumental mass bias and drift, and blank measurements were done just before and after each standard and sample. Standards and samples were measured for 25 cycles with an integration time of 4 s, whereas blank analyses (acid matrix only) consisted of 10 cycles integrated over 4 s. The typical Li background contributed less than 1% to sample (or standard) signal intensity. The take-up time was 180 s before the start of the measurement, and the wash-out time was 270
12
s. Each sample was analyzed a minimum of two times in at least two separate analytical sessions and were corrected for the Li background offline. All Li isotope ratios are reported in standard delta notation relative to the reference material LSVEC in permil units (‰):
𝛿 𝐿𝑖7 = ( 𝐿𝑖
7 ⁄6𝐿𝑖𝑆𝑎𝑚𝑝𝑙𝑒
7𝐿𝑖⁄6𝐿𝑖𝐿𝑆𝑉𝐸𝐶) ∗ 1000 (1)
Frequent measurements of the Li in-house standard AA (Li Alfa Aeser solution) were conducted, yielding 7Li values of 80.6 ± 0.9‰ (2SD, n=37) over the period of this study.
Analyzed rock standards reveal 7Li values, which are identical within uncertainties to previous published data (see overview in GeoReM database; Jochum et al., (2005)): BCR-1 (basalt) gives 2.2 ± 1.1‰ (2SD, n=3) (published values range between 2.0 and 3.0‰ giving an average of 2.4 ± 0.7‰ 2SD, n=11), RGM-1 (rhyolite) gives 3.3 ± 1.6‰ (2SD, n=3) (published values are 2.6 ‰ and 5.7‰) and two independent digestion and separation procedures for AGV-2 (andesite) gives δ7Li of 6.44 ± 1.4‰ (2SD, n=4) and δ7Li of 6.00 ± 2.2‰ (2SD, n=2) (published values range between 5.6 and 8.1‰ giving an average of 7.2 ± 1.7‰ 2SD, n=9).
In addition, we obtained 56Fe and 26Mg values for the suspended sediment load sample
“SSL” following the methods described in Mansor and Fantle (2019) and Chanda and Fantle (2017), respectively.
4. Results
4.1. Water chemistry
Sample locations, data from field measurements, and major and minor cation and anion geochemistry are summarized in Table 1 and are in agreement with previous studies.
Detailed investigations of the major rock-forming elements dissolved in the soil water, groundwater and stream water are discussed elsewhere (Jin et al., 2011; Sullivan et al., 2016a).
4.2. Chemical and mineralogical composition of suspended sediments
The chemical composition of suspended stream sediment sample “SSL” is as follows:
21.0 wt% Al2O3, 0.4 wt% CaO, 7.7wt% Fe2O3(t), 3.8 wt% K2O, 1.3 wt% MgO, 0.7 wt% TiO2, 132 ppm Li and 100 ppm Zr. The silicon content was not determined. X-ray diffraction reveals
13
17.1% quartz, 22.8% kaolinite, 52.8% illite, and 7.3% chlorite-like minerals including chlorite, vermiculite and HIV (Fig. 4). The concentration of the suspended sediment sample “SSL” in the stream water was 5 mg L-1 at the time of sampling.
4.3. Li concentration and isotopic composition
Lithium isotopic data and concentrations are presented in Table 1 and 2 together with an overview in Fig. 3. Shale samples from deep boreholes (n = 5) show little variability in Li concentration (83 ± 3 ppm Li, 1 SD) with one exception from shallow depth (sample DC1-8 from depth interval 1.1 to 1.2 m in well DC1 has 103 ppm). The Li isotopic compositions of these deep shale samples (n=3) show a narrow range in δ7Li with values between -1.6‰ and 0.4‰. Compared to shale, soil samples exhibit a lower Li content, i.e., between 38 and 91 ppm, but similar δ7Li values, between -1.1 and 2.2‰. Streambed and suspended sediments (samples “Weir” and “SSL”) reveal a Li content of 78 and 132 ppm, respectively and δ7Li values of 0.8 and -0.3‰, respectively. Lithium content of the composite leaf litter sample was very low, 150 ppb, and yielded a δ7Li value of -2.6‰. Compared to the bedrock, soils and stream sediments, all investigated water samples are enriched in 7Li with aqueous δ7Li (δ7Liaq) values ranging between 14.5 and 40.0‰ with lower values for most groundwater samples. Aqueous Li concentration ([Li]aq) of groundwater ranges from 0.59 to 0.86 µmol L-1 for deeper groundwater (CZMW1 and well#6) and from 0.10 to 0.17 µmol L-1 for shallower groundwater (CZMW6 and well #11), respectively. Water from the soil zone (soil water) and the headwater of the stream show low [Li]aq between 0.03 and 0.06 µmol L-1. Stream water at the outlet of the catchment and water from Shaver’s Creek reveal [Li]aq between 0.05 and 0.12 µmol L-1. In addition, we determined 56Fe and 26Mg values for the suspended stream sediment sample SSL, which are 0.10‰ and 0.36‰, respectively.
5. Discussion
The objective of this study is to constrain the dominant controls on Li isotopic fractionation and on Li elemental chemistry during shale weathering. The results, which are discussed in detail below, suggest that Li cycling and isotopic fractionation during shale weathering are dominated by clay transformations. The primary observation is that aqueous Li released from the shale catchment under consideration is isotopically fractionated at the watershed scale relative to bedrock, exhibiting a significant range in 7Liaq from 14.5‰ to
14
39.4‰. In fact, the range of 7Liaq values in this small catchment is more than half of the variability measured in rivers globally (~1‰ to ~44‰ with a weighted average of ~23‰; Huh et al., 1998; Hindshaw et al., 2019a). In contrast, the isotopic compositions of soils and stream sediments are similar to that of the bedrock.
The following discussion focuses on the role of clay transformation processes in affecting the Li isotopic composition of both surface and groundwater at Shale Hills, emphasizing the retention of Li in the solid weathering products in controlling the 7Li of both aqueous Li and Li in secondary minerals. Mass balance approaches are used to quantify Li elemental depletion at the catchment scale via aqueous and particle export driven by chemical and erosional weathering processes. Ultimately, we propose that much of the Li is lost as subsurface fluxes of clay particles at Shale Hills (Jin et al., 2010; Bern and Yesavage, 2018;
2019; Kim et al., 2018; 2019).
5.1. Mechanistic controls on the Li isotopic composition of aqueous Li
We sampled the first-order stream that drains out of Shale Hills (catchment size 0.08 km2) and the creek into which it flows (Shaver’s Creek, catchment size 165 km2 (Fig 2)). The water chemistry and 7Liaq in Shaver’s Creek match those of stream and shallow groundwater (Fig. 6, 7) for Shale Hills. In this section we seek to understand why we observe such a large range in 7Liaq in water samples.
Interaction of silicate minerals with water is generally considered to control Li isotopic fractionation and 7Liaq, as biological effects are negligible (Lemarchand et al., 2010; Clergue et al., 2015). Clay minerals, which are abundant in shales, have relatively high Li concentrations (~100 ppm) and can be reactive during weathering (Teng et al., 2004; Chan and Hein, 2007; Jin et al., 2010). Other silicates in shale contain little Li, are low in abundance (such as feldspar), or are highly resistant to weathering (such as quartz).
Several studies have shown that isotopic fractionation between aqueous Li and secondary minerals depends primarily on the site of Li within the structure rather than on mineral composition (Pistiner and Henderson, 2003; Williams and Hervig, 2005; Chan and Hein, 2007; Vigier et al., 2008; Wimpenny et al., 2015; Fairén et al., 2015; Dupuis et al., 2017;
Hindshaw et al., 2019a; Li and Liu, 2020). Recently, an experimental study by Hindshaw et al.
15
(2019a) investigated isotopic fractionation between a Mg-rich smectite (2:1 layer silicate) and aqueous Li in detail and disclosed specific isotope fractionation factors (7Lisolid-aq) associated with three different bonding environments of Li in clay minerals: 1) -21.5‰ for structurally bound, strong inner-sphere Li complexes at octahedral sites, 2) -0.2‰ for Li as weak outer- sphere complexes (i.e. as exchangeable Li at interlayer sites or at adsorption sites on clay mineral surfaces) and 3) +15.0‰ (with a large uncertainty) for the small amounts of Li occupying the cavities in tetrahedral sites that provide bonding similar to octahedral sites.
Because of the large uncertainty of the degree of fractionation and the small amount Li at this bonding site, we will not further discuss #3. Remarkably, the large fractionation identified in
#1 is also observed for hydrated Li adsorption on Fe-oxides (7LiFe-oxides-aq ≈ -20‰) (Pistiner and Henderson, 2003; Chan and Hein, 2007; Wimpenny et al., 2015; Fairén et al., 2015). This is likely because such adsorption forms strong bidentate inner-sphere complexes with terminal oxygen ions. A recent experimental study suggests that both types of Li sorption, #1 and #2, are important on kaolinite surfaces leading to an intermediate fractionation factor (7Likaolinite- aq ≈ -8‰; Li and Liu, 2020).
At Shale Hills, many of these reactions could occur, albeit associated with distinct reaction fronts within the weathering zone. Specifically, groundwater elemental and isotopic compositions are affected by reaction fronts that vary in depth from oxidative weathering of chlorite to form vermiculite and Fe-oxides and of pyrite to form Fe-oxides, dissolution of carbonates, and plagioclase dissolution followed by kaolinite formation (e.g., Brantley et al., 2013; Fig. 3a, Fig. 5). A significant contribution to aqueous Li from carbonate dissolution is unlikely because of the low Li concentration in carbonate (~ 5 ppm) and the low abundance of CaCO3 in the shale bedrock (<< 10 wt%; Jin et al., 2010) compared to clay minerals (~ 100 ppm Li and 70 wt%, respectively). In addition, a high contribution from carbonate dissolution would promote low Li/Ca ratios and high 7Liaq values in groundwater because carbonates carry a seawater-like Li isotopic composition (7Liseawater = 30.8‰; Marriott et al., 2004; Rosner et al., 2007; Lechler et al., 2015; Pogge von Strandmann et al., 2013).
If carbonates are not important in the Li system at Shale Hills, then Li mobilization is likely controlled by silicate weathering. In the watershed, chlorite weathers to vermiculite and then eventually precipitates kaolinite and Fe-oxide (Fig. 5). In chlorite, a “2:1:1” clay mineral with a low cation exchange capacity, Li mainly occupies octahedral sites. Transformation to
16
the “2:1” clay mineral vermiculite involves the preferential dissolution of weaker Mg-rich octahedral layers, i. e. “brucite" layers, leading to the release of Fe and Mg together with Li and a slight loss of Al (Wilson, 2004). Lithium release during such mineral dissolution is likely not associated with isotopic fractionation because mineral dissolution generally does not cause fractionation (Pistiner and Henderson, 2003; Wimpenny et al., 2010; Verney-Carron et al., 2011). Lithium can also associate with vermiculite because it has a higher cation exchange capacity (Fig. 5) than chlorite. However, exchange between hydrated Al and Mg and Li in the interlayer sites as outer-sphere complexes does not cause isotopic fractionation because the bonding is weak (Hindshaw et al., 2019a). Thus, even though chlorite oxidation is a dominant silicate weathering process in Shale Hills, it is unlikely to control the high 7Liaq values observed in groundwater.
In contrast to vermiculitization of chlorite, the eventual formation of Fe-oxide and kaolinite as chlorite weathering proceeds may lead to high 7Liaq values. This is because adsorption of hydrated Li onto Fe-oxide and kaolinite is associated with strong isotopic fractionation (7LiFe-oxide-aq ≈ - 20%; 7LiKaolinite -aq ≈ - 8%; Wimpenny et al. 2010; Li and Liu, 2020) (Fig. 5). Iron-oxides occur as a product of chlorite weathering and pyrite oxidation at almost all depths where these reactions have commenced at Shale Hills (Jin et al., 2010; Sullivan et al., 2016a; Gu et al., 2020) and could thus play a prominent role for Li isotopic fractionation in almost all waters. On the other hand, Li fractionation caused by association with kaolinite likely only becomes a prominent reaction in shallow groundwater (interflow) because kaolinite is generally only observed in the upper 5-8 m or so of the subsurface (Brantley et al., 2013). Given these considerations, the only major chemical reactions that fractionate Li isotopes in this setting are adsorption of hydrated Li on kaolinite at shallow depths and Fe- oxyhydroxide mineral surfaces at even deeper depths. Notably, such newly formed secondary minerals are likely to be poorly crystalline with a small grain size, and this is likely to increase the number of potential sorption sites.
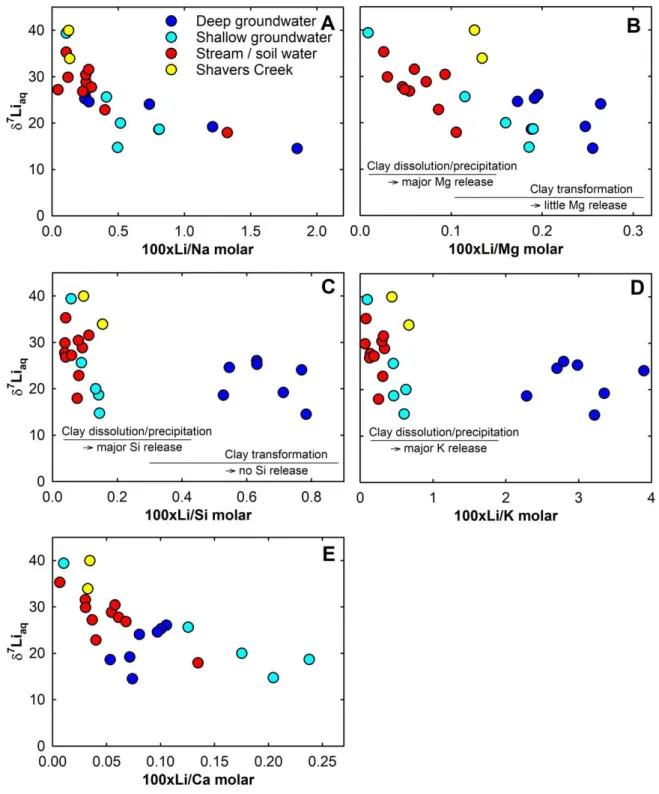
Overall, the water chemistry is consistent with these mineral reactions. In near-surface water from the soil and interflow zone, low Li/Mg, Li/Si and Li/K ratios and variable 7Liaq
values are in line with clay dissolution/transformation and the preferential uptake of Li by neoformed kaolinite or Fe-oxides (Fig, 6b, c, d). In contrast, deep groundwater generally shows higher Li/Mg, Li/Si and Li/K ratios and more stable 7Liaq values, consistent with ongoing clay
17
transformation processes. In the following we examine how these weathering reactions and isotopic fractionation mechanisms are reflected in the Li isotopic composition and chemistry of aqueous Li at Shale Hills.
Typically, the Li isotopic composition and the Li/Na ratio in water samples show an inverse correlation (Fig. 6a). Given that Na is largely released from the (Na,Ca)-containing plagioclase feldspar in this watershed (Jin et al., 2010), it is also not surprising that there is a similar correlation for Li/Ca for stream and shallow interflow groundwater (Fig. 6e). Lithium has an affinity for uptake by secondary minerals whereas Na and Ca are more unreactive following release to solution. At Shale Hills, near-surface waters from the soil zone and interflow are characterized by highly variable 7Liaq values up to 39.4‰ and low Li/Na ratios.
These two characteristics also describe the stream waters because the stream is dominated by interflow water during most of the year (Jin and Brantley, 2011; Sullivan et al., 2016a). In contrast, deep groundwater has a longer residence time (up to 30 years; Sullivan et al, 2016a) and shows lower, less variable 7Liaq values and high Li/Na (Fig. 6a).
Such patterns between Li isotopic composition and aqueous Li concentrations and residence time have been observed in other catchments and linked to formation of
secondary minerals over time or to the kinetic- or supply-limited nature of the weathering system (Huh et al., 1998, 2001; Kisakürek et al., 2005; Vigier et al., 2009; Millot et al., 2010b;
Pogge von Strandmann et al., 2006, 2014, 2017b; Dellinger et al., 2015; Liu et al., 2015). In large river systems such as the Amazon, Mackenzie, and Brahmaputra-Ganges basins, for example, low 7Liaq values are observed in supply-limited systems – i.e. systems where waters and solids in soil have long residence times that enable intensive interaction of water with primary and secondary silicate minerals - whereas high 7Liaq values are observed in kinetically-limited systems – i.e. systems where waters and solids in soil have relatively short residence times, which limits interaction (Millot et al., 2010b; Dellinger et al., 2015; Henchiri et al., 2016). The basic idea is that isotopic fractionation relative to bedrock is observed when the water-rock interaction times are long enough to permit Li uptake into secondary minerals but also short enough to prevent slow re-dissolution of those minerals. These conditions apply for Shale Hills which lies in the range of medium weathering intensities and represents the conditions in Figure 1 that lead to low aqueous Li flux but high values of
7Liaq.
18
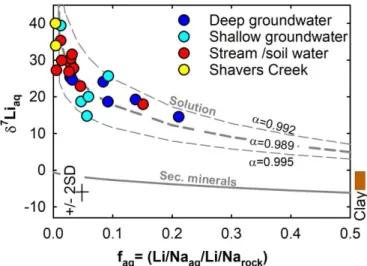
This relationship between Li concentration and isotopic composition can be quantified to test the hypothesis that Li adsorption at interlayer sites of clay minerals can affect aqueous Li concentrations but not Li isotopic composition while Li adsorption on new mineral surfaces (kaolinite and Fe-oxyhydoxide) can drive the isotopic fractionation of aqueous Li (Fig. 5). To do this, we estimate the proportion of Li remaining in solution relative to the Li incorporated into secondary minerals. Assuming that the initial Li/Na ratio (Li/Naaq,init) of the fluid reflects that of the bedrock, and that Na behaves conservatively, the fraction of Li remaining in solution after secondary mineral formation, faq, can be estimated by considering the Li/Na ratio of the aqueous species (Li/Na)aq relative to the ratio in the bedrock, (Li/Na)rock (Fig. 7) (e.g., Millot et al., 2010b):
𝑓𝑎𝑞 = (𝐿𝑖 𝑁𝑎⁄ )𝑎𝑞,
(𝐿𝑖 𝑁𝑎⁄ )𝑎𝑞,𝑖𝑛𝑖𝑡 ≈ (𝐿𝑖 𝑁𝑎⁄ )𝑎𝑞
(𝐿𝑖 𝑁𝑎⁄ )𝑟𝑜𝑐𝑘 (2)
The equation is meant to describe chlorite reactions that take place over the same depths as plagioclase weathering, i.e., in the interflow zone from 0 to about 9 m depth. This generalized approach has been widely applied in various river studies (e.g., Gislason et al, 1996) and is therefore used here to provide an estimate for faq that is comparable to those in the literature (where very little is known about subsurface reaction zones).
The values of faq calculated at Shale Hills are low (< 20 %), consistent with the inference that most Li is incorporated into secondary minerals. This overall high degree of Li retention in the solid phase correlates with the isotopic compositions of clays and stream sediments. It is also interesting to note that these ratios are consistent with global average riverine flux estimates for Li: 20% as aqueous and 80% as particulate flux, respectively (Vigier and Godderis, 2015). Finally, groundwater shows a tendency to a higher fraction of aqueous Li (up to 20%) whereas stream and water from the soil zone reveal extremely low faq (< 5%). Thus, there is more retention of Li in solid phases during weathering in the shallow layers where both Fe- oxide and kaolinite are present. However, the relationship in 7Liaq-faq space is non-linear for the data from Shale Hills (Fig. 7), which has been also observed in other catchment studies including large river systems (e.g., Amazon, Ganges, Brahmaputra and Columbia Rivers) where data show similar non-linear trends (Kisakürek et al., 2005; Vigier et al., 2009; Pogge von Strandmann et al., 2006, 2010; Bagard et al., 2013; Dellinger et al., 2015; Liu et al., 2015). Most
19
of the non-linear trends are reported for terrains where weathering is kinetically-limited (like Shale Hills).
Non-linear trends in 7Liaq are commonly assessed using simple Rayleigh distillation models (e.g., Bagard et al., 2015; Bouchez, 2013; Dellinger et al., 2015; Pogge von Strandmann et al., 2012; Pogge von Strandmann et al., 2017a) or in some cases by more complex reactive transport models (e.g., Liu et al., 2015; Lemarchand 2010). Here, we constructed a box model to explain, in particular, this non-linear behavior of 7Liaq values and compare the results later on with a simple Rayleigh distillation approach. The box model allowed us to examine the interplay between mineral dissolution, solute advection, and Li removal from pore fluid by secondary mineral formation. The model considers silicate dissolution as the only Li source and major secondary mineral formation processes as Li sinks including Li removal by vermiculite/HIV at interlayer sites, and kaolinite precipitation for near-surface water (stream and shallow groundwater) and Fe-oxide precipitation for deep groundwater (see model schematics in Fig. 8a, b). We assumed dissolving clays have an isotopic composition of -2.5‰, and that dissolution does not fractionate Li isotopically; the dissolution rate was held constant at a value of 3.2·10-7 µmol Li d-1 (based on mineral dissolution rates, specific surface areas, and molar masses of clays at Shale Hills; Jin et. al., 2010). The removal of Li by secondary minerals did fractionate isotopically (interlayer-aq = 0.9998, kaolinite-aq = 0.992, Fe-oxide-aq = 0.980 (Wimpenny et al., 2010; Hindshaw et al., 2019a; Li and Liu, 2020), and the output fluxes were assumed to be first order with respect to Li pore fluid concentration (i.e., mass flux, F = k*Npf, see Fig. 8).
Because the rate constants are unknown, we ran a series of simulations (100 to 250) to steady state, while varying the rate constants over ranges (i.e., assuming uniform distribution) and sampling using a Sobol Sequence routine (see caption of Fig. 8 for details).
Because we did not know the precise residence time of fluids, we also varied the residence time between 5 and 20 years. The result of this approach was the generation of steady state solution envelopes for a given model scenario in a 7Liaq-Li concentration space (Fig. 8a, b).
Outside of this envelope, steady state solutions are not possible for a given scenario. A benefit of this approach is that it clearly illustrates endmember scenarios (e.g., dissolution- dominated, clay-sink dominated) and gives a general sense of the likelihood of a particular scenario occurring.
20
The modeling suggests that in scenarios in which the sinks dominate (left hand side of Fig. 8a, b), 7Liaq can vary quite widely but the steady state values do not surpass ~18‰. Yet almost all the fluids measured at Shale Hills plot significantly above the steady-state envelopes. Thus, as long as the fractionation factors we assume are appropriate, the fluids measured at Shale Hills cannot reflect steady state.
Accordingly, we suggest that our 7Liaq and Li concentration measurements reflect transient conditions in the sub-surface system, which is supported by time-dependent model trajectories (Fig. 8c and d). Amongst the parameters that determine the position of these trajectories in 7Liaq-Li concentration space are the initial 7Liaq and Li concentration of the fluid. For the trajectories shown here, we can explain deep groundwater and near-surface waters assuming an initial Li concentration of ~2 to 4 µM and an initial 7Liaq value of -2.5‰.
Seen through this lens, deep groundwater can be explained as less evolved fluids whose differences are explained by changes in fluid residence time and modest differences in the relative importance of the oxide and clay sinks (Fig. 8c). By contrast, near-surface water with exceedingly high 7Li values must be dominated by fractionation associated with kaolinite precipitation. Interestingly, these high 7Liaq are not the most evolved fluids in the system; if this framework is correct, those fluids with values closer to the steady state envelope are actually the most evolved.
Our interpretation is consistent with the seasonal variation in 7Liaq; in the spring, lower 7Liaq values occur as a consequence of reduced secondary mineral formation (Giesler et al., 2000; Wilson, 2004; Andrews et al., 2011). In the summer, kaolinite precipitation increases (Sullivan et al., 2019), which generates high, variable 7Liaq values. By comparison, deep groundwater is more homogenous isotopically, is impacted to a lesser extent by secondary minerals (Fig. 7), and is generally less evolved compared to near-surface water.
Increased 7Liaq values (e.g., in deep groundwater sampled at the stream outlet, CZMW1) are also compatible with previous suggestions that hydrological changes in flow pathways increase residence times of groundwaters during the summer (Sullivan et al., 2016). Overall, the box modeling supports the contention that the Li isotopic composition of stream and groundwater is impacted by significant retention of Li in the solid phase (Fig. 7). Interestingly, if our assumptions are valid, the model suggests that steady state conditions are rarely achieved in this system, even in groundwater that ostensibly has long residence times.
21
Instead, 7Liaq is a time-dependent phenomenon that is controlled primarily by the relative rates of Li removal into secondary minerals.
5.2. The loss of particulate Li in the soil zone
Measured 7Lisoil values of bulk soil samples range between -0.6 and 2.2‰ with an average of 0.5 ± 1.2‰ (1 SD). These values are similar to but slightly higher than those of bedrock (average 7Lirock = -0.6‰) and are in the range of typical shales, which have a high proportion of structurally bound Li (7Lishale ranges between -4.1 and 4.3‰) (Teng et al., 2004;
Romer and Meixner, 2014; Williams et al., 2015; Phan et al., 2016; Hindshaw et al., 2018).
The higher 7Lisoil values compared to 7Lirock are surprising because chemical weathering is expected to drive weathering residuals to lower 7Li values. However, the mineral composition of soil profiles show that secondary mineral phases are increasingly diluted with weathering resistant quartz moving upwards in the soil profile (Fig.4; Jin et al., 2010). Quartz differs significantly in Li isotopic composition (7Liquartz ≈ 30‰; Sauzeat et al., 2015) compared to secondary minerals, explaining why the isotopic composition of bulk soils at Shale Hills moves toward high 7Lisoil values toward the land surface. Using a simple mass balance approach for soils and suspended sediments and bedrock, we estimate the isotopic composition, 7Liclay, and the Li concentration, [Li]clay, of the fraction containing clays and oxides. To do this, we use the relative mineral abundances m (Jin et al., 2010) and the isotopic composition and Li concentration of bulk samples, 7Libulk and [Li]bulk, respectively (Table 2) while assuming the Li isotopic compositions and concentrations for quartz and feldspar are as compiled by Sauzeat et al. (2015), i.e., representative of the upper continental crust (7Liquartz
= 30‰; [Li]quartz = 10 ppm and 7Lifeldspar = 2.5‰; [Li]feldspar = 2 ppm). The fraction of Li contributed from each mineral phase (mLi,clay, mLi,feldspar and mLi,quartz) is defined by the relative mineral abundance and the Li concentration of the mineral phase. The calculation was completed using Equations (4) and (5):
[𝐿𝑖]𝑏𝑢𝑙𝑘 = 𝑚𝑐𝑙𝑎𝑦[𝐿𝑖]𝑐𝑙𝑎𝑦+ 𝑚𝑞𝑢𝑎𝑟𝑡𝑧[𝐿𝑖]𝑞𝑢𝑎𝑟𝑡𝑧+𝑚𝑓𝑒𝑙𝑑𝑠𝑝𝑎𝑟[𝐿𝑖]𝑓𝑒𝑙𝑑𝑠𝑝𝑎𝑟 (4) 𝛿7𝐿𝑖𝑏𝑢𝑙𝑘 = 𝑚𝐿𝑖,𝑐𝑙𝑎𝑦𝛿7𝐿𝑖𝑐𝑙𝑎𝑦+ 𝑚𝐿𝑖,𝑞𝑢𝑎𝑡𝑧𝛿7𝐿𝑖𝑞𝑢𝑎𝑟𝑡𝑧+𝑚𝐿𝑖,𝑓𝑒𝑙𝑑𝑠𝑝𝑎𝑟𝛿7𝐿𝑖𝑓𝑒𝑙𝑑𝑠𝑝𝑎𝑟 (5)
22
These calculations reveal average 7Liclay and [Li]clay values of -5.2‰ and ~92 ppm, respectively, for ridge top soils, both lower than the values for the valley floor soils (7Liclay and [Li]clay are -1.8‰ and 123 ppm, respectively) (Table 2). Thus, the valley floor clay fraction is similar to bedrock (average 7Liclay = -2.0‰; [Li]clay = 121 ppm) (Table 2, Fig. 9a) whereas the clay fraction of the ridgetop soil is comparatively depleted in the heavy nuclide. Below, we discuss Li depletion profiles in the soils, followed by a discussion in differences in 7Liclay and [Li]clay as a function of hillslope position.
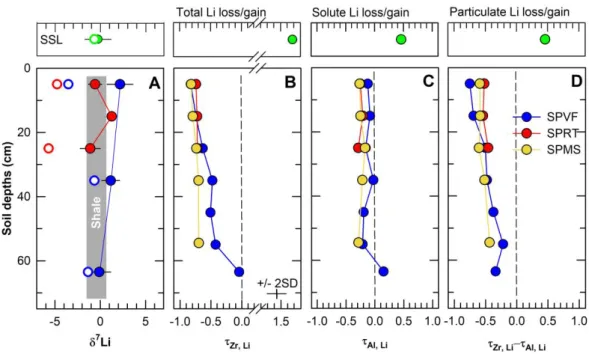
Elemental ratios in soil profiles and stream sediments are one way to quantify loss or gain of an element. Specifically, the loss or gain of Li relative to the source material can be quantified by calculating the non-dimensional mass transfer coefficient τi,j (Brimhall and Dietrich, 1987; Chadwick et al., 1990; Anderson et al., 2002):
𝜏𝑖,𝑗 =𝐶𝑗,𝑤𝐶𝑖,𝑝
𝐶𝑗,𝑝𝐶𝑖,𝑤− 1 (6)
This concept is based on the ratio of the concentrations C of a mobile element j and an immobile element i defined for weathered material w and unweathered parental material p.
The element j is depleted compared to the immobile element in weathered material compared to parental material for τ < 0 and enriched for τ > 0, e.g. by adding material to the weathering profile. There is neither depletion nor enrichment for τ = 0. The mobility of major elements relative to the source rock in Shale Hills soil profiles has been previously investigated (Jin et al., 2010; Kim et al., 2018), where Zr has been suggested as an adequate immobile element. Recently, it has been pointed out that much of the loss of major elements from Shale Hills soils at depths may be caused by loss of particles and not by loss of solutes (Kim et al., 2018). To investigate this, it has been proposed that another version of τ can be defined using Al as the immobile element because it is assumed to be largely retained in clay minerals (Jin et al., 2010; Hasenmueller et al., 2017; Kim et al., 2018). In effect, when Zr,j and Al,j < 0, Zr,j
can be thought of as the fractional loss of element j as both particles and solutes, while Al,j
can be thought of as the fractional loss of element j as solute alone.
Thus, values of τZr,Li allow estimation of the total Li depletion in soil whereas τAl,Li can provide an estimate for the chemical weathering loss of Li. The difference between τZr,Li and τAl,Li provides an estimate of Li mobility via particle transport out of the soil profile
23
(Hasenmueller et al., 2017; Kim et al., 2018). Although exact values are somewhat dependent on assumptions in the calculation related to immobility of Zr (Bern and Yesavage, 2018), we calculated τZr,Li and τAl,Li based on the Li concentrations provided in Table 2 and the Zr and Al concentrations published in Jin et al. (2010). Soil profiles reveal a total loss of Li between 20 and 80% depending on soil position and sample depth (Fig. 9b) (τZr,Li : -0.21 to -0.81). However τAl,Li values indicate that only around 20% of the Li was lost as aqueous Li from the soils at the ridge top (average τAl,Li: -0.21) whereas barely any chemical weathering loss is needed to explain the data for the valley floor (average τAl,Li : -0.03) (Fig. 9c). The interpretation is that about 50% of Li is lost via particle export from within the profiles of the ridge top soils whereas up to 75% of the mobilized Li is lost by particles in the valley floor (Fig. 9d).
These calculations and observations lead to explanations for the observed pattern of isotopic fractionation and Li elemental depletion in soils within the catchment. Interestingly, the data for soils along the south planar transect show that 7Liclay correlates with [Li]clay, soil pH, the ratio of Al to cation exchange capacity (CEC) (Jin et al., 2010), and τAl,Li values (Fig. 10).
Specifically, higher soil pH values (> 4.5) are observed in lower elevation soils compared to ridge top soils (pH < 4.5) (Jin et al., 2010). The low [Li]clay calculated in the ridge top soils may therefore be related to soil pH. At low pH, Al3+ becomes the dominant cation on exchangeable interlayer sites of vermiculite/HIV (high values of Al/CEC) (Jin et al., 2010). Thus the ridgetop soils have likely released Mg, Ca and Li from exchange sites, leaving behind strongly bonded Li at octahedral sites that are enriched in the light nuclide (Hindshaw et al., 2019a), i.e., low
7Liclay values. In the higher pH valley soils, the lower value of Al/CEC translates to a higher capacity for adsorption of Mg and Ca and Li. This explains the higher [Li]clay in soil at the valley floor compared to those of the ridges. No isotopic fractionation is associated with Li uptake into interlayer sites (Hindshaw et al., 2019a), but adsorption of Li from isotopically fractionated soil water increases 7Liclay in soils. In summary, the availability of exchangeable interlayer sites for Li in vermiculite/HIV mainly controls 7Liclay of the soil clays at Shale Hills.
The same effect has been proposed for Mg isotopes at SSHCZO: 26Mg of soils is impacted by Mg uptake from isotopically fractionated soil water into vermiculite/HIV (Ma et al., 2015). This process is also consistent with B isotope data of soils and soil water at Shale Hills (Noireaux et al, 2014; in press). This conformity is not surprising because Mg, Li, and B favor similar bonding sites during clay formation. Remarkably, the isotopic compositions of
24
water and bulk soil/soil clays are driven by distinct processes. Although kaolinite and Fe-oxide precipitation govern 7Liaq, these processes have little influence on 7Liclay or on bulk soil isotopic composition because two effects make isotopic fractionation barely recognizable in the solid phase: i) the high affinity of Li to kaolinite and Fe-oxides and its nearly quantitative uptake from solution and ii) the low abundance of these mineral phases. Instead, the isotopic composition of soil clays is controlled by the availability of interlayer sites in the clay structure providing sites for uptake of isotopically heavy pore water. At the same time, however, bulk soil chemistry is dominated increasingly by weathering resistant quartz grains with positive
7Li compared to parental rock as clay particles have been transported away (Jin et al., 2010).
Similar to this observation, Mg and B isotopic compositions of bulk soils are also controlled by loss of clay particles with a distinct isotopic signature (Ma et al., 2015; Noireaux et al., 2014;
in press).
In general, elemental depletion on the catchment-scale is controlled by both aqueous and particle transport through the subsurface. At the ridge top, ~20% of Li has been lost as aqueous Li and ~50% by subsurface particle transport (Fig. 9). Some of this material is moved downslope (both as aqueous Li and particles). In the valley floor, aqueous Li re-equilibrates with the ion exchange sites in the solid-phase (vermiculite/HIV), resulting in a net aqueous flux out of the valley floor soils that is near-zero (Al, Li close to zero; Fig. 9c). Depletion of Li occurs almost exclusively by particle transport from the valley floor (Zr, Li ≈ (Zr, Li -Al, Li); Fig.
9b, d). Therefore, the soils retain most of the Li in the solid phase in the valley floor soils, only releasing a small fraction of Li-containing illite and kaolinite particles (Fig. 4 and 9). The extent of Li elemental depletion by particle export from the soils correlates with weathering duration (Ma et al., 2013) which suggest continuous particle loss with time (Fig. 11). However, the depletion by particles does not reach zero at time zero (Fig. 11) nor at the base of the soil zone (Fig. 9d), indicating that particle export also occurs below the soil zone in underlying bedrock as suggested by Kim et al. (2018).
These findings are in agreement with values of major elements in soil profiles and deep cores, geochemical investigations of mobile particles in groundwater and stream water (Lin et al., 2006; Jin et al., 2010; Yesavage et al., 2012; Bern and Yesavage, 2018; Kim et al., 2018) and the fact that U-series show no secular equilibrium at the base of soils (Ma et al., 2013). These studies suggest that micron-sized particles are transported in the subsurface
25
along preferential water flow pathways through macro-pores as well as through fractured bedrock down to a depth of about 5 to 8 meters. Investigations of mobile particles from groundwater and stream water shows that these particles differ chemically and mineralogically from average bulk shale in that they have a higher proportion of illite (Kim et al., 2018). Therefore, depletion of Li via particle export is in agreement with the discovery by other researchers that subsurface erosion by selective clay particle mobilization in soil and weathering rock substantially contributes to element depletion and results in changes in the rock and soil chemistry at Shale Hills (Jin et al., 2010; Bern and Yesavage, 2018; Kim et al., 2018). Moreover, this finding of subsurface erosion of clay particles in shale might support conditions which promote maximum values of 7Liaq in the relationship between weathering intensity and the degree of isotope fractionation of aqueous Li (Fig. 1) (Bouchez et al., 2013;
Dellinger et al., 2015; Rugenstein et al., 2019). In other words, Shale Hills is a case where a high rate of secondary mineral formation followed by particle loss in the subsurface before re-dissolution results in a low aqueous Li flux with high 7Liaq values. Shale Hills shows that shale-dominated landscapes operate like floodplains as shown in the figure 1.
5.3. Aqueous and particulate export of Li in the catchment 5.3.1. Quantifying aqueous versus particulate export
We can compare depletion fluxes of Li on the catchment-scale calculated from the soil profiles to mass balance estimates for the entire catchment. To do this we make the simplifying assumption that the rate of production of Li-containing regolith equals rate of loss of Li-containing regolith (Ma et al., 2010, 2013; West et al., 2013, 2014). Then, the particle flux XLi, part can be estimated from the aqueous flux XLi,aq and the total Li flux out of the system which has to be equal to the Li flux from rock entering the weathering zone XLi rock at steady state (Fig. 12):
𝑋𝐿𝑖,𝑝𝑎𝑟𝑡 = 𝑋𝐿𝑖,𝑟𝑜𝑐𝑘− 𝑋𝐿𝑖,𝑎𝑞 (7)
where XLi, rock is calculated from the product of the area-weighted average soil production rate P of 31.9 m Myr-1 (West et al., 2013, 2014), the rock density, ρrock, of 2.6 g cm-3 (Jin et al., 2010), and the average Li concentration in bedrock [Li]rock of 83 ppm:
𝑋𝐿𝑖,𝑟𝑜𝑐𝑘 = 𝑃 𝜌𝑟𝑜𝑐𝑘 [𝐿𝑖]𝑟𝑜𝑐𝑘 (8)