fmars-07-603447 November 23, 2020 Time: 15:11 # 1
ORIGINAL RESEARCH published: 27 November 2020 doi: 10.3389/fmars.2020.603447
Edited by:
Marlen Ines Vasquez, Cyprus University of Technology, Cyprus Reviewed by:
William Cooper, Florida State University, United States Quan Shi, China University of Petroleum, China
*Correspondence:
Teresa S. Catalá teresa.catala@uni-oldenburg.de
Specialty section:
This article was submitted to Marine Biotechnology, a section of the journal Frontiers in Marine Science
Received:06 September 2020 Accepted:26 October 2020 Published:27 November 2020
Citation:
Catalá TS, Rossel PE, Álvarez-Gómez F, Tebben J, Figueroa FL and Dittmar T (2020) Antioxidant Activity and Phenolic Content of Marine Dissolved Organic Matter and Their Relation to Molecular Composition.
Front. Mar. Sci. 7:603447.
doi: 10.3389/fmars.2020.603447
Antioxidant Activity and Phenolic
Content of Marine Dissolved Organic Matter and Their Relation to
Molecular Composition
Teresa S. Catalá1* , Pamela E. Rossel1, Félix Álvarez-Gómez2, Jan Tebben3, Félix L. Figueroa2and Thorsten Dittmar1,4
1ICBM-MPI Bridging Group for Marine Geochemistry, Institute for Chemistry and Biology of the Marine Environment (ICBM), University of Oldenburg, Oldenburg, Germany,2Department of Ecology, Faculty of Sciences, Malaga University, Malaga, Spain,3Alfred Wegener Institute Helmholtz Centre for Polar and Marine Research, Department of Ecological Chemistry, Bremerhaven, Germany,4Helmholtz Institute for Functional Marine Biodiversity, University of Oldenburg, Oldenburg, Germany
The potential of marine dissolved organic matter (DOM) for free radical scavenging has been extensively evaluated, however, the quantitative assessment of the antioxidant potential has been recently measured for the first time. The linkage of the DOM antioxidant potential to its molecular composition has not yet been examined. Following this line, this article takes a step forward by assessing, throughout a polarity-mediated fractionation, (1) the antioxidant capacity and phenolic content and (2) the molecular characterization of DOM in a more exhaustive manner. (3) The DOM antioxidant potential and phenolic content was linked to the molecular composition of DOM, which was molecularly characterized using ultrahigh resolution Fourier transform Ion Cyclotron Resonance mass spectrometry (FT-ICR MS). Antioxidant activity and phenolic content were quantified by the free radical 2,2’-azino-bis-3-ethylbenzothiazoline-6-sulfonic acid (ABTS·) and the Folin-Ciocalteu methods, respectively. We considered three types of different natural DOM samples: the deep North Pacific Ocean, the oligotrophic surface of the North Pacific Ocean and porewater from the sulfidic tidal flats of the Wadden Sea. Bulk porewater and its individual polarity fractions presented the highest antioxidant activity and phenolic content. DOM from the water column samples had lower antioxidant activity and phenolic content than porewater, but exceeded what it is commonly found in macroalgae, microalgae, fruits and vegetables with cosmeceutical purposes. Our values were similar to published values for terrestrial DOM. The variations in bioactivity were dependent on polarity and molecular composition. The high resolution and high mass accuracy used to determine the molecular composition of marine DOM and the chemometric and multistatistical analyses employed have allowed to distinguish molecular categories that are related to the bioactive potential. As a future perspective, we performed cytotoxicity tests with human cells and propose marine DOM as a natural ingredient for the development of cosmeceutical products.
Keywords: marine dissolved organic matter, antioxidant activity, phenolic content, FT-ICR MS, molecular composition, natural ingredient, cosmeceutials
Frontiers in Marine Science | www.frontiersin.org 1 November 2020 | Volume 7 | Article 603447
INTRODUCTION
To maintain the health and integrity of an organism and neutralize the reactive species continuously produced during metabolic processes (Alscher et al., 2006), organisms use antioxidant substances to counteract this hazard imbalance.
Antioxidants may be considered as agents that delay, prevent, or remove oxidative damage from a target molecule by inhibiting the initiation or propagation of oxidizing chain reactions (Halliwell and Gutteridge, 2007). When the cell exposure to reactive species are prolonged over time, these unstable molecules can react with non-targeted molecules, causing diverse cellular impacts (Halliwell and Gutteridge, 1984; Yan et al., 1998; He and Häder, 2002; Dring, 2005; Valko et al., 2007). Phenolic compounds are well known as antioxidants (Ryan et al., 2002), although they exhibit many other activities such as antiallergic, anti-inflammatory, antibiotic, antiviral, antifungal, and UV photoprotection functions (Fabrowska et al., 2015). The antioxidant activity of phenolic compounds is mainly due to their redox properties, which play an important role in adsorbing and neutralizing free radicals, quenching singlet and triplet oxygen, or decomposing peroxides (Osawa, 1994).
Marine dissolved organic matter (DOM) is among the least characterized natural organic matter mixtures known (Hedges and Oades, 1997;Dittmar and Kattner, 2003;Hernes and Benner, 2006). At 662×1015gcarbon inventory (Hansell et al., 2009) and with over 10,000 molecular formulas and hundreds of structural features identified, this pool represents one of the Earth’s largest bioreactive reservoirs of organic material and among the most complex heterogeneous organic mixtures (Dittmar, 2015). The molecular mass of marine DOM ranges mainly between 250 and 550 Da (Simpson, 2002) and falls in the size of natural products (NP). NP are usually small molecules<3,000 Da (Mann et al., 1994) and are often called secondary metabolites because they are not biosynthesized by the general metabolic pathways and have no primary function (Martins et al., 2014). Given the molecular diversity of DOM, it is currently impossible to characterize this pool at the level of individual molecular structures. In this sense, the molecular structure of only 2–3% of bulk DOM is known (Dittmar, 2015). Despite of the limited knowledge of molecular structures in the DOM pool, non-targeted ultrahigh resolution mass spectrometry via Fourier transform Ion Cyclotron Resonance mass spectrometry (FT-ICRMS) provides information of individual molecular formulas, thus allowing DOM molecular characterization with an unprecedent detail. To facilitate the analysis of the complex data obtained by FT-ICR MS, molecular classification of detected molecular formulas into different molecular families is commonly performed (Merder et al., 2020). Among the molecular groups, polyphenols, highly unsaturated or unsaturated alyphatics have been described (Merder et al., 2020). Lignins, tannins, and humic acids are examples found in the group of polyphenols (Klavins et al., 1999;
Nebioso and Piccolo, 2013).
The antioxidant potential of humic substances in both aquatic and soil environments has often been measured using the ABTS radical cation decolorization assay (Rimmer and Smith, 2009;
Aeschbacher et al., 2010, 2012;Cardelli et al., 2012). This assay is
based on the reaction of a colored solution of the free radical 2,2’- azino-bis-3-ethylbenzothiazoline-6-sulfonic acid (ABTS·) with the antioxidant (Re et al., 1999). In DOM, the presence of hydroxyl groups in their aromatic rings and their positions in the molecule are responsible of the antioxidant activity (Symonowicz and Kolanek, 2012; Romera-Castillo and Jaffé, 2015). Previous studies have demonstrated the ability of DOM for quenching potential of hydroxyl radicals (·OH;Vione et al., 2006;Page et al., 2014) and of single oxygen (Cory et al., 2009). The quenching capacity of DOM is attributed to hydroquinones and phenol moieties (Aeschbacher et al., 2012). Conversely, DOM can act as sensitizer, producing reactive oxygen species (ROS) and triplet states of DOM (Janssen et al., 2014; Page et al., 2014) by the excitation of aromatic ketones, aldehydes, and quinone moieties (Golanoski et al., 2012). In algae and plant extracts, as well as in their isolated compounds, the abovementioned method together with 2,2-diphenyl-1-picryl-hydrazyl-hydrate (DPPH) free radical assay are commonly used for the assessment of antioxidant activity (Brand-Williams et al., 1995;Re et al., 1999).
Whilst relevance of DOM quenching process has been extensively evaluated, the quantitative assessment of the antioxidant DOM potential has only been recently measured by Romera-Castillo and Jaffé (2015) andKlein et al. (2018), thus highlighting the need of further development of this subject. Romera-Castillo and Jaffé (2015)demonstrated for the first time the effectiveness of ABTS and DPPH assays to measure DOM antioxidant activity in solid-phase extracted DOM and the variation in DOM antioxidant activity among different environments and diagenetic degradation states. Klein et al. (2018) assessed the effects of the physicochemical properties of humic substances under different pH on their antioxidant activity.
In this study, we aimed at evaluating the antioxidant potential and phenolic content of marine DOM pools from different origins, in order to give proof of concept of the biotechnological potential of one of the largest reservoirs of organic material on Earth. For this purpose, we have assessed (1) the antioxidant capacity of DOM in a more exhaustive manner by applying a polarity- mediated fractionation, (2) the molecular characterization of DOM with state-of-the-art ultra-high resolution mass spectrometry, (3) the relationships between DOM molecular composition and its antioxidant activity/phenolic content, and (4) via cytotoxicity analyses, possible future cosmeceutical applications of marine DOM as a marine bio-ingredient. In addition, we aimed at evaluating whether fractionation of marine DOM was successful in the enrichment of different molecular categories. Consequently, we lastly evaluated if the antioxidant activity and phenolic content is inherent to the synergistic effect of the bulk or distinguishable among molecular groups.
MATERIALS AND METHODS Sampling
Contrasting marine environments were chosen to test the antioxidant potential and phenolic content of marine DOM.
fmars-07-603447 November 23, 2020 Time: 15:11 # 3
Catalá et al. Antioxidant Activity Marine DOM
Oceanic water samples were collected in substantial amounts by the Research Group for Marine Geochemistry (ICBM, Oldenburg) at the Natural Energy Laboratory of Hawaii Authority (NELHA; www.nelha.org) on the island of Big Island, Hawaii, United States. near Kailua-Kona (19◦440N, 156◦040W) in 2008 (Green et al., 2014). At NELHA, the North Equatorial Pacific Intermediate Water (674 m; NEqPIW), one of the oldest water masses on Earth, hereafter referred to as “deep sea,” and surface water from the same site (21 m), hereafter referred to as “sea surface,” were collected. Both are also considered “water column” samples along the manuscript. The final extracts were stored in methanol at -20◦C at concentrations of 750 mmol/L for deep sea and 710 mmol/L for sea surface for future research uses. Thirdly, sediment porewaters from the extensive tidal flats of the Wadden Sea close to the Island of Spiekeroog (Germany) were also collected. Deep sea and sea surface samples were filtered directly from the NELHA laboratory taps through a 0.2 µm filter (Causa-PES 0.2µm polyethersulfone final filters for PPL, for more information, see Green et al., 2014). The porewater was collected in 10-liter acid-cleaned polycarbonate carboys by digging a hole directly in the intertidal flatland, transported directly to the laboratory and stored in the dark at 4◦C until filtration within 24 h. Filtration was performed first through acid- cleaned 1 µm GMF filters (Whatman) and then through pre- combusted (450◦C, 4 h) Whatman GF/F filters in an acid-cleaned filtration system. Procedural blanks consisting of ultrapure water instead of samples were included.
After acidification to pH 2.0 with HCl (25%, p.a., Merck), an aliquot of the sample was used to determine concentrations of non-purgeable organic carbon (DOC) and total dissolved nitrogen (TDN) with a Shimadzu TOC-VCPH total organic carbon and TNM-1 nitrogen detectors. Routine minimum detection limits are 9.7 µM-C for DOC and 6.4 µM-N for TDN, and standard errors are typically <2.5% of the DOC or TDN concentrations (Stubbins and Dittmar, 2012). Deep sea reference samples provided by D. Hansell (University of Miami, United States) were included in the analysis for validation.
Solid Phase Extraction
To study the molecular features of marine DOM via FT-ICRMS, sample concentration and removal of salts is required. Solid phase extraction (SPE) with PPL cartridges (Varian Bond Elut), a modified styrene divinylbenzene polymer type sorbent (SDBV), is currently the most effective technique for this purpose to date, recovering up to 70% of bulk DOC from marine environments (Dittmar et al., 2008; Green et al., 2014; Seidel et al., 2015;
Linkhorst et al., 2017). In this case, PPL (5gsize) cartridges were used (Dittmar et al., 2008). In sediment porewater, six PPL (5g size) cartridges were displayed in parallel to elute DOM from 90 L of filtered water in 8 days (∼2 L/cartridge/day). Procedural information about the water column samples can be obtained in Green et al., 2014. Prior to use, the cartridges were soaked in methanol (UPLC/MS grade, Biosolve BV) overnight and rinsed twice with ultrapure water, twice with methanol, and twice with 0.01 M HCl (suprapur). Before extraction, samples were acidified to pH 2 with HCl to increase the extraction efficiency for organic acids and phenols. After the samples passed through the PPL
resin, the cartridges were rinsed with ultrapure water (pH 2) to remove salts and dried with argon gas. Retained DOM was eluted with 40 mL of methanol. After rotary evaporation at a temperature lower than 40◦C, the final DOC concentration of the sediment porewater was 25 mmol/L (see final concentrations of deep sea and sea surface in section “Sampling”). The SPE-DOM porewater sample was stored in methanol at−20◦C.
DOM Fractionation
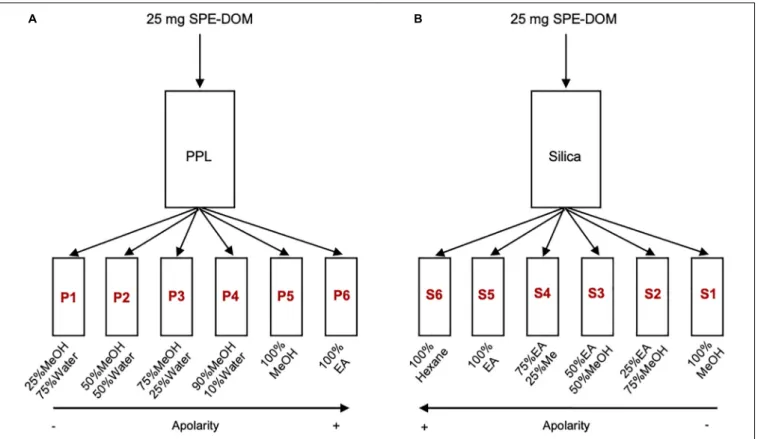
The highly concentrated SPE-DOM samples were dried at 36◦C and stored in dark in a desiccator until use. The fractionation was performed using PPL cartridges (5gsize; PPL fractionation) and silica columns (Type G, Stahl; Silica fractionation). 25 mg of each PPL extract were flushed through a PPL cartridge and a silica column with different solvents at different combinations to reach a polarity gradient (Figure 1). Fractionation yields for each fraction were calculated, according to the amount of carbon recovered. For each SPE-DOM, a total of 12 fractions of 40 mL each were obtained (6 PPL +6 Silica) and they are named according to the fractionation type and polarity degree (Figure 1). All organic solvents were MS grade, water had ultrapure quality. For PPL fractionation, solvent combinations of 25% methanol/75% water (P1), 50% methanol/50% water (P2), 75% methanol/25% water (P3), 90% methanol/10% water (P4), 100% methanol (P5) and 100% ethyl acetate (P6) were conducted. For Silica fractionation, solvent combinations of 100% hexane (S6), 100% ethyl acetate (S5), 75% ethyl acetate/25%
methanol (S4), 50% ethyl acetate/50% methanol (S3), 25%
ethyl acetate/75% methanol (S2), and 100% methanol (S1) were conducted. The fractions were stored at -20◦C, and before further measurements, they were dried and re-dissolved in the same solvent mixture.
Quantification of Antioxidant Activity and Phenolic Content
For the quantification of antioxidant activity and phenolic content, 1.6 mL of each fraction was collected. The aliquots were dried at 36◦C and redissolved in 1 mL of ethanol/water (1:1, v/v), which is an established solvent combination (Guedes et al., 2013; Michalak and Chojnacka, 2014) and in addition it can be used for nutraceutical and cosmeceutical applications in contrast to other solvent as methanol (Kim and Chojnacka, 2015). The antioxidant activity of the three original SPE-DOM and their silica and PPL fractions were spectrophotometrically determined using the free radical ABTS (ABTS·+) approach based on Re et al. (1999). The ABTS radical cation (ABTS·+) was generated by a reaction of 7 mM ABTS with 2.45 mM potassium persulfate. The mixture stood in the dark for 12–
16 h at room temperature to allow the formation of the ABTS·+
radical and was used within 2 days. A volume of 59 µL of each sample was added to 6 µL of the ABTS+ solution and 944µL potassium persulfate, and let react in the dark at room temperature during 7 min. The decrease in absorbance is related to the concentration of antioxidants (i.e., the more antioxidant potential a sample contains, the more transparent it will become).
A blank of the ABTS+solution with 994µL potassium persulfate
Frontiers in Marine Science | www.frontiersin.org 3 November 2020 | Volume 7 | Article 603447
FIGURE 1 |Scheme of the fractionation procedure.(A)Fractionation 1 (with PPL cartridges),(B)Fractionation 2 (with Silica columns). MeOH (methanol), EA (ethyl Acetate).
and 6 µL of the ABTS+solution was also measured and used as a control. A standard solution of Trolox (0–50µM) was used to prepared a calibration curve that serves as a reference for antioxidant activity. The extent of decolorization was expressed as a function of the standard concentration and represented as µmol TEAC (Trolox Equivalent Antioxidant Capacity) g−1 DOM (in dry weight, DW). The antioxidant activity of the three original SPE-DOM (porewater, deep sea, sea surface) and PPL and Silica fractions was measured by a BIO-TEK FL600plate reader (Winooski, VT, United States) at 342, 413, 645, 734, and 811 nm. For further calculations, the 413 nm was chosen. Since the DOM extracts contain chromophoric substances (particularly known as chromophoric DOM, CDOM), the intrinsic absorbance of the samples was measured before reaction and subtracted to the absorbance of the reaction at each measured wavelength. Each sample was measured in triplicate and the results are reported as an average of the three measurements.
The antioxidant activity of the samples (original extracts and fractions) was calculated by the following equation:
AA%=
Acontrol− (Asample−ACDOM) Acontrol
× 100
where Acontrolis the absorbance of the ABTS+solution; Asample is the absorbance of the sample after the reaction has taken place;
ACDOMis the intrinsic absorbance of the sample.
The method used for the quantification of phenolics was the Folin-Ciocalteu photocolorimetric method (Folin and Ciocalteau, 1927). For this, 5 µL of the sample was added and mixed with 75 µL of ultrapure water, 5 µL of Folin- Ciocalteu reagent and 15 µL of Na2CO3 (20%). The sample were stored for 2 h in the dark at 4◦C to allow the reaction to take place. Finally, the absorbance at 760 nm was spectrophotometrically quantified in a BIO-TEK FL600 plate reader (Winooski, VT, United States). A standard curve was performed with floroglucinol (0–300µg mL−1) and the results were expressed as mg phenols g−1 DOM (in dry weight).
To convert DOC into dry weight, DOC values were doubled, assuming that the half of the DOM weight correspond to carbon content (Krogh and Keys, 1934). In both ABTS and Folin-Ciocalteu method, blanks of all fractionation steps were collected, measured and subtracted to the sample to avoid any blank artifact.
To take the first steps into the introduction of marine DOM as a bioactive ingredient for cosmeceutical products, cytotoxicity measurements are essential. In this study, the Resazurin method was chosen, which has been broadly used in mammalian cells and bacteria for evaluation of biocompatibility of diverse materials. The method quantifies spectrographically the reduction of the nonfluorescent dye resaruzin by metabolically active living cells to the strongly- fluorescent dye resazurin (Borra et al., 2009; Kuete et al., 2017). The fluorescence output is proportional to the number
fmars-07-603447 November 23, 2020 Time: 15:11 # 5
Catalá et al. Antioxidant Activity Marine DOM
of viable cells. As resazurin is not toxic, the cells exposed to it can be returned to culture or used for other purposes (Kuete et al., 2017).
Cytotoxicity Tests
For the cytotoxicity assays, 1.6 mL of each fraction was first dried and redissolved in 2 µL of dimethyl sulfoxide (DMSO) and 98 µL of cell medium. To make sure that DOM gets properly dissolved, DMSO was added first. In this study, human epidermal keratinocytes (HaCat) and human hepatic cells (HepG2) were utilized for cell viability. HaCat cells and HepG2 cells were provided by the Leibniz-Forschungsinstitut für Molekulare Pharmakologie. In this institute, cells were seeded in 384 well plates at a density of 2,000 cells/well (5 ×10⁴ ml−1) in DMEM high glucose (Dulbecco’s modified Eagle’s medium) and at a density of 2,500 cells/well (6.25×10⁴ ml−1) in RPMI (Roswell Park Memorial Institute), respectively. Both mediums were supplemented with 10% fetal bovine serum (FBS). After 24 h, 10µL of sample was added to each well and let it incubate for 72 h at 37◦C. The final concentration of DMSO used was 0.2%
(v/v) for each treatment. Positive and negative controls cells were prepared with 0.2% of DMSO and Fluorouracil and only with 0.2% of DMSO, respectively. Next, 5µl of prewarmed resazurin (stock 0.4 mM) were added to the plates and incubated for 7 h at 37◦C. Lastly, fluorescence was measured with a Tecan reader to estimate cell viability (fluorescence read from top, excitation wavelength 560 nm, emission wavelength 590 nm, 10 nm bandwidth both for excitation and emission). Staurosporin, mibefradil, valinomycin, etoposide, and fluorouracil were added as references due to their cell inhibition properties.
FT-ICR MS
To avoid possible artifacts introduced by using different solvents in the FT-ICR MS measurements, the original SPE-DOM and their silica and PPL fractions were dried and redissolved in ultrapure water and methanol (MS grade) at a water-to-methanol ratio of 1:1 (v/v) to yield a DOC concentration of 2.5 mg C L−1. Duplicates of each sample were analyzed using a Solarix XR FT-ICR MS (Bruker Daltonik GmbH) connected to a 15 Tesla superconducting magnet (Bruker Biospin). Samples were injected at a flow rate of 120 µL h−1 into the electrospray ionization source (ESI; Apollo II ion source, Bruker Daltonik GmbH) in negative mode. Ions were accumulated in the hexapole for 0.3 s prior to transfer into the ICR cell. Data acquisition was done in broadband mode with a scanning range of 100–1,000 Da. For each mass spectrum, 200 scans were accumulated. The spectra were calibrated based on known molecular formulas over the whole mass range, which resulted in a mass error of <0.1 ppm. SPE-DOM from the deep sea sample was used as a reference sample to assess instrument variability over time (Hansman et al., 2015; Osterholz et al., 2016) given to its molecular stability after its long residence time in the deep ocean.
Method detection limit (MDL), mass alignment of different spectra and molecular formula attribution was done with the software ICBM-OCEAN (Merder et al., 2020). The MDL method (MDL level 2.5) was used to eliminate instrumental noise.
Mass spectra were recalibrated to reduce systematic error.
Masses were aligned among samples (0.5 ppm tolerance) and averaged over spectra to reduce the random mass error (Merder et al., 2019). In the formula attribution, the N, S, P rule, and the isotope verification was applied to exclude unlikely formulas. In addition to the CH2 homologous series, which are commonly used to remove double assignments (Koch et al., 2007;Merder et al., 2019), CO2, H2, H2O, and O homologous series were considered at this step to improve the formula assignment (Merder et al., 2020). Potential contaminants present in spectra of the blanks prepared during fractionation were removed prior to statistical analysis. Only the formulas present in both duplicate measurements were considered and their intensity were averaged for further evaluation. Formulas with absence of oxygen and with an O/C ratio >1.2 were excluded (Kind and Fiehn, 2007).
After applying the abovementioned filtration criteria, the number of assigned molecular formulas across all samples was 9989. The assigned formulas were sorted into groups of formulas containing the atoms CHO, CHON, CHOS, CHOP, and others (CHONS, CHOSP, and CHONP). In addition, we assigned the identified molecular formula to compound groups based on established molar ratios (H/C, O/C), modified aromatic index (AImod), double bond equivalent (DBE), and heteroatoms contents. Although uncertainty exists due to the hundreds of different possible structural combinations behind a molecular formula (Zark et al., 2017), this classification provides an overview of the distribution of formulas and of the likeliest chemical structure behind a molecular formula. We applied the rules implemented in ICBM-OCEAN (Merder et al., 2020). The molecular categories used in this work were: (1) polyphenols (0.5≤AImod≤0.666), which are highly aromatic compounds, (2) highly unsaturated compounds (AImod <0.5, H/C ≤ 1.5), (3) unsaturated aliphatics (1.5 ≤ H/C ≤ 2, and O/C<0.9, no N), and (4) unsaturated aliphatics with nitrogen (1.5 ≤ H/C ≤2 and O/C < 0.9 and N). The formulas were normalized to the sum of all molecular formula intensities for each sample, and subsequently, the intensity weighted- averages (indicated by the subscript w) of elemental ratios H/Cw and O/Cw, DBEw, AImodw (Vetter, 1994; Koch and Dittmar, 2006, 2016) and of the defined molecular categories were calculated. Exclusive molecular formulas present at each sample were also considered. Exclusivity refers to those formulas that are only present or detected in a sample, but not in any other samples.
Statistical Analysis
Non-metric multidimensional scaling (NMDS) was utilized to evaluate how different the samples are from each other in their molecular composition and ultimately, to evaluate how successful polarity-based fractionation was for the separation of molecular categories. This unconstrained method uses Bray- Curtis dissimilarity matrix to maximize the variance between samples based on ranking data and is useful when little is known about the data distribution (Buttigieg and Ramette, 2014). An extended constrained data evaluation, combining both molecular and antioxidant activity/phenolic content data, was
Frontiers in Marine Science | www.frontiersin.org 5 November 2020 | Volume 7 | Article 603447
FIGURE 2 |DOM Bioactivity along the polarity gradient.(A,B)Antioxidant Activity inµmol TEAC g-1DW(C,D)and phenolic content (mg phenols g-1DW). P1 to P6 and S1 to S5 denotes increase in apolarity during fractionation (for interpretation of the sample nomenclature, the reader is referred toFigure 1of this article).
performed using partial least square analysis (PLS). While in NMDS samples are just separated by their composition, in PLS samples are separated based on how their composition change in relation to independent variables such as antioxidant activity, phenolic content or sample type. Bioactivity and molecular data were standardized and Hellinger transformed to avoid variation caused by different scales or units and to give less weight to rare formulas (Ramette, 2007). PLS resulted in a linear model relationship between samples (scores) and variables, with the latter represented by both bioactivity data (X), and molecular data (Y) loadings. Accordingly, PLS analysis allowed identification of the formulas more strongly related to the antioxidant activity and phenolic content. To constrain these relationships, a threshold of≥0.4 and≤-0.4 for the molecular loadings along the PLS axes factor 1 was executed. Additionally, molecular categories and intensity-weighted molecular indicators were also passively displayed in the PLS model. As such, they did not influence the model but their location in the model allowed us to better visualize their correlation with other variables. NMDS analysis was performed in R (v3.1.0;
R: A Language and Environment for Statistical Computing, R Core Team R Foundation for Statistical Computing, Vienna, Austria, 20141) using RStudio (v0.99.903;RStudio Team, 2015) and the package vegan (v2.4-1; Oksanen et al., 2017). PLS analysis was done with the software Unscrambler (X version 10.5.1, Camo Software).
RESULTS
SPE and Fractionation Yields
With 90 liters of porewater at a DOC concentration of 875±85µmol L−1, and a SPE recovery of 49%, almost 1gof DOM dry weight was obtained. To accomplish a differentiation in molecular composition, a polarity-based fractionation with 25 mg of dried material was executed. The fractionation yields (i.e., DOC recoveries of all fractions referred to the initial amount) were higher for PPL than for Silica, with values of 52, 81, and 84% for porewater, deep sea and sea surface, respectively, (Supplementary Table 1). In the Silica fractionation, yields of 29, 45, and 51% for porewater, deep sea and sea surface were obtained, respectively, (Supplementary Table 1).
The DOC concentrations of the fractions ranged between 0.5 and 16.6 mmol L−1. The highest DOC concentrations were found in fraction P3 in both deep sea and sea surface (Supplementary Table 1). The 100% hexane fractions and P6 sea surface showed DOC concentrations in the order of a blank and therefore were not considered for further evaluation.
Bioactivity Tests
Porewater fractions presented the highest antioxidant activity and phenolic values in both Silica and PPL fractionations (Figure 2). With DOC concentrations of 3.0, 3.2, and 2.9 mmol
fmars-07-603447 November 23, 2020 Time: 15:11 # 7
Catalá et al. Antioxidant Activity Marine DOM
L−1for PPL (P2, P3, and P4) and 1.1, 3.3, and 1.9 mmol L−1for Silica (S5, S3, and S2), these porewater fractions exceeded 80%
of AA. When normalizing the AA to the DOC concentration (i.e., TEAC g−1 DW; Figures 2A,B), TEAC values exceeded 1000 TEAC g−1DW of the more apolar PPL and Silica porewater fractions (i.e., P5, P6, S5, and S4). All porewater fractions presented values higher than 400µmol TEAC g−1DW. Deep sea and sea surface fractions, at much higher DOC concentrations reached less radical scavenging potential per dry weight. They showed on average around 200 µmol TEAC g−1 DW. The phenolic content, as well as the antioxidant activity, reached maximum values in the most apolar fractions of porewater, with a maximum of 211 mg phenols g−1 DW in S5 (Figures 2C,D).
The minimum values were found in the P2, P3, and P4 fractions of both deep sea and sea surface. In the case of the deep sea,
the highest antioxidant activity and phenolic values were found in P1, S1, and S2, whereas in the sea surface, the highest values were found in P5, S5, and S4 (Figure 2). A highly significant linear correlation between phenolic content and the relative contribution of “polyphenols” formulas was observed (R2= 0.46, p<0.0001;Supplementary Figure 1).
DOM Molecular Composition and Its Relation With Bioactivity
An in-depth non-targeted molecular characterization via FT-ICR MS was done, with the final aim to link DOM composition to antioxidant activity and phenolic content. Differences in the molecular composition among the different DOM fractions were observed on the heteroatomic composition (Figure 3), the
FIGURE 3 |Heteroatomic composition in relative abundance of the different SPE-DOM and fractions. The colors denote different atomic compositions: blue (CHO), orange (CHON), yellow (CHOS), brown (CHOP), and gray (Others). The term “Others” refers to the formulas with CHONS, CHOSP, and CHONP.
Frontiers in Marine Science | www.frontiersin.org 7 November 2020 | Volume 7 | Article 603447
contribution of molecular categories (Table 1) and the overall DOM composition in each sample, represented by the relative abundance of all molecular formulas detected (the latter assessed by NMDS analysis, Figure 4). These differences in molecular composition among the polarity fractions corresponded to variations in bioactivities. In the porewater, antioxidant activity and phenolic content decreased with polarity (Figure 2). In the samples from the water column, a similar trend was not observed (Figure 2). NMDS analysis, which separates the samples according to the molecular composition, set the porewater samples apart from water column samples along the second axis (Figure 4). The first axis separated the fractions obtained via PPL fractionation (Figure 4A). For the case of Silica, this separation is not very clear and fractions are closer displayed than for PPL (Figure 4B). Porewater samples showed a maximum AImodw of 0.36 in P6, a highest polyphenol value of∼20% of the total number of formulas in P5, P6, and S1, and a maximum of 25% in unsaturated aliphatics of the total formulas in S4.
In addition, porewater samples are characterized by a higher number of formulas, a lower molecular weight, a higher CHOS content than the water column samples (Figure 3andTable 1).
On the contrary, water column samples are more enriched in highly unsaturated, O-containing formulas (i.e., higher O/Cwand DBEw). The highest content of highly unsaturated formulas was found in both P5 and P6 of deep sea and P6 of sea surface, up to a maximum of 60% (Table 1). Unsaturated aliphatic compounds with N were highest in the most polar fractions from PPL and Silica (Table 1). Compared to the molecular difference between porewater and seawater, the difference between surface and deep ocean was subtle. For instance, polyphenols were more abundant in deep water than in surface water, especially in the most polar fractions of both PPL and Silica fractions.
Partial least square analysis splitted samples along two factors based on how their molecular composition changes in relation to antioxidant activity, phenolic content and sample type. Factor 1 accounted for 52% and 19% of the environmental and molecular data variability, respectively, whereas factor 2 explained 22% and 10% (Figure 5). Factor 1 was associated with the sample origin (Figure 5A), which is significantly associated with the antioxidant activity and phenolic content of DOM (Figure 5B). In fact, a significant correlation between factor 1 and TEAC values (R2= 0.87;p<0.001), as well as between factor 1 and phenolic content (R2 = 0.80; p < 0.001), was found (Supplementary Figures 2,3). Factor 2 was related to polarity (Figure 5C). Along Factor 2 (Figure 5), the highest content of unsaturated aliphatics (O-rich) were found in the most polar PPL fractions, whereas the unsaturated aliphatics (O-poor) were allocated to the most apolar PPL fractions (Table 1). The increase of the antioxidant activity and phenolic content was associated with higher AImod, unsaturated aliphatics, S and polyphenol proportion (Figure 5D).
In the water column samples, high bioactive potential was related to high content in polyphenols and unsaturated with N (Table 1).
Direct analysis of FT-ICR MS data confirmed these molecular trends displayed by the statistical analysis.
To visualize the differentiated molecular features among samples, van Krevelen diagrams with H/C and O/C elemental ratios as orthogonal axes were generated (Figure 6A). They were
color coded with the molecular loadings from PLS analysis (z axis). The color gradient depicts the relation of each molecule to the antioxidant activity and phenolic content. As already mentioned in the methods, a threshold of ≥0.4 and ≤-0.4 was applied for factor 1. According to our PLS results, two new categories of molecular formulas were defined based on their association with bioactivity: formulas related to “high- bioactivity” with factor 1≥0.4 (yellow-red color inFigure 6A) and formulas related to “low-bioactivity” with factor 1 ≤ -0.4 (blue-pink color in Figure 6A). With this approach, a total of 1803 formulas related to “high-bioactivity” were confined.
Of this “high-bioactivity” group, 59% of the formulas was exclusive of porewater. 41% and 47% of these formulas contain N and S, respectively. Furthermore, 47% of this “high-bioactivity”
group were highly unsaturated and 23% under the category polyphenols (93% of both molecular categories were O-poor).
Molecular formulas in the water column fractions (i.e., 41%
of the “high-bioactivity” group) were mostly represented by highly unsaturated and polyphenols, but generally at lower intensity than in porewater. In this group, unsaturated aliphatic formulas with N were also abundant in the water column samples that displayed highest bioactivity signals (i.e., fractions S1 and S2). O-rich formulas account only for 6% of the “high- bioactivity” group. In the formulas related to “low-bioactivity,”
highly unsaturated formulas dominated with 93% and above half of them were O-rich.
DISCUSSION
Comparison of Antioxidant Activity in Marine DOM With Other Organic Mixtures
In our study, the DOC concentration and DOM recovery is within the range of what is commonly found in Wadden Sea porewater in previous studies (Seidel et al., 2015;
Linkhorst et al., 2017). The DOC concentrations and extraction efficiencies from water column samples were reported as 43.9±6.6µM and 61±3% for deep sea and 71.3±7.2µM and 61%±5% for sea surface, respectively (Green et al., 2014). DOM from different sources presented a wide range of antioxidant activities and phenolic content, which resulted in a different antioxidant activity. DOM from sulfidic porewater had highest values (Supplementary Table 1). Despite the lower values found in the water column in comparison with porewater, antioxidant activities and phenolic content were still exceeding what it is commonly found in macroalgae and microalgae with cosmeceutical purposes (Matanjun et al., 2008;Goiris et al., 2012;
Álvarez-Gómez et al., 2017), in vegetables (Deng et al., 2013), in fruits (Fu et al., 2011), in honey (Osés et al., 2006), and in the same magnitude as propolis (Kumazawa et al., 2004; Bohvehiì and Gutieìrrez, 2011;Supplementary Figure 4).
The SPE-DOM and ABTS techniques are among the most standardized methods for DOM extraction and estimation of antioxidant activity. Since both techniques use methanol as solvent, it would be straightforward to measure antioxidant
fmars-07-603447November23,2020Time:15:11#9
Cataláetal.AntioxidantActivityMarineDOM
TABLE 1 |Molecular composition and presence of molecular groups (percentage with respect to the total of formulas) for the three SPE-DOM and respective fractions.
Sample Name Total Number of formulae DBEw AImodw Polyphenols Highly.unsaturated Unsaturated.aliphatics Saturated fatty acids
O rich O poor O rich O poor O rich O poor With N CHO CHOX
Porewater 2046 8.3 0.28 5.5% 11.0% 22.5% 31.6% 4.7% 10.3% 5.2% 0.0% 0.4%
PPL Porewater
P1 1658 7.0 0.20 3.1% 9.7% 22.5% 16.8% 7.2% 2.8% 13.4% 0.0% 0.8%
P2 2243 7.9 0.29 3.2% 13.3% 25.4% 23.3% 6.6% 4.9% 8.7% 0.0% 0.2%
P3 2600 8.5 0.30 3.1% 13.2% 21.7% 35.4% 2.6% 8.4% 5.2% 0.0% 0.3%
P4 3089 8.7 0.30 1.9% 14.9% 13.5% 45.8% 1.1% 9.3% 5.0% 0.0% 0.3%
P5 3147 9.8 0.34 1.4% 17.2% 6.2% 51.4% 0.4% 10.9% 3.1% 0.0% 0.2%
P6 2271 10.0 0.36 0.7% 20.4% 3.8% 52.6% 0.3% 12.9% 0.4% 0.0% 0.4%
Deep sea 1906 8.8 0.24 0.3% 12.8% 22.3% 44.9% 2.6% 5.7% 5.3% 0.0% 0.4%
PPL Deep sea
P1 1645 8.5 0.24 0.5% 15.2% 20.6% 27.1% 5.7% 1.5% 14.6% 0.0% 1.5%
P2 1813 9.2 0.27 0.3% 16.0% 24.4% 35.5% 3.2% 3.9% 7.0% 0.0% 0.0%
P3 1331 8.8 0.26 0.2% 11.1% 25.9% 48.1% 2.3% 4.8% 2.4% 0.0% 0.2%
P4 1285 9.1 0.24 0.2% 8.1% 22.8% 57.7% 1.6% 6.1% 2.1% 0.0% 0.2%
P5 1013 10.9 0.25 0.0% 11.4% 17.5% 60.1% 1.3% 7.0% 1.4% 0.1% 0.3%
P6 987 10.5 0.28 0.0% 10.8% 9.8% 67.4% 1.2% 7.4% 0.7% 0.0% 0.6%
Sea surface 1888 9.5 0.24 0.5% 9.3% 25.4% 36.5% 4.4% 9.2% 7.4% 0.0% 0.4%
PPL Sea surface
P1 632 6.5 0.18 0.2% 11.7% 16.5% 29.3% 12.4% 3.6% 12.8% 0.0% 1.6%
P2 1292 8.3 0.24 0.2% 11.8% 22.8% 37.6% 7.9% 6.7% 8.0% 0.0% 0.2%
P3 866 8.2 0.24 0.0% 7.5% 24.1% 52.3% 3.2% 8.4% 2.1% 0.0% 0.2%
P4 1045 8.6 0.22 0.0% 6.0% 22.8% 56.9% 1.9% 9.2% 2.3% 0.0% 0.1%
P5 1106 9.6 0.21 0.1% 8.7% 19.3% 50.9% 1.8% 11.9% 4.4% 0.0% 0.7%
P6 446 8.4 0.23 0.0% 4.0% 10.1% 66.8% 1.1% 15.7% 0.2% 0.0% 0.2%
SIL Porewater
S5 1208 8.7 0.31 0.6% 12.7% 15.4% 53.8% 1.9% 7.9% 3.9% 0.0% 0.5%
S4 1356 7.2 0.25 0.4% 7.7% 11.4% 45.6% 2.4% 25.0% 4.7% 0.1% 0.9%
S3 2779 8.7 0.28 1.1% 14.0% 16.4% 40.7% 4.4% 8.4% 7.4% 0.0% 0.6%
S2 2845 8.9 0.30 1.8% 15.5% 17.0% 36.8% 3.7% 5.4% 8.2% 0.0% 0.5%
S1 2137 8.9 0.33 2.2% 18.0% 16.3% 35.9% 2.8% 3.6% 7.7% 0.0% 0.5%
SIL Deep sea
S5 2232 11.3 0.25 0.2% 15.1% 26.8% 39.2% 3.3% 3.0% 6.0% 0.0% 0.4%
S4 2413 9.3 0.24 0.0% 11.8% 21.4% 51.5% 2.6% 5.1% 3.0% 0.1% 0.5%
S3 1768 10.3 0.26 0.1% 11.3% 24.6% 47.6% 1.8% 2.4% 3.2% 0.0% 0.3%
S2 2152 9.5 0.26 0.9% 16.2% 25.0% 40.3% 2.0% 1.5% 5.4% 0.0% 0.4%
S1 2304 9.3 0.26 0.7% 15.6% 21.2% 41.1% 2.6% 1.6% 9.6% 0.0% 0.5%
SIL Sea surface
S5 1189 9.9 0.24 0.3% 11.1% 26.2% 42.7% 3.4% 8.5% 5.2% 0.0% 0.2%
S4 1435 8.2 0.23 0.0% 7.5% 16.7% 47.2% 5.5% 14.3% 7.0% 0.0% 0.3%
S3 1990 9.6 0.24 0.3% 10.8% 23.4% 47.7% 2.7% 3.2% 5.5% 0.1% 0.4%
S2 1947 9.1 0.23 0.3% 10.2% 24.7% 45.4% 3.3% 3.2% 7.1% 0.0% 0.2%
S1 1574 8.5 0.23 0.3% 10.6% 21.6% 41.0% 5.4% 2.8% 12.6% 0.0% 0.6%
FrontiersinMarineScience|www.frontiersin.org9November2020|Volume7|Article603447
FIGURE 4 |Non-metric multidimensional scaling (NMDS) of the relative abundance of DOM molecular formulas in the whole dataset (stress=0.125).
(A)PPL and(B)Silica fractionation samples are displayed. Colored circles refers to the three DOM origins namely porewater (brown), deep sea (blue), and sea surface (green) with bigger and smaller circles representing the original SPE-DOM and fractions, respectively. Small white circles refer to all molecular formulas in the dataset. SPE (SPE-DOM).
activity of DOM at a larger scale (Romera-Castillo and Jaffé, 2015). Because different absorption wavelengths are used in the literature to estimate radical scavenging, we assessed the potential artifact by this methodological difference. The differences were insignificant and within the range of analytical error (<7%), facilitating a broader comparison with literature data. Contrary to what has been previously reported (Rimmer and Smith, 2009; Romera-Castillo and Jaffé, 2015; Klein et al., 2018) no significant relationship between DOC concentration and antioxidant activity (TEAC g−1 DW) was found, probably due to the large sample diversity in our study. In order to compare the antioxidant activity and phenolic content of different NP with our results, our antioxidant activity and phenolic content were normalized by dry weight of DOM.Klein et al. (2018)recently measured the antioxidant capacity of humic acids (SRHA), fulvic acids (SRFA) and dissolved organic matter (SRDOM) from
Suwannee River. Their results were more similar to our values for porewater samples, ranging from 2,200 to 3,200µmol TEAC g−1 DW.Romera-Castillo and Jaffé (2015)showed evidence of the radical scavenging capacity of DOM in freshwater marsh environments and two rivers in the Everglades National Park.
For comparison, we converted their % of radical scavenging in TEAC units by using our own Trolox standard curve (R2= 0.99, p<0.001), as well as considering a DOC concentration of 100 mg L−1 and a sample dilution factor of 2 as indicated in their procedure. The results showed on average 65.1±4.7µmol TEAC g−1 DW, with maximum of 96.8 and 107.8 µmol TEAC g−1 DW in the fringe mangrove zone of Taylor Slough. Samples from Harney River also showed values between 90 and 95µmol TEAC g−1DW. In comparison with our results, these values resembled more our water column samples, remaining at the range of the PPL fractions P2, P3 and P4 of deep sea and sea surface.
Rimmer and Smith (2009)measured the antioxidant activity in soil organic matter from various sources, which resulted in a broad range from 20 to 14,020µmol TEAC g−1of soil. Similarly, values of 22 and 57µmol TEAC g−1DW for antioxidant activity, and 11–12 mg phenols g−1 DW were estimated for different peat extracts (Tarnawski et al., 2006). Overall, our porewater and water column results fall in range of those previously measured, given their wide range of coverage. However, those results are referred to terrestrial-derived DOM. Consequently, further marine DOM antioxidant activity measurements are needed for comparative reasons.
Molecular Formulas Associated With Higher Bioactivity
Aside polarity, phenolics content and antioxidant activity, individual molecular formulas of DOM compounds were provided as molecular information in this study. It’s worth emphasizing that even after fractionation, the full structural elucidation is still not possible, fractions are still molecularly very complex (>1,000 formulas per fraction in most cases). Indeed, polarity-mediated fractionation was not performed to reduce the molecular complexity but instead to obtain differences in the molecular composition and consequently in the bioactive potential which was confirmed by multistatistical tools. Another valuable information is the relative intensity of each formula.
Variations in relative signal intensity are a semi-quantitative proxy for changes in relative compounds contribution in a sample. For the case of the highest antioxidant activity and phenolic content, which was detected in porewater, 100 molecular formulas were related to the bioactivity (Figure 6B). Their highest relative intensities were allocated in fractions P5, P6, and S5 of porewater, thus reflecting that their contribution substantially increased the sample bioactivity.
The presence of polyphenols and unsaturated aliphatics (specially O-poor), AImod and CHOS was associated to the DOM bioactivity potential (Figure 5D). This finding is expected, as an antioxidant has to be reduced and reactive, meaning that it probably contains little oxygen and several double bonds (Bonner and Arbiser, 2014;Nimse and Pal, 2015). In the “high bioactivity” group, polyphenols (mostly O-poor) are irrefutably
fmars-07-603447 November 23, 2020 Time: 15:11 # 11
Catalá et al. Antioxidant Activity Marine DOM
FIGURE 5 |Partial least squares (PLS) analysis of DOM molecular formulas from porewater, deep sea and sea surface, displaying the first two axes (Factor 1 and Factor 2) in relation to the bioactivity data and DOC concentration. Factor 1 explained 52% and 19% of the bioactive and molecular variability and Factor 2 22% and 10%. Score plots are color coded based upon(A)origin,(B)antioxidant activity, and(C)polarity. Plot(D)shows the molecular loadings in relation to the
independent variables. The molecular indicators “highly unsat.” and “unsat. aliph.” are referred to highly unsaturated and unsaturated aliphatics, respectively. For interpretation of the sample nomenclature, the reader is referred toFigure 1of this article. SPE (SPE-DOM).
more abundant in porewater fractions not only in terms of number of formulas, but also in intensity. This indicates a higher contribution in porewater than in water column samples of those shared formulas. In the water column fractions, 41%
of the formulas from the “high bioactivity” group are also present. Although the signal intensities of these compounds are generally lower in the water column compared to porewater, their occurrence indicates that many of the bioactive substances in porewater are also present in the water column. Indeed, results after a PLS analysis exclusively with the water column samples confirm that the bioactivity potential is mainly driven by S-containing and polyphenols compounds (data not shown).
Highly unsaturated formulas are substantially present in both
“high bioactivity” and “low bioactivity” groups, indicating that the bioactive potential is not associated to the presence of this molecular category.
As mentioned above, polyphenols are dominant in the group of formulas associated with “high bioactivity.” Previously, it was postulated that these compounds may be attributed to condensed tannins or flavonoids (Hockaday et al., 2015) or lignin-like compounds (Zherebker et al., 2016), whose high antioxidant activity rates have been already determined (Rice- Evans et al., 1997; Dizhbite et al., 2004; Amarowicz, 2007).
Phenolic compounds constitute a main group of the antioxidants from both natural and synthetic sources (Brown et al., 2006).
Polyphenols are products of the secondary metabolism and constitute one of the most numerous and ubiquitous groups of substances in the plant kingdom, with several thousand different structural variants found in nature (Harborne, 1994;
Bravo, 1998). There are no vascular plants growing in the ocean and lignin content in marine DOM is low (Pellerin et al., 2010; Jex et al., 2014), but in the marine environment, organisms synthesize a vaster spectrum of secondary metabolites than in their land counterparts, which is considered as an evolutionary mechanism to survive in extremely different and hostile environments in terms of light, salinity and temperature (Gupta et al., 2012;Prabhu et al., 2017). In this sense, we presume that the adverse conditions present in the sediments (in terms of anoxia, light, and pH) may be responsible of the high presence of polyphenolic compounds.
Sulfur-Containing Compounds
In anoxic conditions, DOM is present in reduced forms and easily oxidized under oxidative agents. In such anaerobic conditions, abiotical incorporation of S into DOM, namely sulfurization, is enhanced (Pohlabeln et al., 2017), even at very early stages
Frontiers in Marine Science | www.frontiersin.org 11 November 2020 | Volume 7 | Article 603447
FIGURE 6 |van Krevelen diagrams (VKDs) of H/C and O/C ratios using the PLS molecular loadings (in thezaxis) fromFigure 5.(A)VKD with Factor1 loadings,(B) zoom-in of the 100 molecular formulas with the highest loadings on Factor 1 (i.e., formulas predominant in porewaters associated with the highest bioactivity as indicated inFigure 5B). For definition and location on the VKPs of discussed molecular categories see section “Cytotoxicity tests” andTable 1.
of sedimentary diagenesis (Wakeham et al., 1995). When O2 is fully consumed, SO4−2becomes the major electron acceptor in anoxic marine sediments, leading to the production of hydrogen sulfide, which subsequently can be incorporated in the DOM molecules as part of the sulfurization process (Jessen et al., 2017). Under absence of O2 and increase of sulfurization, a slowdown of organic matter degradation occurs, resulting in an increase of the preservation of reactive DOM species (Damste and de Leeuw, 1990; Hansell, 2013; Jessen et al., 2017). This could explain why we find a higher antioxidant potential and more S-containing formulas in porewaters than in the water column.
It is already known that sulfur-containing redox compounds are widely present in living organisms and in the environment (Goncharov et al., 2016). One of the most discussed mechanisms to sulfur incorporation in reduced sediments has been through thiols (i.e., Michael addition; Movassagh and Shaygan, 2006;
Amrani et al., 2007). Thiol-based redox systems arose early in evolution among all phylogenetic branches (i.e., including anaerobic bacteria and archaea), after the necessity of organisms for the maintenance of cellular redox potentials and the defense against reactive species (Hand and Honek, 2005; Deponte, 2017;Ulrich and Jakob, 2019). However, thiols are observed in very low concentrations (Hand and Honek, 2005) or are even undetectable (Pohlabeln et al., 2017) in marine environments.
They are in general unstable under the presence of oxygen (Dupont et al., 2006) and had likely been oxidized prior to analysis (Pohlabeln et al., 2017). Therefore, further reactions resulting in more stable S-containing subtances should take place. Pohlabeln and Dittmar (2015) found that the main oxidation products were sulfonic acid groups, which are very stable. Moreover, the higher stability of disulfide bonds (RS-SR;
Neubeck and Freund, 2020) could be also a reason of the preservation of S-containing formulas.
Another factor worth considering in order to explain the higher antioxidant activity in porewater is the initial emergence of antioxidants. Antioxidants appeared far predating the appearance of O2in the atmosphere not to counteract ROS but also to counteract sulfur reactive species (SRS;Neubeck and Freund, 2020). In fact, experimental evidence concluded that many antioxidants possessed higher affinity toward SRS than toward ROS (Slesak et al., 2016; Case, 2017;Olson et al., 2017;
Neubeck and Freund, 2020). In this sense, the presence of a higher number of antioxidants in porewaters may also be in response to SRS.
Marine DOM as a Cosmeceutical Ingredient
As far as we know, this is the first study that employed ultrahigh-resolution FT-ICR MS to get a hint of the molecular landscapes behind those samples with high antioxidant activity and phenolic content. Individual molecular formulas linked to “high-bioactivity” have been elucidated. Even though targeted chemical analyses were not employed, as usual in pharmaceutical/cosmeceutical studies, we demonstrated an easy and straightforward procedure to elucidate the molecular features of DOM samples without physical isolation of individual compounds. In this procedure, chemometric techniques were applied to distinguish the molecular features associated with the presented modes of bioactivity.
Chemometric methodology was established because of the need to analyze highly complex databases generated from non-targeted approaches such as transcriptomics, proteomics
fmars-07-603447 November 23, 2020 Time: 15:11 # 13
Catalá et al. Antioxidant Activity Marine DOM
or metabolomics (Trygg et al., 2006). This approach could be extrapolated to different bioactivities within the pharmaceuticals and cosmeceuticals, as already employed by Zhernov et al.
(2017); Tuttle et al. (2019), or Mueller et al. (2020). All these studies, including ours, have in common the merging and success of non-targeted chemical characterization with pharmaceutical or cosmeceutical analyses. Here, we demonstrate the feasibility to identify novel NP from complex organic mixtures, which were inaccessible until today.
With a future commercial orientation, the cytotoxic tests demonstrated an innocuous effect in most DOM fractions at a maximum concentration 10 times higher than used in our bioactivity assays (Supplementary Table 1). Only in 7 fractions (4 from deep sea and 3 from porewater), inhibitory effects were detected (Supplementary Table 2 and Figure 7). The highest cytotoxicities were found in S5 porewater and S2 deep water with IC50 of 264 and 288 µg mL−1 for the 2 cell lines, respectively. Sea surface samples showed no cytotoxicity throughout the whole concentration range. Thus, these results indicate that the possibility of using porewater and water column DOM as a marine ingredient is presumably plausible. Attention has been turned to marine microorganisms in recent times, as their ability to produce metabolites with unmatched structures (Bhatnagar and Kim, 2010). However, the marine DOM or the exometabolome of marine microorganisms has never been included in the exploration of active ingredients.
The novelty of marine DOM is that it is present in all marine environments forming one of the largest pools of organic carbon on Earth’s surface. The lowest concentrations are found in the Pacific Ocean with ca. 40 µmol C kg−1 (Hansell et al., 2009), while the highest concentrations can be found in marine sediments and terrestrial wetlands with concentrations up to 1,000 times higher (Chin et al., 1998;Alperin et al., 1999;Burdige et al., 2004). This will determine the volume of water to be
filtered when obtaining the desired concentration. Although the molecular composition varies according to the source, there is a portion of the DOM that is ubiquitously present, regardless of the source (Zark and Dittmar, 2018). In Zark and Dittmar (2018), they found that approximately 40% of the DOM was present in the whole dataset. This ubiquitous DOM subset is quite represented by carboxyl-rich alicyclic molecules (CRAM), which falls in the highly unsaturated molecular category. CRAM are the most abundant identified component of DOM in the deep ocean (ca. 8% of total DOC,Hertkorn et al., 2006). The fact that CRAM have undergone extensive alterations gives them a great resistance to degradation as well as a refractory character (Hertkorn et al., 2006). Since the vast majority of the formulas belonging to the
“high bioactivity” group present in all three marine environments (i.e., 41%) are “highly unsaturated,” it would be interesting to expand the number of samples in future studies and check whether these formulas are present on a larger scale. If this is the case, this would facilitate the choice of an appropriate sampling site for the exploration of bioactive compounds in DOM. However, it should not be forgotten that some of the candidates substantially responsible for the bioactivity in this study have been S-containing, unsaturated and polyphenolic compounds. These compounds are not as abundant in the water column as in reduced anoxic environments, such as marine sediments or deep hydrothermal systems (Wakeham et al., 1995;
Amrani et al., 2007;Pohlabeln and Dittmar, 2015;Rossel et al., 2015, 2017;Jessen et al., 2017), even though they also seem to influence the bioactive potential considerably (data not shown).
Another advantage of marine DOM is that it does not require cultivation, one of the main bottlenecks found in the pharmaceutical and cosmeceutical industries (Martins et al., 2014). Challenges such as sustainable supply and biodiversity access would be also less restricted with DOM, as no marine organisms are involved.
FIGURE 7 |Human keratinocites (HaCat) and hepatic (HepG2) cells exposed at non-toxic and toxic dosis. On the left panel, HaCat cells are cultured with P6 deep sea and S5 porewater at concentrations(A,B)below and(C,D)above the IC50. On the right panel, HepG2 cells are cultured with S3 Porewater and S3 Deep Sea at concentrations(E,F)below and(G,H)above the IC50.
Frontiers in Marine Science | www.frontiersin.org 13 November 2020 | Volume 7 | Article 603447