TELLUS ISSN 0280–6509
Observations of atmospheric variability and soil exhalation rate of radon-222 at a Russian forest site
Technical approach and deployment for boundary layer studies
By I. LEVIN1∗, M. BORN1,2, M. CUNTZ1, U. LANGEND ¨ORFER1, S. MANTSCH1, T. NAEGLER1, M. SCHMIDT1, A. VARLAGIN3, S. VERCLAS1 and D. WAGENBACH1, 1Institut f¨ur Umweltphysik, Universit¨at Heidelberg, Im Neuenheimer Feld 229, 69120 Heidelberg, Germany; 2Fachbereich Physik, Universit¨at Marburg, Renthof 5, 35037 Marburg, Germany; 3Svertsov Institute for Evolutionary and
Ecological Problems, Leninskii pr. 33, 117071 Moscow, Russia (Manuscript received 9 July 2001; in final form 22 April 2002)
ABSTRACT
A monitor for continuous observations of the atmospheric222Rn daughter activity has been improved and successfully implemented in a field study in the European Taiga (Fyodorovskoye Forest Reserve).
Theα-activity of the short-lived222Rn and220Rn (212Pb) decay products, which are attached to aerosols, is accumulated on a quartz aerosol filter and assayed on line byα-spectroscopy. Theα-activity from the
212Pb daughters is determined by spectroscopy and corrected for. This monitor is suitable to measure
222Rn activities at hourly resolution down to 0.5 Bq m−3with an uncertainty well below±20%. The prototype of this monitor is run in Heidelberg on the roof of the Institute’s building about 20 m above ground. For this site, the atmospheric radioactive disequilibrium was determined between the
222Rn daughter214Po and222Rn, which has to be known in order to derive the atmospheric222Rn activity with the static filter method. We derived a mean disequilibrium214Po/222Rn=0.704±0.081 for various meteorological conditions through parallel222Rn gas measurements with a slow pulse ionisation chamber. At the Russian field site, continuous activity observations were performed from July 1998 until July 2000 with half a year’s interruption in summer/fall 1999. During intensive campaigns, a second monitor was installed at Fyodorovskoye at 15.6 m (July/August 1998), and at 1.8 m (July/August 1999 and October 1999) above ground. As expected, pronounced diurnal cycles of the222Rn daughter activity were observed at all sites, particularly during summer when the vertical mixing conditions in the atmospheric surface layer vary strongly between day and night. The lower envelope of the continuous measurements at Fyodorovskoye and at Heidelberg changes on synoptic timescales by a factor of 4–10 due to long-range transport changes between continental to more maritime situations. Generally, the
222Rn activity at 26.3 m height at Fyodorovskoye is lower by a factor of 2–3 compared to Heidelberg at 20 m above ground. This unexpected result is due to considerably lower222Rn exhalation rates from the soils measured in the footprint of the Fyodorovskoye Forest tower compared to Heidelberg. With the inverted chamber technique222Rn exhalation rates in the range 3.3–7.9 Bq m−2h−1were determined at Fyodorovskoye for summer 1998 and autumn 1999 (wet conditions with water table depths between 5 and 70 cm). Only during the very dry summer of 1999 the mean222Rn exhalation rate increased by about a factor of five. All measured exhalation rates at the Fyodorovskoye Forest are considerably smaller by a factor of 2–10 compared to observations in the vicinity of Heidelberg (ca. 50–60 Bq m−2 h−1) and generally in Western Europe.
∗Corresponding author.
e-mail: ingeborg.levin@iup.uni-heidelberg.de
1. Introduction
Uranium-238 is a trace component of all soils and the primary isotope in the main uranium–radium de- cay series. Radon-222, which is produced through α-decay of radium-226 in the soil, is the only gaseous decay product in this series. As a noble gas, part of the
222Rn emanates from the soil grains into the soil air and diffuses to the atmosphere. Here it is left to atmo- spheric dilution and radioactive decay (T1/2=3.8 d).
As the226Ra activity is rather constant in different soil types (10−2–10−1Bq g−1soil), and the emanation co- efficient as well as the diffusion constants in the soil air do not vary by orders of magnitude,222Rn exhalation rates from continental soil surfaces are rather homoge- neous (D¨orr and M¨unnich, 1990). They vary between 20 and 100 Bq222Rn m−2h−1, depending mainly on the grain size distribution of the soil material, soil poros- ity and soil humidity (Schery et al., 1984; Nazaroff, 1992; Sch¨ußler, 1996). Compared to the continents, the222Rn emanation from ocean surfaces is negligible (Wilkening and Clements, 1975). Therefore, the222Rn activity of an air mass can be used as an indicator for its residence time over the continent. Moreover, on the regional scale,222Rn can be used as a quantitative tracer to parameterise diurnal changes of the inversion layer depth. In comparison to other gases, such as car- bon dioxide or methane, also exhaling out of the soil or emitted at the soil surface, it is possible to use222Rn for source strength estimates of those other gases if the
222Rn flux at the soil surface is measured in addition (e.g. D¨orr et al., 1983; Levin, 1984; Levin et al., 1989;
Wilson et al., 1997; Kuhlmann et al., 1998; Biraud et al., 2000). The prototype of the222Rn monitor de- scribed here was set up in Heidelberg on the roof of our Institute’s building (Verclas, 1994; Cuntz, 1997).
Here it was used for regional CH4and N2O emission estimates (Levin et al., 1999; Schmidt et al., 2001).
During the EUROSIBERIAN CARBONFLUX project, an improved version of this monitor was in- stalled in Russia at a field measurement site in the Fyodorovskoye Forest Reserve (33◦E, 56◦N, about 300 km north-west of Moscow) in July 1998, and was run there with some interruptions until July 2000. Our purpose was to apply the so-called radon tracer method and estimate night-time CO2fluxes from the forest area using concurrent222Rn and CO2observations, together with direct measurements of the222Rn exhalation rate from soils in the footprint of this site. In addition, dur- ing three roughly weekly intensive campaigns, atmo- spheric222Rn measurements were performed in the
forest at two levels to derive activity gradients within the canopy. These atmospheric profile data allow es- timates of the vertical exchange coefficient in a sim- ple box-model approach (Langend¨orfer et al., 2002).
Moreover the continuous atmospheric222Rn data are used for validation of mesoscale atmospheric transport model estimates (Chevillard et al., 2002).
The purposes of this paper are (1) to describe in de- tail the technical set-up of our improved222Rn moni- tor and to document its analytical performance, and (2) to present the continuous measurements at the Fyodorovskoye forest site in comparison with the Heidelberg 222Rn data. In addition, the results of the measured222Rn exhalation rates in the footprint of the Fyodorovskoye tower are presented and discussed in relation to the respective hydrological situation.
2. Sampling and measurement techniques
2.1. Atmospheric222Rn activity
2.1.1. Measurement principle.The short-lived daughters of222Rn, namely218Po (T1/2=3 min) and
214Po (T1/2=162µs) are metals, and, therefore, immediately after generation they become attached to sub-micron aerosol particles. Depending on the meteorological conditions, and the distance from the earth’s surface, the 222Rn daughters are close to radioactive equilibrium with atmospheric 222Rn.
Hence, provided the disequilibrium is known, the atmospheric222Rn (gas) activity can be determined via its short-lived daughter activity. Based on earlier work by Volpp (1984), we developed an improved version of a 222Rn monitor using the static filter method. This consists of a specially designed filter holder withα-detector and pre-amplifier as well as dedicated analogue and digital electronics. Ambient air is continuously pumped through a quartz filter.
The222Rn (and 220Rn, see below) daughters which are attached to aerosols are quantitatively collected on the filter. The α-decay of the 222Rn daughters,
218Po (αE=6.0 MeV) and 214Po (αE=7.7 MeV), is measured in situ with a surface barrier detector.
The meanα-activity of the222Rn daughters measured during a certain time interval (e.g. half an hour) on the filter is proportional to the atmospheric 222Rn daughter activity approximately one hour before.
This “time delay” is due to the pureβ-emitters214Pb and 214Bi having a half-life of 26.8 and 19.8 min,
respectively, thus leading to a time lag of the measured α-activity (214Po) on the filter.
A principal shortcoming in determining the at- mospheric 222Rn daughter activity accurately with the static filter technique is the interference of the α-activity of the220Rn daughters.220Rn is the very short-lived (T1/2=55.6 s) radon isotope of the
232thorium decay series and also produced in all soils.
Its decay products,212Po (αE=8.8 MeV), and212Bi (αE=6.1 MeV), are also collected on the filter. We overcome this problem by resolving the composite spectrum of the α-activity on the filter with suffi- ciently high energy resolution allowing one to separate the220Rn daughter from the222Rn daughter activity.
The accumulatedα-counts of both222Rn daughters,
214Po and218Po can not, however, be separated. Thus radioactive equilibrium on the filter is assumed be- tween214Po and218Po, and the respective218Po counts (5.79%) are subtracted from the total222Rn daughter counts on the filter. The214Po activity on the filter, which is in radioactive equilibrium with the214Bi ac- tivity on the filter, is then used to determine the atmo- spheric214Po activity (which is in radioactive equilib- rium with the atmospheric214Bi activity), taking into account the flow rate through the filter, the filter effi- ciency and the solid angle of theα-detector. A detailed description of the experimental set up, the theoretical filter equations and the final calculation of the atmo- spheric214Po activity from the measured filter activity are given in the Appendix.
2.1.2. Determination of the atmospheric 222Rn activity.In our geophysical application, we are finally interested in the atmospheric222Rn activity. It is pos- sible to derive this quantity if the disequilibrium be- tween222Rn activity and the (measured) atmospheric
214Po activity in ambient air is known. This relation- ship mainly varies with the meteorological conditions, the height above ground and the number of aerosol particles determining the fraction of unattached Rn daughters (e.g. Jacobi and Andr´e, 1963; Whittlestone, 1990; Porstend¨orfer et al., 1991; Schery and Wasiolek, 1993). Deviations from radioactive equilibrium may occur also during strong aerosol scavenging events.
For continental sites such as Heidelberg or Fyodorovskoye, lowest aerosol particle number con- centrations are in the order of 104 cm−3, so that the fraction of unattached Rn daughters is probably only in the order of a few percent (Reineking and Porstend¨orfer, 1990). For our Heidelberg measure- ment site 20 m above ground in the suburbs of the city, the mean disequilibrium has been determined by par-
allel measurement of214Po with the radon monitor and the222Rn activity with a slow-pulse ionisation chamber (Fischer, 1976). For different seasons and different meteorological conditions, a mean disequilibrium fac- tor214Po/222Rn of 0.704±0.081 (n=17) was found (Cuntz, 1997). A value of 0.755±0.026 (n=8) was determined for convective afternoon conditions only.
When large short-term changes of the atmospheric
222Rn activity occur, as is the case during the build-up of strong night-time inversions, disequilibrium factors as small as 0.63 were observed. Our measurements of the214Po/222Rn disequilibrium are to be compared with results from Volpp (1984), who determined dise- quilibrium factors between 0.73 and 0.95 for the same Heidelberg measurement site (although at a height of 17.4 m above ground). Theoretical calculations made by Jacobi and Andr´e (1963) for 10 m above ground yield a mean disequilibrium of 0.835 rang- ing from 0.73 to 0.97, depending on the turbu- lent diffusion coefficient in the atmosphere. For 100 m above ground, Jacobi and Andr´e calculate a mean disequilibrium of 0.915 with a range of 0.88–
1.0. More sophisticated model estimates by Schery and Wasiolek (1993) and their direct observations as well as observations by Porstend¨orfer et al.
(1991), although at lower heights above ground, yield slightly lower values. From this comparison with earlier experimental data and theoretical calcula- tions we conclude that our experimentally determined mean disequilibrium factor of 0.704±0.081 falls well within the range of other investigations.
However, the Heidelberg disequilibrium factor scales linearly with the calibration of the efficiency of our radon ionisation chambers. This calibration was originally performed in two ways: the efficiency of the chambers was calculated theoretically from their geometry and the comparison between a theo- reticalα-spectrum with the actually measured spec- trum. In this way the efficiency was calculated to 96%
(Fischer, 1976). In addition, standard222Rn samples derived from an absolutely calibrated radium-226 so- lution were injected into the chambers which yielded efficiencies between 92 and 94%. The efficiency of the chambers was thus estimated by Roether and Kromer (1978) to be “better than 95%”. The chambers had originally been designed and used for222Rn analyses in surface ocean water to derive gas exchange rates. In later years, they were only used for soil radon investi- gations as in the present study. In their study of222Rn exhalation rates from soils in West Germany, D¨orr and M¨unnich (1990) assumed a counting efficiency of the
ionisation chambers of only 81%. This number was applied to all subsequent measurements, including the determination of the214Po/222Rn disequilibrium factor by Cuntz (1997).
In order to be comparable to these earlier studies, we used here the same value for the chamber effi- ciency as D¨orr and M¨unnich (1990). However, one has to keep in mind that this value may be too low by up to 15%, and that the disequilibrium factors for the Heidelberg measurement site may also be under- estimated by the same amount. In fact, a larger cham- ber efficiency would bring the disequilibrium factors up to the experimentally determined values of Volpp (1984) and to the theoretical calculations by Jacobi and Andr´e (1963). However, for the studies apply- ing the radon tracer method (i.e. Levin et al., 1999;
Langend¨orfer et al., 2002; Schmidt et al., 2001) the absolute value of the atmospheric222Rn activity is not important, as long as the soil exhalation fluxes applied in these studies are determined with the same ionisa- tion chamber efficiency as the atmospheric214Po/222Rn disequilibrium. Therefore, we applied a214Po/222Rn disequilibrium factor of 0.704±0.081 to all Heidel- berg214Po activities to derive atmospheric222Rn gas activities. Although the disequilibrium has been ob- served and theoretically calculated to change with the meteorological situation and the aerosol concentra- tion, we use here a constant value; the uncertainty associated with this simplification is in the order of
±10%.
For the Fyodorovskoye measurement site, an exper- imental determination of disequilibrium factors was not possible. However, from the discussion above, for the upper measurement level (at 26.3 m above ground, and about 3 m above the forest canopy) it is fair to assume a disequilibrium factor close to the one mea- sured in Heidelberg. For the low measurement levels (15.6 m in July 1998 and 1.8 m in July and October 1999), following the theoretical calculations by Jacobi and Andr´e (1963), the disequilibrium factors should be close to that at 26.3 m for daytime situations, whereas a significantly smaller factor should be valid at least for the 1.8 m level during stable night-time situations, particularly in summer. The mean theoretical disequi- librium factor for four different stability classes for 1 and 10 m above ground is calculated from Table 1 in Jacobi and Andr´e (1963) to be 0.745. This factor is about 17% higher than the mean theoretical value for 10 and 100 m above ground (i.e. 0.878). In order to take into account that the disequilibrium factor de- creases from 26.3 to 1.8 m, at least during stable nights,
and to derive a consistent data set (in terms of abso- lute calibration of our records), as a first estimate we therefore used a disequilibrium factor for the summer 1999 campaign at 1.8 m of 0.704/1.17=0.6.
When comparing our observations from the two measurement levels during the autumn 1999 cam- paign, the activity data in the two heights (when calcu- lated assuming no disequilibrium, i.e. a disequilibrium factor of 1) do not show any significant gradient neither during the day nor during night. This finding may sug- gest a well mixed atmospheric surface layer and equal disequilibrium factors at both levels. The same is true for the summer 1998 campaign when comparing the 26.3 m and the 15.6 m levels. Therefore, we decided to apply one constant disequilibrium factor to all mea- surements performed at the respective two levels for summer 1998 and autumn 1999, namely 0.704±0.081 (the same value as for Heidelberg). This decision is supported by the finding that the influence of222Rn exhalation in the immediate footprint of the measure- ment site during the summer 1998 and the autumn 1999 campaign was probably very small due to the very small exhalation rates. During the summer 1999 campaign the situation was different with soil exhala- tion rates larger by almost one order of magnitude, and a respectively larger contribution of222Rn exhalation from the immediate footprint to the observed vertical gradient (Section 3.1).
2.1.3. Discussion of the atmospheric 222Rn data quality.The total uncertainty of the atmospheric222Rn activity determined with the 222Rn monitor via the atmospheric daughter activity can be estimated for Heidelberg to±17%, which is mainly due to system- atic errors of the disequilibrium between222Rn and
214Po in the atmosphere and214Pb and214Bi on the filter both contributing about 10% (Cuntz, 1997). A compa- rably smaller uncertainty is associated with the statis- tical counting error (for half-hourly values, ca.±4%) and the flow rate error (ca.±4%). The field observa- tions at Fyodorovskoye have a slightly larger uncer- tainty: due to constraints of the electrical power sup- ply, the flow rate here was only about 60% of the flow rate in Heidelberg, and the measured activity was only 20–30% of that generally measured in Heidelberg.
The statistical counting errors of the Fyodorovskoye measurements were therefore in the order of±6%.
In addition, we were not able to determine the dis- equilibrium factors for the two measurement levels experimentally, so that the uncertainty of this pa- rameter is probably here in the order of±15%. All these uncertainties lead to a total uncertainty of the
Fyodorovskoye222Rn measurements of±(20–25)%.
Note that determination of relative222Rn gradients is much more accurate, in the order of only±15%. This can be derived from the standard deviation of the gradi- ent observed during the July 1998 campaign (Fig. 5a) which is in the order of only±(10–15)%.
2.2. Procedures to measure222Rn exhalation rates at the soil surface
2.2.1. Sampling procedure for soil exhalation samples.Soil exhalation samples for222Rn analyses have been collected with the closed chamber method following the procedure by D¨orr and M¨unnich (1990).
The basis part of a stainless steel chamber (0.6 m× 0.6 m, ca. 0.3 m high), an open frame, was driven about 3–5 cm into the soil and left there for about 10–20 min to adjust disturbances of the soil surface.
Then the top was mounted on the frame and sealed with water. Immediately after closure of the chamber, a “start” sample was collected (this sample was only analysed for CO2and CH4concentration to provide a measure of the disturbance of the topsoil during instal- lation of the chamber). The exhaling soil gases were then accumulated for about one hour, and a sample was subsequently collected. The long exposure time was necessary in this study to yield measurable222Rn ac- tivities; however, through this constraint, all measured fluxes, including the222Rn exhalation rate, may be un- derestimated due to possible back-diffusion of gases from the chamber air into the soil. Air samples from the chamber were collected into 500 mL aluminium- coated polyethylene bags using a gas-tight 50 mL sy- ringe. The sample bags have been regularly tested to be gas-tight through duplicate measurements of their
222Rn activity on consecutive days. During the July 1998 sampling campaign, the water table depth was also measured at each sampling location.
2.2.2. 222Rn activity determination of soil exhala- tion samples.The soil exhalation samples were trans- ported from the field site (Fyodorovskoye) to the lab- oratory in Heidelberg within 24 h, and an aliquot of about 100–200 mL was injected into the same slow- pulse ionisation chambers (Fischer, 1976) which were used for determination of the atmospheric disequilib- rium factors between222Rn and214Po at the Heidelberg measurement site (Section 2.1.2). Typical counting rates of the exhalation samples were in the order of 0.5–5 cpm. Each sample was counted for about 12 h.
Typical counting errors were in the order of±5%.
222Rn exhalation rates at the soil surface were deter-
mined assuming a linear concentration change under the chamber with the initial concentration set to the lowest level atmospheric observation. The typical error of a222Rn flux determination is estimated to±10%.
3. Observational results
3.1. 222Rn soil exhalation rates within the footprint of the Fyodorovskoye tower
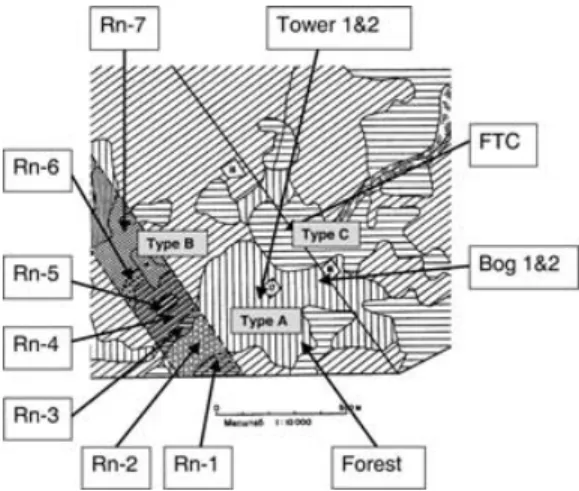
During each of the intensive campaigns at the Fyodorovskoye field site, at least one transect of soil exhalation sampling has been performed. Samples were collected in the immediate neighbourhood of the meteorological tower (“Tower”), at two additional sites south (“Forest”) and east (“Bog”) of the tower close to a small bog as well as along a transect (Rn-1 to Rn-7) which is characterised by different water ta- ble depths and consequently different plant cover. In August 2000, an additional site, FTC, was sampled (4 positions in an area of about 50 m×50 m), be- cause it turned out that one rather frequent soil type had not been sampled in the footprint of the tower. A map of the sampling sites, including the location of the atmospheric observational tower, is shown in Fig. 1.
The area of the footprint can be roughly separated into three different soil and vegetation types: Type A, im- mediately around the tower is poorly drained with wa- ter table depths between 5 and 15 cm below soil sur- face. A peat layer of about 50 cm thickness is covering
Fig. 1. Map of the222Rn exhalation sampling sites around the Fyodorovskoye Forest Reserve tower located in the Euro- pean Taiga (33◦E, 56◦N; basic map courtesy of T. Minaeva).
the light-loamy soil underneath. Vegetation is mainly spruce with sphagnum mosses and blueberries as un- derstory. On Type B the peat layer is generally missing;
these areas are about 1–2 m higher in elevation than type A and are better drained. The vegetation consists of spruce and poplar with fern and raspberries as un- derstory. Type C is intermediate between A and B with respect to its hydrological and vegetation conditions.
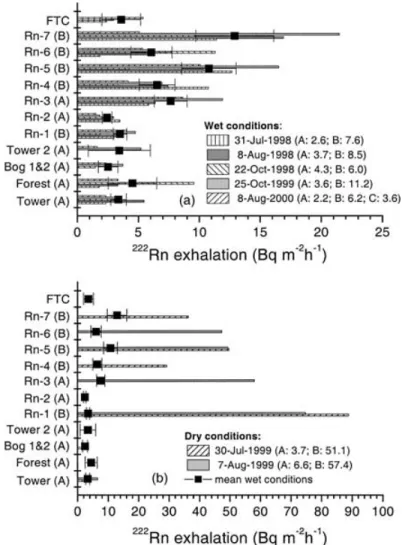
All individual results from the soil exhalation sam- ples collected during the five “wet” and the two “dry”
radon transects are presented in Figs. 2a and b. Dur- ing wet conditions, mean exhalation rates from soil
Fig. 2. (a)222Rn exhalation rates measured during normal “wet” conditions at the sampling sites of Fig. 1. The squares are the mean exhalation rates for all “wet” transects at the respective sites. (b) Same as (a) but for dry conditions during summer 1999 (note the different222Rn scales). The numbers given in the legends are the mean values in Bq m−2h−1for soil types A, B and C, respectively, for the different transects.
type A (3.3±0.9 Bq m−2h−1) are generally lower by a factor of two or more compared to type B (7.9± 2.1 Bq m−2h−1). This ratio changes little between the different transects. The mean exhalation rate from soil type C (3.6±1.3 Bq m−2h−1) in August 2000 was in the range of exhalation rates from type A. Contrary to the normally “wet” situation in Fyodorovskoye, with a water table depth between 5 cm and about 70 cm in the footprint of the tower, summer 1999 (July and August) was extraordinary dry. A much deeper water table depth during this campaign manifests itself in a seven-fold higher222Rn exhalation rate from soil type
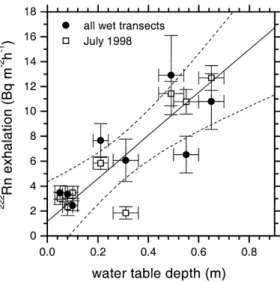
Fig. 3. Relation between222Rn exhalation rates and water table depth. The solid line shows the linear regression calcu- lated through the July 1998 data when water table depth was actually measured. Assuming that the water table depths are similar during all wet transects, the mean222Rn exhalation rates (full circles) also follow this relation. Dashed lines give the lower and upper limits of the 95% confidence interval.
B (54.2±7.0 Bq m−2h−1). The rates from soil type A (4.7±1.2 Bq m−2h−1) were only about 50% higher than during wet conditions.
The strong relation between water table depth and
222Rn exhalation rate is also visible in Fig. 3. Here the
222Rn exhalation rates from the different sites sampled in July 1998 are plotted against the water table depth, which was roughly determined with a simple bubbling tube. As shown by D¨orr and M¨unnich (1990), the theo- retical222Rn concentration profilecRn(z) in a soil with a homogeneous222Rn emanation rate is described by a steady-state depth profile
cRn(z)=c∞[1−exp(−z/¯z)] (1) with the equilibrium concentration c∞ observed at large depths. Depending on soil texture, the charac- teristic penetration depth ¯z was deduced as 0.3 m in very wet and fine-grained soils and about 1.7 m in sandy soils with water table depths well below several metres (D¨orr and M¨unnich, 1990). The exhalation rate at the soil surface jRn(z=0) can be derived from the profile and from the permeability (molecular diffusion coefficient)PRnin the soil air as
jRn(z=0)= −PRnc∞
¯
z . (2)
At our measurement sites where the water table depths were very shallow222Rn saturation in the soil air was already reached at several centimetres, and the re- spective ¯z, and also the equilibrium concentrationc∞, are very low. Moreover, the permeabilityPRnis small under high soil humidity, which all together lead to very small222Rn exhalation rates. Only during sum- mer 1999, when the water table at sampling sites of soil type B decreased to several metres below the surface, the respective ¯zand, therewithc∞, achieved
“normal” values with222Rn exhalation rates in the same order as observed by D¨orr and M¨unnich (1990) at dry sites with sandy–loamy soil types in Western Europe.
3.2. Long-term222Rn activity observations at Fyodorovskoye from July 1998 to July 2000 in comparison to the Heidelberg measurements The continuous record of222Rn activities derived from214Po measurements at the Fyodorovskoye field site at 26.3 m above ground is shown in Fig. 4a.
During the second half of 1999, due to data acqui- sition problems observations are only available dur- ing the intensive campaigns in July and October (see also Figs. 5b and c). The atmospheric 222Rn activ- ity at this forested site generally varies between 0.5 and 10 Bq m−3. The lower envelope of the record changes on synoptic timescales (3–5 d) between 0.5 and about 6 Bq m−3; lowest activities are generally observed in spring and summer while the highest val- ues are found from October to December. In the pe- riod from April until September, we generally observe regular diurnal cycles with mean peak-to-peak am- plitudes of 2–3 Bq m−3. For comparison, Fig. 4b shows the continuous record of half-hourly atmo- spheric222Rn activity data at the Heidelberg measure- ment site. Here the activity concentration is gener- ally higher than at Fyodorovskoye and varies between 2 and 30 Bq m−3, with large diurnal changes during the summer months. These diurnal changes are gen- erally higher by a factor of 2–3 if compared to the Fyodorovskoye forest site. The minimum activities in Heidelberg vary between 2 and 5 Bq m−3 during the summer months. During autumn and winter we frequently observe longer-lasting episodes of222Rn- enriched continental air masses with minimum ac- tivity levels as high as 20 Bq m−3. The Heidelberg
222Rn record has already been used in several studies to estimate radon-derived fluxes of various trace gas
Fig. 4. (a) Atmospheric222Rn activity observed at 26.3 m above ground at the Fyodorovskoye forest site. (b) Same as (a) but for Heidelberg at 20 m above ground. (Half-hourly data have been smoothed over three points to derive an effective time resolution of 1 h.)
emissions (Levin et al., 1989; 1999; Schmidt et al., 2001).
Summarising the comparison of atmospheric222Rn activities between Fyodorovskoye and Heidelberg we can conclude that not only baseline activities but also the diurnal amplitudes in summer are gener- ally higher in Heidelberg by a factor of 2–3 than at Fyodorovskoye. Qualitatively, this is not surprising if we compare the soil exhalation rates in the foot- print of the two sites. While mean soil exhalation rates in the Heidelberg catchment area are in the order of 50–60 Bq m−2h−1, they are only in the order of 3–
8 Bq m−2h−1in the footprint of Fyodorovskoye dur- ing most of the time (wet conditions, see Section 3.1).
If, as a first-order approach, we can scale observed atmospheric activities with the ground-level fluxes in the respective footprints, a general concentration dif- ference of almost one order of magnitude would be expected. The fact that Fyodorovskoye atmospheric activities are only lower by a factor of 2–3 compared to Heidelberg indicates a discrepancy by a factor of about 3–5 between direct emissions and atmospheric con- centrations. Excluding systematic errors of this mag-
nitude in our atmospheric measurements but also in soil exhalation rates, this discrepancy can only be ex- plained by an underestimation of the catchment area of the Fyodorovskoye tower. Obviously, the catchment area in reality is much larger than that shown in Fig. 1, and approximated by a radius of 1–2 km around the measurement site (Schuepp et al., 2000; Rebmann and Kolle, 2000). From an inspection of soil and vegetation types in the larger area around the measurement site (50–100 km radius, a distance which is accessible dur- ing half a day with a mean wind velocity of 2 m s−1), it is quite plausible that the222Rn exhalation rates are considerably higher there, largely contributing to the general222Rn activity level at the Fyodorovskoye mea- surement site.
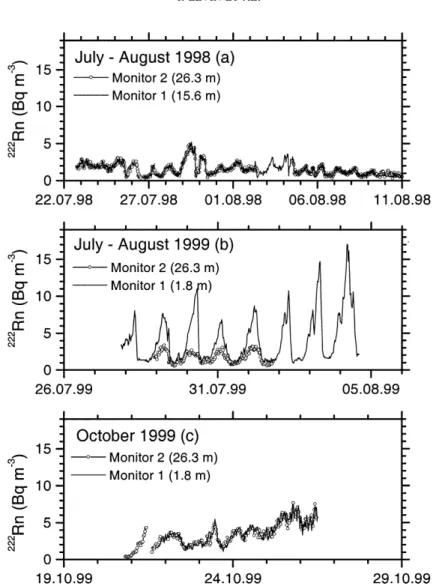
3.3. 222Rn activity observations at two heights during the summer and autumn field campaigns During intensive field campaigns at Fyodorovskoye,
222Rn observations have been performed at two heights. At the start of the first campaign, at this new measurement tower no information about the
Fig. 5. (a) Atmospheric222Rn activity observed at 26.3 and 15.6 m above ground during the July/August 1998 field campaign (smoothing as in Fig. 4). The data of the two heights are indistinguishable. (b) Atmospheric222Rn activity observed at 26.3 and 1.8 m above ground during the July/August 1999 field campaign (smoothing as in Fig. 4). (c) Same as (b) but for the autumn field campaign in October 1999 (smoothing as in Fig. 4). Similar to the summer 1998 campaign, the data of the two heights are indistinguishable.
micrometeorological situation within the canopy of the forest had been available. Therefore, we chose as a second measurement level a height of 15.6 m above ground, the lower limit of the upper canopy level.
Fig. 5a shows the measurements at the two levels.
No significant gradient is observed between these two heights. This finding has the following consequences:
(1) Obviously, during both day and night the upper part of the forest canopy is well mixed. (2) Concerning the unknown disequilibrium factor between222Rn and
its daughters, the striking similarity between the two records suggests that the disequilibrium factor does not significantly differ between these two heights (see also Section 2.1.2).
For the summer and autumn 1999 field campaigns the second observational level was lowered to 1.8 m above ground. The222Rn activities during these two campaigns are plotted in Figs. 5b and 5c. During the summer 1999 season we now observe very strong night-time gradients, but during daytime again the
gradients almost disappear. The conditions change again in the October 1999 field campaign when during dayandnight the gradient between 1.8 and 26.3 m dis- appears. There are two possible explanations for this unexpected behaviour in October 1999: (1) Despite a measurable222Rn exhalation rate at the ground, due to strong vertical mixing no vertical gradient could be established, and (2) during wet conditions, the222Rn exhalation rate in the immediate footprint of the tower can be neglected compared to the 222Rn emissions originating from a larger catchment area. Both expla- nations are in accordance with the results from the summer 1998 and summer 1999 campaigns. In sum- mer 1998, the soil exhalation rate is similar to that in October 1999, and no vertical gradient is observed. In summer 1999, the222Rn exhalation rates are larger by a factor of about 6–7 than during wet conditions, and a significant vertical gradient can be established, at least during the night.
4. Conclusions
Atmospheric222Rn monitoring based on continuous sampling andα-counting of222Rn and220Rn decay products is shown (1) to give reliable results at hourly resolution with a typical uncertainty (including dise- quilibrium problems) of±20%, (2) to be well suited for field studies, dedicated to the budgeting of (long- lived) trace gases in boundary layer air. Application of the instrument at two regions, Fyodorovskoye in the European Taiga and Heidelberg in Germany, signifi- cantly differing with respect to soil type, hydrological conditions and plant cover, revealed that reliable and representative observation of the spatio-temporal pat- tern of the222Rn exhalation rate is mandatory to an un- derstanding of the observed atmospheric222Rn activity levels. This is even more important if the data are to be used for mesoscale model validation (Chevillard et al., 2002) or to successfully apply the radon tracer method (Langend¨orfer, 2002). Our atmospheric222Rn obser- vations from Fyodorovskoye Forest reserve, in combi- nation with measured soil exhalation rates in the imme- diate neighbourhood (“eddy correlation footprint”) of the measurement site, indicate that continuous concen- tration measurements, even if they are performed only at heights of 20–30 m above ground, probably have a catchment area or area of immediate influence of sev- eral ten to hundred kilometres. This is considerably larger than what is estimated with classical footprint models which have been developed, i.e., for eddy cor-
relation towers and associated micro-meteorological studies. These give footprint areas which are only in the order of several kilometres around the respective measurement site.
5. Acknowledgements
Measurements at the Fyodorovskoye Forest site have been made possible with the logistic support from IPEE, Moscow (Prof. N. N. Vygodskaya), the Central Forest Reserve, Fyodorovskoye, and MPI for Biogeo- chemistry, Jena (Prof. E.-D. Schulze). We thank all field workers at Fyodorovskoye Forest Reserve for their very helpful support. T. Minaeva provided the original map of Fig. 1. Her expertise and advice in choosing suitable sites for222Rn exhalation measure- ments is gratefully acknowledged. This project has been partially funded by the European Commission under contracts EV5V-0048 and ENV4-CT-97-0491.
6. Appendix
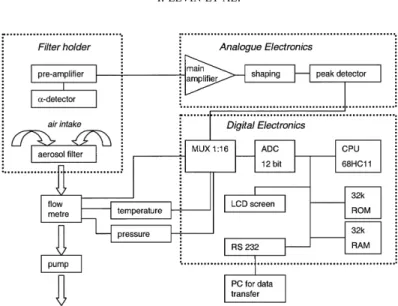
6.1. General description of the Radon Monitor set up Figure 6 shows the schematics of the Heidelberg
222Rn monitor. At a flow rate of about 0.5–1.5 m3h−1 ambient air is continuously pumped through a quartz fibre filter (Whatman QMA,∅47 mm); the flow rate is monitored with a flow meter (MKS type 0258CC- 50000GV, 50 L min−1or EL-FLOW F112AC-HAD- 22-V). The222Rn (and220Rn) daughters218Po (αE= 6.0 MeV) and214Po (αE=7.7 MeV) collected on the filter are measured in situ with a surface barrier detec- tor (Canberra CAM AB 900 mm2active surface, en- ergy resolution 50 keV at anα-energy of 5.486 MeV).
A pre-amplifier converts the detector pulses into am- plified voltage signals which can then be transmitted via cable over distances of up to 100 m. This allows physical separation of the filter head from the main electronic board, and thus relatively short tubing con- nections between filter holder and ambient air. The signal is further amplified and processed by dedicated analogue and digital electronics.
A typicalα-spectrum of the222Rn and220Rn daugh- ters collected on the quartz filter within a 1 h inte- gration time is presented in Fig. 7. Due to various absorption mechanisms, theα-spectrum is distorted to lower energies (low-energy tailing). Three max- ima are clearly distinguishable in the spectrum,
Fig. 6. Schematics of the Heidelberg radon monitor.
Fig. 7. Typicalα-spectrum of the222Rn and220Rn daugh- ters collected in Heidelberg on a quartz glass filter with an integration time of 1 h. The different isotopes and the thresh- olds for evaluation of the spectrum are also marked on the diagram.
representing theα-activity of212Po,214Po and a mix- ture of218Po and212Bi. Depending on the time of day and the degree of filter loading, the ratio between the
212Po (220Rn daughter) and214Po (222Rn daughter) may vary by nearly one order of magnitude. However, the
220Rn-derived212Po peak can be easily resolved, and, hence separated from the214Po peak, allowing for an accurate determination of the222Rn daughter activity on the filter.
Overall technical data: Detection limit at 10%
counting error with 1 h time resolution: 0.2 Bq m−3. Power consumption: monitor without pump: 45–
50 mA at 230 V. Dimensions and weight: electronic rack: 0.35×0.30×0.15 m, 3 kg; filter head: 0.1× 0.15×0.2 m, 1 kg.
6.2. Theoretical determination of the214Po activity
214Poaαin the atmosphere from filter measurements214PoAα
The temporal change of the radionuclide concen- trationiNon a filter depends on its concentrationinin the atmosphere and its deposition rate on the filter. It is described by a system of generalised Bateman equa- tions (Schumann, 1956) (i−1Nis the daughter of radio nuclideiN):
diN
dt =εQin+i−1Ni−1λ−iNiλ, (A1) whereεis the filter efficiency,Qis the air flow rate (m3 s−1) through the filter, andiλare the decay constants of the individual radio nuclidesi. The atmospheric concentrationinis thus
in= 1
εQ diN
dt +iNiλ−i−1Ni−1λ
, (A2)
and the atmospheric activityiais
ia=iniλ= 1 εQ
d(iNiλ)
dt +iλ(iNiλ−i−1Ni−1λ)
= 1 εQ
diA
dt +iλ(iA−i−1A)
. (A3)
Due to its very short lifetime of214Poτ=1/214Poλ= 237µs,214Po is not directly accumulated on the filter but generated through its accumulated precursor214Bi.
Also, at any instant there is radioactive equilibrium between214Po and 214Bi activity in the atmosphere (214Poa=214Bia) and on the filter (214PoA=214BiA); thus
214Poa=214Bia= 1 εQ
d(214BiN214Biλ)
dt +214Biλ
×(214BiN214Biλ−214PbN214Pbλ)
. (A4)
Moreover, it can be shown that, even at an instanta- neous change of the atmospheric222Rn activity,214PbA and214BiAare almost at equilibrium (the maximum de- viation is in the order of 18% and in most cases it is close to 5% (Stockburger, 1960)) so that we can sub- stitute214PbN214PbλbyX214BiN214Biλwith
X= 218Poτ+214Pbτ
218Poτ+214Pbτ+214Biτ =0.6. (A5) Therefore, substituting Eq. (A5) in Eq. (A4), we derive for the atmospheric214Bi (=214Po) activity:
214Bi
a= p εQ
1 p
d214BiA dt +214BiA
(A6) with
1
p=218Poτ+214Pbτ+214Biτ and
p= X
214Biλ.
The calculation of the atmospheric214Po activity there- fore needs the determination of the214Bi filter activity
214BiA(=214PoA) as well as its rate of change at the time of the activity measurement.
6.3. Experimental determination of the214Po activity
214PoAαon the filter
The accumulatedα-counts on the filter derived from
222Rn daughters (222RnM=214PoM+218PoM) are cal- culated from the total measuredα-countstotalMon the filter according to Eq. (A7) (Fig. 7):
222Rn
M=totalM−noiseM−220RnM (A7)
with 220RnM being the 220Rn daughter counts (220RnM=212PoM+212BiM) on the filter. 220RnM is
determined through the212Po counts on the filter with αE>7.7 MeV using the following approximation:
220RnM = M(αE>7.7 MeV)ctail(212Po)
×rbranch(212Bi;212Po) (A8)
The factor ctail(212Po)=1/(0.778±0.015) accounts for 212Po counts overlapping with the 214Po peak (this factor has been determined empirically for var- ious ratios of 214Po and 212Po activities). The fac- torrbranch(212Bi; 212Po)=1/0.6407 results from the branching ratio for212Bi decay on the filter (35.93% by directα-decay and 64.07% via decay of212Po), which allows to calculate the total contribution ofα-particles from decay of212Bi:
rbranch= 212Bi+212Po
212Po = 1
0.6407=1.56.
Moreover, on the filter theα-counts of both222Rn daughters,214Po (214PoM) and218Po (218PoM), are mea- sured, and it is necessary to also separate the218Po counts218PoM from the total222Rn daughter counts
222RnMto derive214PoM. The low energy tailing of the α-spectrum does, however, not allow spectroscopic separation of218Mα. Therefore, radioactive equilib- rium is assumed between214Po and218Po, and the re- spective counts218PoM=214PoM/17.26=5.79% are subtracted from the total222Rn daughter counts on the filter222RnM. The214Po counts on the filter are thus determined as:
214Po
M=0.942222RnM (A9)
and the214Po activity214PoAon the filter is
214PoA= 214PoM
T (A10)
withT being the acquisition time. The mean214PoA filter activities are determined from the spectra in each measurement interval (integrated over 30 min), addi- tionally taking into account the relative solid angle of the detector:
214PoA= 1
0.942(totalM−noiseM−M(αE>7.7 MeV)ctailrbranch)
T . (A11)
This solid angle has been determined from the ge- ometry of the filter holder, i.e. the active surface of the detector (RD=1.693 cm), the aerosol-loaded sur- face of the filter (RF=1.704 cm) and the distance between the filter and the detector (filter and detector surfaces are mounted in parallel). For the actual dis- tance between filter and the detector in the Heidelberg monitor ofd=0.565 cm the solid angle was calcu- lated as 0.2650 (Cuntz, 1997). For intercomparison of the monitors the combined individual solid angle and detector efficiency are checked through measurement of anα-source (241Am,αE=5.49 MeV) with a sim- ilar geometry as an aerosol filter. This measurement is regularly repeated to check the efficiency of theα- detector.
6.4 Intercomparison experiments
Two intercomparison experiments have been con- ducted with the Laboratoire des Sciences du Climat
et de l’Environnement, Gif-sur-Yvette, France, at Gif-sur-Yvette close to Paris in April 1998 and at Mace Head, Ireland (53◦N, 10◦W, 5 m a.s.l.), in October 2000. The French measurement system also deter- mines 222Rn via its short-lived daughters (Polian et al., 1986). For a wide range of ambient activities between 0.1 and 10 Bq m−3, both experiments yielded very good agreement between the two measurement systems of better than±10%. Another intercompari- son experiment was performed with the Bundesamt f¨ur Strahlenschutz, Institut f¨ur Atmosph¨arische Radioak- tivit¨at, Freiburg, Germany, comparing their222Rn mea- surements derived fromα- andβ-activity counting of
222Rn decay products accumulated on a static filter (Stockburger 1960) with those of our radon monitor at the Schauinsland station in the Black Forest (48◦N, 8◦E, 1205 m a.s.l.) during two weeks in March 1997.
Ambient activities varied between 0.5 and 7 Bq m−3. Within a standard deviation of±5%, no significant dif- ferences were observed between the two measurement systems (Cuntz, 1997).
REFERENCES Biraud, S., Ciais, P., Ramonet, M., Simmons, P., Kazan,
V., Monfray, P., O’Doherty, S., Spain, G. and Jennings, S. J. 2000. European greenhouse gas emissions estimated from continuous atmospheric measurements and Radon- 222 at Mace Head, Ireland.J. Geophys. Res.105, 1351–
1366.
Chevillard, A., Ciais, P., Karstens, U., Heimann, M., Schmidt, M., Levin, I., Jacob, D., Podzun, R., Kazan, V., Sartorius, H. and Weingartner, E. 2002. Transport of222Rn using the regional model REMO: A detailed comparison with measurements over Europe.Tellus54B, this issue.
Cuntz, M. 1997. The Heidelberg222Rn monitor: Calibration, optimisation, application. Thesis, Institut f¨ur Umwelt- physik, University of Heidelberg, Germany (in German).
D¨orr, H., Kromer, B., Levin, I., M¨unnich, K. O. and Volpp, H. J. 1983. CO2and radon-222 as tracers for atmospheric transport.J. Geophys. Res.88, 1309–1313.
D¨orr, H. and M¨unnich, K. O. 1990.222Rn flux and soil air con- centration profiles in West Germany. Soil222Rn as tracer for gas transport in the unsaturated soil zone.Tellus42B, 20–28.
Fischer, K. 1976. A slow-pulse ionization chamber for the measurementt of radon in air. Thesis, Institut f¨ur Umweltphysik, University of Heidelberg, Germany (in German).
Jacobi, W. and Andr´e, K. 1963. The vertical distribution of
222radon,220radon and their decay products in the atmo- sphere.J. Geophys. Res.68, 3799–3814.
Kuhlmann, A. J., Worthy, D., Trivett, N. B. A. and Levin, I. 1998. Methane emissions from a wetland region within the Hudson Bay Lowland: an atmospheric approach.J.
Geophys. Res.103, 16 009–16 016.
Langend¨orfer, U., Cuntz, M., Ciais, P., Peylin, P., Bariac, T., Milukova, I., Kolle, O., Naegler, T. and Levin, I. 2002.
Modelling of biospheric CO2gross fluxes via oxygen iso- topes: a222Rn-calibrated box model approach.Tellus54B, this issue.
Levin, I. 1984. Atmospheric CO2, sources and sinks on the European continent.PhD-Thesis, University of Heidel- berg, Germany (in German).
Levin, I., Schuchard, J., Kromer, B. and M¨unnich, K. O. 1989.
The continental European Suess effect.Radiocarbon31, 431–440.
Levin, I., Glatzel-Mattheier, H., Marik, T., Cuntz, M., Schmidt, M. and Worthy, D. E. 1999. Verification of Ger- man methane emission inventories and their recent changes based on atmospheric observations.J. Geophys. Res.104, 3447–3456.
Nazaroff, W. N. 1992. Radon transport from soil to air.Rev.
Geophys.30, 137–160.
Polian, G., Lambert, G., Ardouin, B. and Jegou, A. 1996.
Long-range transport of continental radon in Subantarctic and Antarctic areas.Tellus38B, 178–189.
Porstend¨orfer, J., Butterweck, G. and Reineking, A. 1991.
Diurnal variation of the concentrations of radon and its short-lived daughters in the atmosphere near ground.At- mos. Environ.25, 709–713.
Rebmann, C. and Kolle, O. 2000.Documentation of EDDY software. Max Planck Institut f¨ur Biogeochemie, Jena, Germany.
Reineking, A. and Porstend¨orfer, J. 1990. Unattached frac- tion of short-lived Rn decay products in indoor and outdoor environments: an improved single-screen method and re- sults.Health Phys.58, 715–727.
Roether, W. and Kromer, B. 1978. Field determination of air-sea gas exchange by continuous measurement of radon- 222.Pageoph.116, 476–485.
Schery, S. D., Gaeddert, D. H. and Wilkening, M. H. 1984.
Factors effecting exhalation of radon from gravelly, sandy loam.J. Geophys. Res.89, 7299–7309.
Schery, S. D. and Wasiolek, P. T. 1993. A two-particle-size model and measurements of radon progeny near the Earth’s surface.J. Geophys. Res.98, 22 915–22 923.
Schmidt, M., Glatzel-Mattheier, H., Sartorius, H., Worthy, D.
E. and Levin, I. 2001. Western European N2O emissions – a top down approach based on atmospheric observations.
J. Geophys. Res.106, 5507–5516.
Schuepp, P. H., Leclerc, M. Y., MacPherson, J. I. and Desjardins, R. L. 2000. Footprint prediction of scalar fluxes from analytical solutions of the diffusion equation.
Boundary-Layer Meteorol.50, 355–373.
Sch¨ußler, W. 1996.Effective parameters to determine gas- exchange between soil and atmosphere. PhD Thesis, Uni- versity of Heidelberg, Germany (in German).
Schumann, G. 1956. Untersuchung der Radioaktivit¨at der Atmosph¨are mit der Filtermethode.Archiv f¨ur Meteorol., Geophys. Bioklimatol. Ser. A9, 205–223.
Stockburger, H. 1960.Continuous registration of the radon-, thorium-B and decay product activity of atmospheric air.
PhD Thesis, University of Freiburg, Germany (in German).
Verclas, S. 1994.Set-up and test of a monitor to measure the atmospheric222radon daughter activity, and first mea- surements. Thesis, Institut f¨ur Umweltphysik, University of Heidelberg, Germany (in German).
Volpp, H.-J. 1984.Investigation of large scale atmospheric transport in Central Europe with radon-222. PhD Thesis, University of Heidelberg, Germany (in German).
Wilkening, M. H. and Clements, W. E. 1975. Radon-222 from the ocean surface.J. Geophys. Res.80, 3828–3830.
Wilson, S. R., Dick, A. L., Fraser, P. J. and Whittlestone, S. 1997. Nitrous oxide flux estimates for south-eastern Australia.J. Atmos. Chem.26, 169–188.
Whittlestone, S. 1990. Radon daughter disequilibria in the lower marine boundary layer.J. Atmos. Chem.11, 27–42.