Research Collection
Journal Article
Highly efficient THz four-wave mixing in doped silicon
Author(s):
Dessmann, Nils; Le, Nguyen H.; Eless, Viktoria; Chick, Steven; Saeedi, Kamyar; Perez-Delgado, Alberto;
Pavlov, Sergey G.; van der Meer, Alexander F.G.; Litvinenko, Konstantin L.; Galbraith, Ian; Abrosimov, Nikolay V.; Riemann, Helge; Pidgeon, Carl R.; Aeppli, Gabriel; Redlich, Britta; Murdin, Benedict N.
Publication Date:
2021-12
Permanent Link:
https://doi.org/10.3929/ethz-b-000478978
Originally published in:
Light: Science & Applications 10(1), http://doi.org/10.1038/s41377-021-00509-6
Rights / License:
Creative Commons Attribution 4.0 International
This page was generated automatically upon download from the ETH Zurich Research Collection. For more information please consult the Terms of use.
ETH Library
A R T I C L E O p e n A c c e s s
Highly ef fi cient THz four-wave mixing in doped silicon
Nils Dessmann1, Nguyen H. Le 2, Viktoria Eless1, Steven Chick2, Kamyar Saeedi1, Alberto Perez-Delgado2,
Sergey G. Pavlov3, Alexander F. G. van der Meer1, Konstantin L. Litvinenko 2, Ian Galbraith 4, Nikolay V. Abrosimov5, Helge Riemann5, Carl R. Pidgeon4, Gabriel Aeppli6,7,8, Britta Redlich1and Benedict N. Murdin 2
Abstract
Third-order non-linearities are important because they allow control over light pulses in ubiquitous high-quality centro-symmetric materials like silicon and silica. Degenerate four-wave mixing provides a direct measure of the third- order non-linear sheet susceptibilityχ(3)L(where Lrepresents the material thickness) as well as technological possibilities such as optically gated detection and emission of photons. Using picosecond pulses from a free electron laser, we show that silicon doped with P or Bi has a value ofχ(3)Lin the THz domain that is higher than that reported for any other material in any wavelength band. The immediate implication of our results is the efficient generation of intense coherent THz light via upconversion (also aχ(3)process), and they open the door to exploitation of non- degenerate mixing and optical nonlinearities beyond the perturbative regime.
Introduction
The lowest-order non-linearity in centrosymmetric materials isχ(3), which describes that part of the response that is third order in the amplitude of the driving beams1. It is responsible for effects like degenerate four-wave mixing (DFWM), in which all four photons have the same energy and two are excited and two are emitted, Fig. 1. A substantial degenerate (or near-degenerate) FWM response is a prerequisite for applications of media in active optical systems ranging from modulators2,3 to quantum repeaters4–6.
Although many non-linear effects have been demon- strated in the THz domain7, there are no quantitative measurements of susceptibilities for transparent bulk materials—indeed there are very few values ofχ(3)avail- able for any material in this part of the spectrum8–11.
Doped silicon at low temperature has already been shown to produce giant values for the imaginary part of the non-linear refractive index (via multi-photon absorption)12, and there have been theoretical predic- tions that the real part of the non-linear refractive index is also very large13 and of large experimental non- linearities14but there have been no experimental reports ofχ(3)till now, largely because of the challenge of quan- titative non-linear THz metrology.
Results Experiment
We performed non-collinear DFWM experiments as illustrated in Fig. 1, using THz pulses from the free electron laser FELIX, both on and off resonance with the 1s→2p transitions in Si:P and Si:Bi at 10 K. We chose this geometry because it enables the measure- ment of dynamical relaxation and dephasing times needed to make detailed theoretical comparisons, under identical experimental conditions. It is very difficult to obtain clean beam profiles with low dif- fraction in the THz regime, and great care was taken in avoiding apertures and optical imperfections in order
© The Author(s) 2021
Open AccessThis article is licensed under a Creative Commons Attribution 4.0 International License, which permits use, sharing, adaptation, distribution and reproduction in any medium or format, as long as you give appropriate credit to the original author(s) and the source, provide a link to the Creative Commons license, and indicate if changes were made. The images or other third party material in this article are included in the article’s Creative Commons license, unless indicated otherwise in a credit line to the material. If material is not included in the article’s Creative Commons license and your intended use is not permitted by statutory regulation or exceeds the permitted use, you will need to obtain permission directly from the copyright holder. To view a copy of this license, visithttp://creativecommons.org/licenses/by/4.0/.
Correspondence: Nils Dessmann (nils.dessmann@ru.nl) or Nguyen H. Le (h.le@surrey.ac.uk)
1Radboud University, Institute for Molecules and Materials, HFML-FELIX, Nijmegen, The Netherlands
2Advanced Technology Institute and Department of Physics, University of Surrey, Guildford GU2 7XH, UK
Full list of author information is available at the end of the article
1234567890():,; 1234567890():,; 1234567890():,; 1234567890():,;
to obtain them, as shown in Fig.1. Care was also taken to accurately calibrate absolute pulse energies. It may be seen immediately from the relative strength of the output beam (k3) in Fig. 1 that the DFWM process is very efficient.
In the plane-wave limit (i.e., for infinitely long pulses and infinitely broad beams), the complex polarisation amplitude of the generated beam (P3) is related to the complexfield amplitudes of the input beams (F1;2) inside the material by
P3¼ϵ0χð3ÞF1F22 ð1Þ i.e. the intensity of the output is determined byχ(3). The definition of χ(3) in Eq. (1) suggests that, for a pulsed experiment, the internal pulse energies Ei of the three beamski(Fig. 1) are related by
E3¼E1E22=E2c ð2Þ where Ec is a constant that is inversely proportional to χ(3)LandLis the sample thickness.Ecdefined by Eq. (2) is a critical pulse energy at which the output would become equal to the inputs, and we generally stay well below this limit so as to avoid the need to consider higher-order non-linear effects.
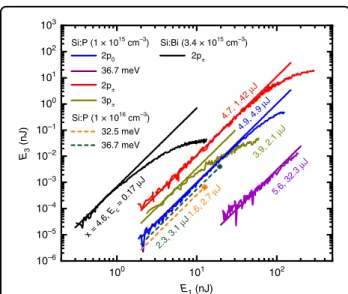
We variedE1keeping the ratioE2/E1fixed, as shown in Fig. 2, and a clear cubic dependence is observed at low pulse energy. The resulting values of Ec are shown on Fig.2and given in Table1. At high intensity, a saturation occurs for resonant cases, due to an intensity-dependent reduction in dephasing time15, which reducesχ(3).
Conversion ofEctoχ(3)
Away from resonance and in the limit of long pulses, the relationship between Ec (given on Fig. 2) and χ(3) has a straightforward dependence on the geometry and pulse duration. For short pulses, the dynamics are important, and on resonance there is loss that attenuates the pumps and the output, which must also be taken into account.
We integrated the equations describing propagation of light through a lossy non-linear medium for the case of inhomogeneous broadening andfinite pulse durations to find χ(3) from Ec (see Supplementary Materials Section IV). In this case, the conversion from the experimentalEc of Fig.2to the value ofχ(3)is, for a beam with a Gaussian spatial profile,
Ec¼33=4 ffiffiffiffiffiffi 2π
p n2λ0r20t0f=Z0χð3ÞL ð3Þ
wherenis the refractive index (which we took to ben= 3.4), λ0 is the free-space wavelength, Z0 is the
Normalised intensity
0 0.5 1
k3
2k2 k1 k1 k2
a
b
Δ
|e〉
|g〉
k3 = 2k2–k1
2
2 1
3
5
0
y (mm)
×3
–5 ×0.2 –10
Sample
–5 φ (°)0
5 10
Fig. 1 The degenerate four-wave mixing geometry. aThe energy- level scheme for DFWM with two excitation photons from beam 2, a stimulated emission from beam 1 and an output photon in beam 3.
The left hand process involves two virtual excited states, and the right hand permutation is the strongest near to a resonance with the ground statej ig and excited statej ie.bA camera image of the beam at the sample position is shown superimposed on the sample. Far- field images were taken by scanning an iris after collimating, which requires careful conversion from space to angle. Each image has been normalised to the peak power density, and the scale factors for the far-field images are indicated relative to beam 1. Note that the far-field image of the beam 3 has only been scaled by a very small factor in this example (×3), i.e. the DFWM efficiency is very high. The phase matching condition is also shown
103 102
102 101
101 100
100 10–1
10–2 10–3 10–4 10–5 10–6
x = 4.6, Ec = 0.17
µJ
4.7, 1.42 µJ 4.9, 4.9
µJ
3.9, 2.1 µJ
5.6, 32.3 µJ 2p0
36.7 meV 2p±
2p±
3p±
32.5 meV 36.7 meV E3 (nJ)
E1 (nJ) Si:Bi (3.4 × 1015 cm–3) Si:P (1 × 1015 cm–3)
Si:P (1 × 1016 cm–3)
2.3, 3.1 µJ 1.6, 2.7
µJ
Fig. 2 Internal DFWM conversion efficiency for different samples, both on and off resonance.The different doping densities (nD) and samples are given in the legend. Each curve is labelled by either the laser photon energy (hωin meV) or the resonant transition being excited. The ratio between pump pulse energiesx=E2/E1was kept constant in each case: values ofxare given on each data set. The data are very close to cubic (E3¼x2E31=E2cas expected), and the solid lines arefits to the low intensity portion. Thefitted values ofEcare also indicated. For the high density Si:P sample, only one intensity was measured at each laser frequency and a cubic dependence (dashed lines) is shown for comparison with the other measurements Dessmann et al.Light: Science & Applications (2021) 10:71 Page 2 of 6
characteristic impedance of free space, and r0 and t0 are the root mean square (r.m.s.) beam radius and pulse duration, respectively (at which the intensity has fallen by 1=pffiffie
).
The dimensionless factorfappearing in Eq. (3) depends on the loss and also the pulse shape and duration relative to the dynamical timescales of the system. The equation defines fin such a way thatf=1 when the loss is negli- gible (which is our case when far from resonance) and in the monochromatic limit of very long pulses with Gaus- sian temporal profile (t0≫T1,2, i.e. pulse duration much larger than the population decay,T1, and dephasing time, T2, of the system). For negligible loss but with pulses that are very short compared with the inverse line-width, then f becomes of order T1/t0, which can evidently be larger
than unity (effectively replacing t0 in Eq. (3) with T1 because now the atomic polarisationP3lasts much longer than the drive pulses). For significant loss,fbecomes very large and sample thickness dependent.
Using perturbation theory for temporally overlapping, weak beams within the two-level approximation1, and averaging over the distribution for a Gaussian (fully inhomogeneously broadened) line, we calculated values of ffor our experimental circumstances. See Supplementary Materials for more details. The results are shown in Table 1. As expected, the off-resonant values of f in Table 1 are of order unity and are not significantly affected by the details of the model chosen. They are slightly greater than unity primarily because of the short pulses. The on-resonance values offin Table1are large primarily because of the loss. The two-level model is expected to give a reasonably good estimate offin reso- nant cases because there is one dominant transition: the one shown in Fig.1a1.
The experimental values ofEcfrom Fig.2along with the calculated f have been converted to values of χð3Þexpt in Table1.
Theory
We now obtain theoretical estimates forχ(3)to compare with the experimental results. Silicon donors at low temperature are hydrogen-like, with a series of levels and orbitals closely resembling the Rydberg series 1s, 2p0, etc.16. The energies are scaled down and the orbital sizes scaled up, thanks to the small effective mass and large dielectric constant. The large orbitals give a commensu- rately large dipole moment, and this has a very large influence on non-linear optical coefficients.
Using the same two-level model mentioned above, the following limits may be found (see Supplementary Materials) for the contribution per bound electron in the vicinity of its resonance:
χð3Þ nD μ4eg
ϵ0h3´ T1T2T2; if Δ¼0 T1T12 Δ3; if jΔj T12
ð4Þ
wherenDis the donor concentration,hΔis the detuning from resonance in energy andμeg ¼ejhψejrjψgi:ϵj is the component of the dipole moment transition matrix element between ground and excited states along the polarisation direction, ϵ. The total dephasing time T2 is defined by the total absorption line half-width in energy,
h=T2, which was obtained from the small-signal absorp- tion spectrum. The population relaxation time, T1, was obtained by performing a pump–probe experiment17, and the homogeneous dephasing time,T2, was obtained using a photon echo experiment1,15. The results are shown in Table 1. These time-resolved experiments were per- formed with the same set-up that was used for the main Table 1 Third-order susceptibility for Si:P and Si:Bi both
on and off-resonance
Si:P Si:Bi
hω(meV) 32.5 34.0 36.7 39.2 42.5 64.5
– (2p0) – (2p±) (3p±) (2p±)
T R T T R R R
L(mm) 0.6 0.5 0.5 0.6 0.5 0.5 1
nD 10 1.0 1.0 10 1.0 1.0 3.4
x 1.6 4.7 5.6 2.3 4.6 3.9 4.9
r0(mm) 0.53 0.6 0.6 0.53 0.6 0.6 0.64
Ec(μJ) 2.7 4.9 32.3 1.1 1.4 2.1 0.17
f 3.0 28 6.1 6.2 310 27 310
χð3ÞexptL 0.13 0.80 0.025 0.58 27 1.5 160
χð3Þexpt 0.22 1.6 0.050 0.96 54 2.9 160
χð3Þexpt=nD 0.022 1.6 0.050 0.096 54 2.9 46
μeg(e.nm) – 0.37 – – 0.71 0.32 0.34
h/T1(μeV) – 11 – – 5 3.9a 19
h/T2(μeV) – 26 – – 26 109 44
h=T2(μeV) – 115 – – 115b 194 165
χð3Þtheory=nD 0.0024 100 0.015 3100 23 18
hωis the photon energy, and labels R and T refer to resonant and transparent excitations. Values ofμegare all taken from ref.29. All values forT1,2were found from photon echo and pump–probe performed under the DFWM conditions, except:ataken from ref.21. All values of the half-width,h=T2, were found from the small-signal absorption spectrum, except:bassumed equal to the 2p0half- width.xis the ratio of the intensities of the pump pulses from Fig.2.Lis the sample thickness andr0is the spot size. The dimensionless factorf, which is unity for zero loss and infinitely long pulses, appearing in Eq. (3) (and described in detail in the text), was found from integrating the propagation equations. The experimental values ofEcwere extracted from Fig.2. Values ofnDare given in units of 1015cm−3;χ(3)Lin units of 10−16m3V−2;χ(3)in units of 10−13m2V−2; and χ(3)/nDin units of 10−34m5V−2. Theoretical predictions are from Eq. (4), and for off-resonance excitation at 36.7 meV, the 2p±contribution was used (it has much higherμ4eg) while at 32.5 meV we used the 2p0contribution (it has much smallerΔ)
DFWM experiment, simply by varying the delay between the beams and changing the position of an iris after the sample. This ensures that timesT1,2were obtained under the same experimental conditions as Fig.2. The calculated values ofχ(3)/nDin the approximation of Eq. (4) are shown in Table1asχð3Þtheory=nD. These predictions from the two- level model may be expected to give reasonable order of magnitude estimates, but it should be noted that the intermediate states and permutations neglected in the approximation of Eq. (4) can give both positive and negative contributions. Earlier work on theoretical pre- diction ofχ(3)for silicon donors has included an infinite number of all possible intermediate states but not the dephasing and decay (T1,T2 andT2)13.
Discussion
In the transparent regions, away from resonance (labelled T in Table 1), we obtain very good agreement between experiment and theory; there is also suitable but not perfect scaling with impurity density, nD. The approximate theory in Eq. (4) consistently underestimates the experiment by about an order of magnitude, implying that the neglected terms due to higher intermediate states and other permutations are additive. On resonance (R), the agreement is almost as good, with a similar magnitude of discrepancy but this time in either direction (particu- larly notable when we compare 2p±transitions for P and Bi), presumably because of the strong sensitivity to the effect of the loss. It is obvious that resonance significantly reducesEcin Fig.2and enhancedχ(3)relative to the non- resonant cases.
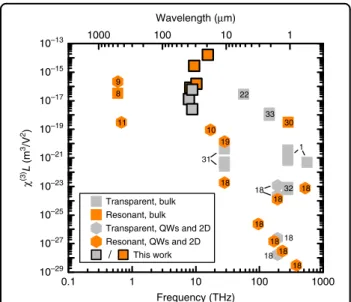
Figure3shows a survey of coherentχ(3)measurements in other materials, systems and frequency bands. The figure shows χ(3)L since this is the quantity that has actually been measured in each case, and it is the quantity that is relevant for frequency mixing applications. In Fig.3, experiments in which the pump transition is virtual have been labelled as transparent, and those where there is a real absorption process at the pump frequency have been labelled as resonantly enhanced. For example, free carrier processes can produce not only a very largeχ(3)L8,9 but also very significant absorption; Dirac materials like graphene produce large χ(3)L11,18 but have resonant interband or free-carrier processes depending on the chemical potential; and resonant enhancements by quantum well design19or Landau levels10,20also naturally induce absorption pathways. In such cases (where absorption loss is present), the volume susceptibilityχ(3)is not an especially useful figure of merit for the material, because the output varies in a non-trivial way with sample thickness thanks to the loss. We note that very large apparent values of χ(3) have been reported in two- dimensional and quantum well systems9,11,19. In all these cases, the measured output is normalised by the
(very small) thickness, and the sheet susceptibility,χ(3)L, is very small by comparison with the values reported here and would remain so even for stacks of very many layers.
It is interesting to note the general trend in Fig. 3 to increased susceptibility as the frequency is reduced. It can be seen from Eq. (4) that there is no intrinsic frequency dependence, so this increase is likely to be due to the difficulty of observing all but the strongest effects at THz frequency. It happens that the material used here has particularly large dipole moments12, which enter Eq. (4) with the fourth power, and an advantageous combination of long dephasing and decay times15,21,17.
Our measuredχ(3)Lfar from resonance is a record for any transparent material, and the only such measurement for THz pumping. Theχ(3)values are all larger even than low temperature bulk InSb close to its band edge fre- quency22, meaning that here the contribution per elec- tron (the hyperpolarisability) is far, far larger. This material can easily be produced in macroscopic thick- nesses relevant for devices. An obvious immediate application is for metrology of a weak (k1) THz beam with an arrival time clocked by a strong coupling pulse (k2). Further prospects arise because compact and effi- cient semiconductor sources23 now cover the entire electromagnetic spectrum from radio waves to the ultraviolet with just one gap between about 5–15 THz
0.1 1 10 100 1000
10–29 10–27 10–25 10–23 10–21 10–19 10–17 10–15 10–13
8
30 22
31
32 33
18
18 18
18 18 18
11 10
18
18 18 18 19 9
Transparent, bulk Resonant, bulk Transparent, QWs and 2D Resonant, QWs and 2D
/ This work χ(3)L (m3/V2)
Frequency (THz)
1
1000 100 10 1
Wavelength (μm)
Fig. 3 Survey of coherent values ofχ(3)Lfrom this work (symbols with solid borders) and elsewhere.Experiments where the pump transition is virtual are labelled as“Transparent”, while experiments with real pump transitions and consequent absorption losses have been labelled as“Resonant”. Resonant quantum wells9,19;
graphene10,11and ref.18and references therein; free-carrier processes in Si8; resonant bandgap-pumped bulk Si30; transparent 2D materials (MoS2and black phosphorus) ref.18and references therein;
transparent bulk semiconductors and insulators22,31–33and ref.1(Table 4.6.1) and references therein
Dessmann et al.Light: Science & Applications (2021) 10:71 Page 4 of 6
(thanks to phonons in common polar solids): doped silicon couldfill the gap by tripling the emission wave- number for existing semiconductor THz lasers. For per- spective, we point out that generation of THz light by downconversion from near-infrared (near-IR)24–26 and mid-IR27sources is well established, but the efficiency is rather low, typically parts per thousand24. Our experi- ments were performed at cryogenic temperature, but many THz sources and detectors already require cryo- genic environments23, and the operating temperature might be raised in future by exploiting deeper donors.
Materials and methods Samples
Samples used were single-crystal silicon doped with either bismuth or phosphorous and kept at a temperature of 5–10 K during the experiment.
The donor densities were determined by four-point resistivity measurements. In all cases, the surfaces were chemically and mechanically polished with a wedge of about 1°. The small-signal absorption was measured with Fourier transform spectroscopy with the samples moun- ted in liquid helium at 2.2 K (see Supplementary Materials for absorption spectra), and the half-width of each inho- mogeneously broadened transition, h=T2, was obtained from Gaussianfits. One transition, the 1s→2p±line in P- doped samples, was saturated, and we took the line-width to be the same as for the 1s→2p0line in this case. The concentrations, sample thicknesses and line-width values are given in Table1.
Dynamical measurements, beam imaging and overlap The optical set-up was a standard, time-resolved, for- wards DFWM arrangement10, Fig. 1. All beams were focussed into a cryostat, recollimated and refocused using off-axis parabolic mirrors onto a high sensitivity liquid He-cooled Ge:Ga photo-conductive detector with a response time of about 100 ns.
A mechanical moving stage controlled the delay, and for the photon echo experiment (used to measure T2), we measured the k3 beam pulse energy as a function of the delay between k1 and k2 beams, while for the pump–probe experiment we simply moved the iris to detect the transmittedk1beam, which then functions as a weak probe. To ensure optimal overlap, we imaged the beams at the sample position with a pyroelectric camera with an effective pixel pitch of 80μm (Spiricon Pyrocam IV). To obtain beam selection and optimal discrimination of the far-field beams after the sample, a motorised iris with a controllable aperture was mounted on a x–y scanning stage between the collimating mirror and the detector. The dependence of the output DFWM pulse energy shown on Fig. 2, E3, was measured with the iris open wide enough to capture the whole beam (while still
excluding the pumps). The resultingT1 and T2 data are given in Table1.
Pulse energy calibration
For metrology of the pulses in each beam for the data of Fig. 2, we calibrated the photon energy-dependent responsivity of the detector before each measurement. As a reference standard, we used a calibrated pyro sensor (SLT PEM 34 IR) with an accuracy of 2%.
For each set of measurements, we determined the ratio x=E2/E1 by simultaneously recording both beams with the pyroelectric camera just before the sample, while scanning the undulator of the FEL.
The cryostat window transmission was calibrated by measuring the laser transmission through the empty cryostat (i.e. without the sample), referenced to the sig- nal with the cryostat removed. We assumed both win- dows had the same transmission. The reflection loss at the sample surface was estimated using the Fresnel transmission coefficientT 0:7 for the interface of the sample, which approximately agrees with the laser transmission signal when very far from resonance.
A polariser pair (Infraspecs P03) before the beam splitter was used to adjust the total laser pulse energy in fine steps for the intensity dependence of Fig.2.
The values ofr0used are given in Table1and came from the measurement with the Pyrocam mentioned above.
Pulse shape
In order to make the conversion from critical pulse energy toχ(3)(see below), the pulse duration is required.
–30 –20 –10 0 10 20 30
0 1 2 3 4 5 6
E3 (pJ)
Delay (ps) Si:P (1 × 1016 cm–3)
36.7 meV E1 = 19.3 nJ t = 7.5 ps
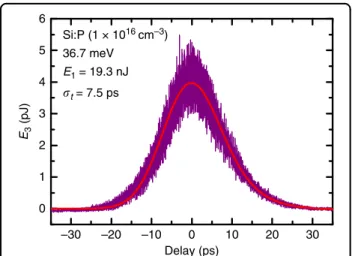
Fig. 4 An example transient output pulse energy (E3) as a function of delay between the input pulses (the k1and k2beams) for one of the Si:P samples far from resonance.The signal is a third-order autocorrelation of the pulse temporal profile. This autocorrelation signal appears Gaussian to a good approximation (red line) with r.m.s. widthσt=7.5 ps, so the inferred r.m.s. duration of the pump beams ist0¼ ffiffiffiffiffiffiffi
2=3
p σt¼6.1 ps
The FELIX laser produces trains of intense, tuneable, short pulses. The train is emitted at 10 Hz in so called macropulse bunches, which contain approximately 200 micropulses each, at a repetition rate of 25 MHz. The pulse duration can be estimated from the spectrum since the pulses are approximately bandwidth limited. For a Gaussian pulse, its r.m.s. intensity duration t0=1/4πσν
where the r.m.s. intensity bandwidth in frequency ν averaged over the macropulse is typically about σν/ν≈ 0.3% corresponding to a pulse duration of a few picose- conds, and there was little variation throughout the experiments. For this work, we made use of the fact that, when off-resonance, the measuredE3as a function of the delay between the inputs k1,2 gives a third-order auto- correlation (3AC), shown in (Fig.4). For a Gaussian pulse, the r.m.s. duration is t0¼σt ffiffiffiffiffiffiffiffi
p2=3
¼6.1 ps, where σt is the r.m.s. duration of the 3AC given on thefigure. For the data in Table 1, we took the value of t0 from the 3AC measurement of Fig.4, and we assumed that it was con- stant for all experiments.
Acknowledgements
We acknowledgefinancial support from the UK Engineering and Physical Sciences Research Council [ADDRFSS, Grant No. EP/M009564/1], the EPSRC National Research Facility, FELIX, and the skilful support of the FELIX staff.
Author details
1Radboud University, Institute for Molecules and Materials, HFML-FELIX, Nijmegen, The Netherlands.2Advanced Technology Institute and Department of Physics, University of Surrey, Guildford GU2 7XH, UK.3Institute of Optical Sensor Systems, German Aerospace Center, Berlin, Germany.4Institute of Photonics and Quantum Sciences, SUPA, Heriot-Watt University, Edinburgh, UK.5Leibniz-Institut für Kristallzüchtung (IKZ), Berlin, Germany.6Laboratory for Solid State Physics, ETH Zürich, 8093 Zürich, Switzerland.7Institut de Physique, EPFL, 1015 Lausanne, Switzerland.8Paul Scherrer Institute, 5232 Villigen, Switzerland
Author contributions
ND, VE, SC, KS, AP, AFGM, KLL and BR performed the experiments. NHL and IG produced the theory. SGP, NVA and HR prepared and characterised the samples. ND and NHL analysed the data. BNM, NHL, ND, VE, SC, GA, IG and CRP designed the project. BNM, ND, NHL, AP and CRP wrote the manuscript. All authors contributed to the discussion and interpretation of the results.
Data availability
The data for this work are freely available28.
Conflict of interest
The authors declare no competing interests.
Supplementary informationThe online version contains supplementary material available athttps://doi.org/10.1038/s41377-021-00509-6.
Received: 10 July 2020 Revised: 2 March 2021 Accepted: 10 March 2021
References
1. Boyd, R. W. InNonlinear Optics (Third Edition)(ed. Boyd, R. W.) Ch. 4 (Academic, 2008).
2. Wang, P., Liang, J. & Wang, L. V. Single-shot ultrafast imaging attaining 70 trillion frames per second.Nat. Commun.11, 2091 (2020).
3. Yang, K. Y. et al. Inverse-designed non-reciprocal pulse router for chip-based LiDAR.Nat. Photon.14, 369–374 (2020).
4. Elshaari, A. W., Pernice, W., Srinivasan, K., Benson, O. & Zwiller, V. Hybrid inte- grated quantum photonic circuits.Nat. Photon.14, 285–298 (2020).
5. Feng, L., Guo, G. & Ren, X. Progress on integrated quantum photonic sources with silicon.Adv. Quantum Technol.3, 1900058 (2020).
6. Paesani, S. et al. Near-ideal spontaneous photon sources in silicon quantum photonics.Nat. Commun.11, 2505 (2020).
7. Ganichev, S. D. Intense terahertz excitation of semiconductors.Terahertz Sci.
Technol.1, 136–160 (2008).
8. Mayer, A. & Keilmann, F. Far-infrared nonlinear optics. II. Chi3 contributions from the dynamics of free carriers in semiconductors.Phys. Rev. B 33, 6962–6968 (1986).
9. Markelz, A., Gwinn, E., Sherwin, M., Nguyen, C. & Kroemer, H. Giant third-order nonlinear susceptibilities for in-plane far-infrared excitation of single InAs quantum wells.Solid State Electron.37, 1243–1245 (1994).
10. König-Otto, J. C. et al. Four-wave mixing in Landau-quantized graphene.Nano Lett.17, 2184–2188 (2017).
11. Hafez, H. A. et al. Extremely efficient terahertz high-harmonic generation in graphene by hot Dirac fermions.Nature561, 507–511 (2018).
12. van Loon, M. A. W. et al. Giant multiphoton absorption for THz resonances in silicon hydrogenic donors.Nat. Photon.12, 179–184 (2018).
13. Le, N. H., Lanskii, G. V., Aeppli, G. & Murdin, B. N. Giant non-linear susceptibility of hydrogenic donors in silicon and germanium.Light Sci. Appl.8, 64 (2019).
14. Meng, F. et al. Intracavity third-harmonic generation in Si:B pumped by intense terahertz pulses.Phys. Rev. B102, 1–9 (2020).
15. Greenland, P. T. et al. Coherent control of Rydberg states in silicon.Nature465, 1057–1061 (2010).
16. Pajot, B.Optical Absorption of Impurities and Defects in Semiconducting Crystals, Vol. 158 (Springer, 2010).
17. Stavrias, N. et al. Competition between homogeneous and inhomogeneous broadening of orbital transitions in Si:Bi.Phys. Rev. B96, 155204 (2017).
18. Autere, A. et al. Nonlinear optics with 2D layered materials.Adv. Mater.30, 1705963 (2018).
19. Sirtori, C., Capasso, F., Sivco, D. L. & Cho, A. Y. Giant, triply resonant, third-order nonlinear susceptibility Chi3.Phys. Rev. Lett.68, 1010–1013 (1992).
20. Yao, X. & Belyanin, A. Nonlinear optics of graphene in a strong magneticfield.
J. Phys. Condens. Matter25, 054203 (2013).
21. Vinh, N. Q. et al. Silicon as a model ion trap: time domain measurements of donor Rydberg states.Proc. Natl Acad. Sci. USA105, 10649–10653 (2008).
22. MacKenzie, H. A., Wherrett, B. S., Alattar, H. A. & Yuen, S. Y. Near-resonant non- degenerate four-wave mixing in InSb.J. Phys. B At. Mol. Phys.17, 2141–2149 (1984).
23. Sirtori, C., Barbieri, S. & Colombelli, R. Wave engineering with THz quantum cascade lasers.Nat. Photon.7, 691–701 (2013).
24. Madéo, J. et al. All-optical wavelength shifting in a semiconductor laser using resonant nonlinearities.Nat. Photon.6, 519–524 (2012).
25. Guo, J. et al. Doped GaSe crystals for laser frequency conversion.Light Sci. Appl.
4, e362 (2015).
26. Nagatsuma, T., Ducournau, G. & Renaud, C. C. Advances in terahertz com- munications accelerated by photonics.Nat. Photon.10, 371–379 (2016).
27. Koulouklidis, A. D. et al. Observation of extremely efficient terahertz generation from mid-infrared two-color laserfilaments.Nat. Commun.11, 292 (2020).
28. Dessmann, N. Data sets for“highly efficient thz four-wave mixing in doped silicon”.https://doi.org/10.5281/zenodo.4557683(2021).
29. Clauws, P., Broeckx, J., Rotsaert, E. & Vennik, J. Oscillator strengths of shallow impurity spectra in germanium and silicon.Phys. Rev. B38, 12377 (1988).
30. Jain, R. K. & Klein, M. B. Degenerate four-wave mixing near the band gap of semiconductors.Appl. Phys. Lett.35, 454–456 (1979).
31. Wynne, J. J. Optical third-order mixing in GaAs, Ge, Si, and InAs.Phys. Rev.178, 1295–1303 (1969).
32. Ganeev, R., Kulagin, I., Ryasnyansky, A., Tugushev, R. & Usmanov, T. Char- acterization of nonlinear optical parameters of KDP, LiNbO3and BBO crystals.
Opt. Commun.229, 403–412 (2004).
33. Turner, M. D., Roh, W. B. & Schepler, K. L. Nonlinear optical properties of GaSb and GaInAsSb and their application for phase conjugation in degenerate four- wave mixing.J. Opt. Soc. Am. B17, 790 (2000).
Dessmann et al.Light: Science & Applications (2021) 10:71 Page 6 of 6