The Impact of Corporate Social and Environment Performance on Credit Rating Prediction: North
America versus Europe
Gregor Dorfleitner⇤,a, Johannes Greblera, Sebastian Utzb
aDepartment of Finance, University of Regensburg
bSchool of Finance, University of St.Gallen
Abstract
We quantify to what extent the quality of credit rating predictions improves through integrating measures of corporate social performance (CSP) in an established credit risk model. We provide comprehensive evidence of the comparative informational advantage of considering CSP in predicting credit ratings of North American and European firms. In the North American sam- ple both environmental and social performance have an explanatory impact.
The out-of-sample prediction quality is improved by more than 0.8%. By contrast, only the social performance increases the explanatory power in the European sample while environment performance does not. Overall, we show that CSP is a relevant variable for predicting credit ratings. In general, our findings support the risk mitigation view of CSP indicating that firms with high CSP are less risky and thus have better credit ratings. However, ob- viously the quality of the relationship depends on the socio-economical and cultural environment as well, as can be seen from the di↵ering results in North America and Europa.
Keywords: Credit risk, Credit ratings prediction, Corporate social performance,, Risk mitigation
1. Introduction Highlights:
⇤Corresponding author, gregor.dorfleitner@ur.de
• Measures of corporate social responsibility improve credit rating pre- diction quality
• Firms with high corporate social responsibility have better credit rat- ings
• Impact on credit ratings is more pronounced in North America than in Europe
This paper analyzes whether, how, and to what extent the prediction quality of a firm’s credit rating can be improved by integrating its corporate social performance (CSP) in the forecasting model. To capture regional dif- ferences, we analyze two samples of firm-level data, one of North American and one of European firms. We unify the work of Jiraporn et al. (2014) for North America and Stellner et al. (2015) for Europe by providing a frame- work in which results for the two regions can validly be compared in an established credit risk model. We use CSP measures of the globally avail- able Asset4 framework and investigate the impact of these CSP measures on both the explanation and the prediction of credit ratings. We capture region specific di↵erences by estimating models for both North America and Europe separately and for a merged data set. In particular, we apply a two-stage approach with an estimation of credit risk models including CSP variables in a first stage and an out-of-sample analysis using the estimate of stage one to predict the credit ratings in a second stage. Finally, we measure the prediction quality by comparing predicted and actual credit ratings. In North America, the environmental and social CSP show explanatory impact on credit ratings while only the social CSP is relevant in Europe. Further, we find improved predicting power of the credit risk model using CSP scores for the North American sample while we document no improvement in the European sample.
In theory, corporate social responsibility, which is constantly addressed in this paper through the more narrow, however measurable concept of CSP, can co-exist with both better and worse credit ratings, providing there is evidence of an impact. According to Goss and Roberts (2011), there are two contrary views for the impact of CSP: The risk-mitigation view and the over-investment view. According to the risk-mitigation view, a firm with high CSP faces lower risks than a firm with a low CSP if all other aspects of these firms are comparable. High CSP preserves firms from legal, reputational, and regulatory risks (Bauer and Hann, 2010), allows firms to hire better
qualified employees (Turban and Greening, 1997), and lowers agency risks (Oikonomou et al., 2014). The opposite, the over-investment view regards investments in CSP as a waste of scarce resources. An increase in fixed costs related to sustainable investments in CSP increases the volatility of earnings and thus the default risk (Frooman et al., 2008). With the exception of the environment score in Europe, credit ratings are significant positively correlated with the CSP scores and thus our findings are consistent with the risk-mitigation view.
Whether CSP adds informational power to the explanation of credit rat- ings has been the subject of two recent studies, namely Jiraporn et al. (2014) analyzing North America and Stellner et al. (2015) analyzing Europe. These studies provide inconsistent evidence that could be either due to the di↵er- ent methodological designs or the di↵ering regional focus in their samples.
To be more precise, Stellner et al. (2015) show that CSP has no impact on credit ratings in Europe while Jiraporn et al. (2014) conclude that CSP does, in fact, have an impact on credit ratings in North America. Nevertheless, these results are inappropriate for concluding that regional di↵erences exist since both studies use di↵erent model specifications and concepts for mea- suring CSP (data provider Asset4 resp. Kinder Lydenberg Domini (KLD)).
In particular, Asset4 and KLD CSP data show major di↵erences, even after adjustment for di↵erent CSP definitions (Chatterji et al., 2016; Dorfleitner et al., 2015). Asset4 provides a comprehensive calculation of the scores based on more than 750 indicators which are ordinal or metric compared with KLD, with only using a binary rating system reflecting CSP strengths and concerns for U.S. firms (Humphrey et al., 2012). We use CSP measures of Asset4 due to their global coverage that allows for a consistent estimation of an well- established credit risk model for North America and Europe. The major limitation of the existing studies in the CSP–credit rating context concerns the retrospective contemplation by measuring the correlation of credit rat- ings and lagged CSP which lacks of out-of-sample predictions. In our study, we predict the next period’s credit rating based on all available information at a certain point in time. Finally the prediction quality is determined by comparing actual and predicted credit ratings.
Our data set includes S&P counterparty ratings, which we match with Asset4 CSP scores and a set of control variables. We estimate several versions of an established ordered probit credit risk model, which is able to handle rating migrations. To be specific, we estimate one baseline model without CSP factors and three CSP model for each sample (i.e., the North American
sample, the European sample, and the merged sample comprising both), resulting in a total of twelve model specifications. The three CSP model specifications comprise one aggregated CSP measure (ES) model, a model specification including a score for the environmental dimension of CSP, and a model specification with a score for the social dimension of CSP. The in-sample period for determining the models’ coefficients ranges for credit ratings from 2003 to 2013. Subsequently, we predict credit ratings on the data set covering the years from 2014 to 2017. This two-step-process ensures that only the available level of information is used to predict the following periods’ credit ratings.
We find that the integration of measures for CSP in the credit risk model increase its explanatory power in the North American sample. The qual- ity of out-of-sample credit rating predictions is improved by 0.8%. For the European firms, only high social performance is correlated to better credit ratings. The prediction quality experiences no improvement. Distinct find- ings for North America and Europe result from the geographical, social, and political environment of the two regions, which is reflected in the Asset4 scores. The average level of CSP scores of North American firms is lower and their variance is higher than that of European firms. This is one possible reason for CSP scores having a higher explanatory power in predicting credit ratings in North America since the explanatory variables show a certain de- gree of variance there. In a nutshell, CSP has an impact on credit ratings in both regions although to a di↵erent extent. For North America, our findings are consistent with those of Jiraporn et al. (2014), while our results suggest contrasting implications to those of Stellner et al. (2015).
Our findings reveal valuable insights for researchers, debt holders, and debt issuers. Based on our approach of incorporating CSP into credit risk models, we find that debt holders experience higher accuracy in their credit rating predictions if they include CSP factors as explanatory variables in their credit risk models. With the higher prediction power they profit twofold by preventing misjudgments: In the case of overestimation of risk, they could lose business due to excessive price-setting. In the case of underestimation of risk, the applied pricing does not cover the anticipated risk. This leads to immediate losses in the risk-adjusted performance measurement and material losses when risks become imminent. Finally, debt issuers can improve their credit rating prediction and hence their cost of debt by increasing their CSP.
For instance, an increase in the ES score by one standard deviation for a BBB- rated North American firm results in average savings of 14.5 basis points.
The remainder of the paper is organized as follows. We review the related literature and discuss theoretical concepts in Section 2. Section 3 describes the data set and Section 4 introduces the employed methodology. Section 5 presents the empirical results followed by Section 6 with a discussion of the findings and Section 7 with robustness tests. Finally, Section 8 concludes.
2. Theoretical considerations
Our study is based on two streams of literature: First, the one on the impact of CSP on credit ratings and, second, the strand on the regional di↵erences regarding the attitude of firms towards CSP.
2.1. The impact of CSP on credit ratings
From a theoretical perspective, an indirect link between CSP and credit ratings in the context of financing cost and corporate financial performance (CFP) exists. There is evidence to suggest that firms with high CSP have lower financing costs in terms of both cost of equity and cost of debt (Goss and Roberts, 2011; Dhaliwal et al., 2011; El Ghoul et al., 2011). As cred- itworthiness is negatively related to interest rates payable on debt (Kisgen, 2006), we expect to observe a positive relationship between CSP and credit ratings based on this consideration. From this perspective, CSP can be seen, as being an underlying factor, having an impact on both financing cost and credit ratings. With respect to single CSP pillars, the negative relation- ship between CSP and financing cost is shown for environmental (Schneider, 2011; Sharfman and Fernando, 2008) and social performance (Chen et al., 2011). A similar path of argumentation can be formulated when consider- ing CFP as opposed to financing costs. CSP is positively related to CFP (Kang et al., 2016; Dorfleitner et al., 2018; Von Arx and Ziegler, 2014) in the sense of sustainable future cash flows. Furthermore, CFP is positively related to creditworthiness (Standard&Poor’s, 2013). Finally, firms with a high CSP tend to have a lower idiosyncratic risk due to the risk-mitigation e↵ect of CSP, which corresponds to both lower financing costs and a higher CFP (Orlitzky, 2008). Therefore, we expect a positive relationship between CSP and creditworthiness. When re-examining the di↵erent pillars of CSP, we can expose the underlying mechanisms. Firms with a low level of en- vironment performance face legal, reputation, and regulatory risks (Bauer and Hann, 2010). Moreover, a good social performance allows firms to hire
better qualified employees, thus being a key factor for future success (Tur- ban and Greening, 1997). It should be noted that a contrasting view, the over-investment, exists, according to which CSP lowers CFP when costs ex- ceed additional positive returns (Brammer and Millington, 2008; Cornell and Shapiro, 1987; Aupperle et al., 1985). However, there is less supporting evi- dence in favor of this view.
From the empirical perspective, a few studies examine the impact of CSP on credit ratings by approaching an ordered response credit risk model and show that CSP is positively related to (good) credit ratings. Stellner et al.
(2015) find no significant relationship between CSP and credit ratings in the Eurozone based on the Asset4 equal weighted rating score. However, high (low) CSP results in better credit ratings if the country’s sustainability performance is high (low). Jiraporn et al. (2014) use the KLD composite score and find that the CSP policies of U.S. firms are a↵ected by other firms’
policies, when located in the same three-digit zip codes area. Firms with high CSP have better credit ratings. A deeper look at single dimensions of CSP by utilizing KLD data shows that U.S. firms with high environmental and social performance have better credit ratings (Oikonomou et al., 2014;
Attig et al., 2013; Bauer and Hann, 2010; Bauer et al., 2009).
Although there exists empirical evidence on the general CSP-credit rating link, it is still not clear, if there is an impact of CSP on the prediction quality.
Additionally, there is no consistent evidence on the question whether the impact of CSP on credit ratings depends on regional di↵erences, a matter which we treat in the next subsection.
2.2. CSP in North America and Europe
In general, CSP is higher in Europe compared with North America (or the U.S. as its main representative). The respective explanations include the legal origin (common law versus civil law), the deviating institutional and political set-up, the level of economic development, the historic tendency to liberal democracy, and the perception of stakeholders (Liang and Renneboog, 2017; Doh and Guay, 2006; Cai et al., 2016; Welford, 2005; Maignan, 2001).
In particular, the stakeholder perception is linked to the di↵ering ideologies as defined by Lodge (1990). European countries are more closely related to the communitarian ideology (pursuing the goal of common long-term good) while the U.S. are subject to the individualistic ideology (pursuing individual short- term improvements). The firms’ motivation to act in a socially responsible
way di↵ers between these two regions depending on firm size and financial performance (Sotorr´ıo and S´anchez, 2008).
CSP in the U.S. is ingrained in society while CSP is more state-oriented in Europe. Although, historically, CSP has been driven more by concrete corporate policies and programs which contribute to social concerns in the U.S. compared to Europe , the rise of CSP in Europe results from incentives for corporate engagement provided by the European Union (Matten and Moon, 2008).
Empirical evidence shows that North America’s CSP exceeds Europe only regarding rare aspects such as business communication (Maignan and Ral- ston, 2002). Regarding most aspects and measurement concepts, CSP is higher in Europe. We expect the regional di↵erences in the CSP level to have an impact on credit ratings and their predictions in this study.
3. Data
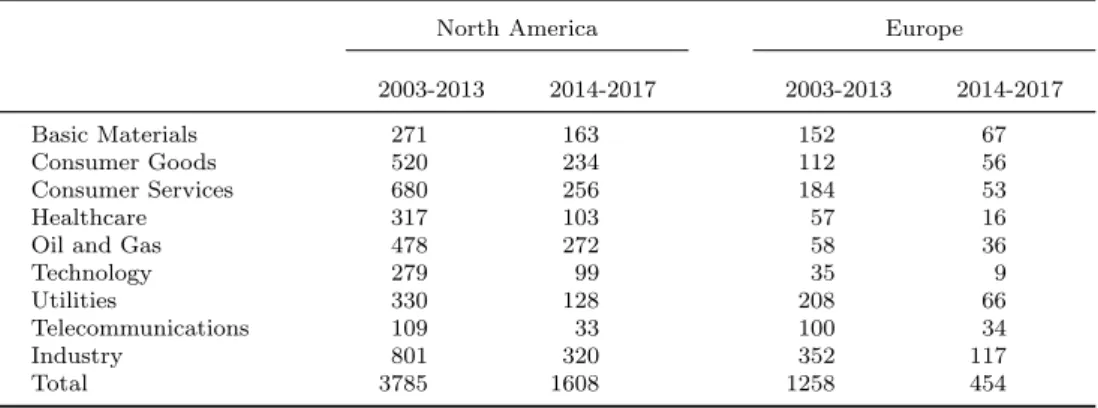
We match S&P credit ratings of North American and European counter- parties from Compustat with the rating universe of the sustainability rating agency Asset4 provided by Thomson Reuters Datastream. Moreover, we use firm-year financial and accounting data from Datastream and Worldscope to control for well-documented influence factors on credit risk. Financial counter-parties are excluded based on the economic sector level of Thom- son Reuters Business Classification. Our final data set comprises a panel including 724 North American firms (5,393 firm-year observations) and 218 European firms (1,712 firm-year observations). The North American panel and the European panel follow the region classification of Fama and French (2012).1
3.1. S&P Credit ratings and Asset4 CSP scores
We use S&P long-term borrower credit ratings reflecting the obligors’
creditworthiness over a long-term time horizon (greater than one year) as the independent variable. The S&P issuer credit rating is defined as being the
1 The North American panel includes the United States and Canada while the Euro- pean panel includes Austria, Belgium, the Czech Republic, Denmark, Finland, France, Germany, Greece, Hungary, Italy, the Netherlands, Norway, Portugal, Spain, Sweden, Switzerland, and the United Kingdom according to the FTSE Country Segment classifi- cation.
current assessment of an obligor’s overall financial capacity to serve its debt, i.e., its creditworthiness. The rating grades comprise AAA, AA, A, BBB, BB, B, CCC, CC, and D, where D is assigned to obligors that are overdue in either their interest or capital payments. Credit ratings of BBB or better are often referred to as ‘investment grade’ while credit ratings below this threshold are often called ‘non-investment’ or ‘speculative grade’. Standard&Poor’s (2017) contains a detailed description of the rating methodology.
We estimate the CSP of a company through three di↵erent means: the equal weighted ES score and its two pillar scores from the Asset4 database, i.e., the environment score (ENV), and the social score (SOC). The Asset4 ES score reflects the overall score of a firm in a certain year. It is derived by aggregating the two pillar scores. Asset4 publishes scores acting as exter- nal measures for sustainable business models (Ioannou and Serafeim, 2012;
Chatterji et al., 2016; Humphrey et al., 2012). These scores are based on publicly available and traceable information, for instance websites, SEC fil- ings such as 10-K, DEF 14A, and 10-Q, sustainability reports, media sources, and NGO reports. To guarantee a high level of integrity of the data, every entry is cross-checked by at least one additional analyst and by further anal- yses through statistical tools. Therefore, using the Asset4 scores ensures the elimination of weaknesses such as the lack of transparency in the KLD, FTSE4Good, and Dow Jones-rating approaches (Chatterji and Levine, 2006) as far as possible. This is due to the fact that Asset4 evaluates more than 750 individual data points. Every data point matches a single question concern- ing the fulfillment of a specific item according to economic, environmental, social, and governance issues. The information gathered by the answers is aggregated in several stages to indicators, these again to pillars, and finally to the average CSP rating. The scores are updated on an annual basis and range from zero to 100 with a higher score indicating a higher level of CSP.
The rating universe of Asset4 even includes a firm post-bankruptcy, a merger, and other causes of delisting. Thus the data set is free from survivorship bias.
3.2. Control variables
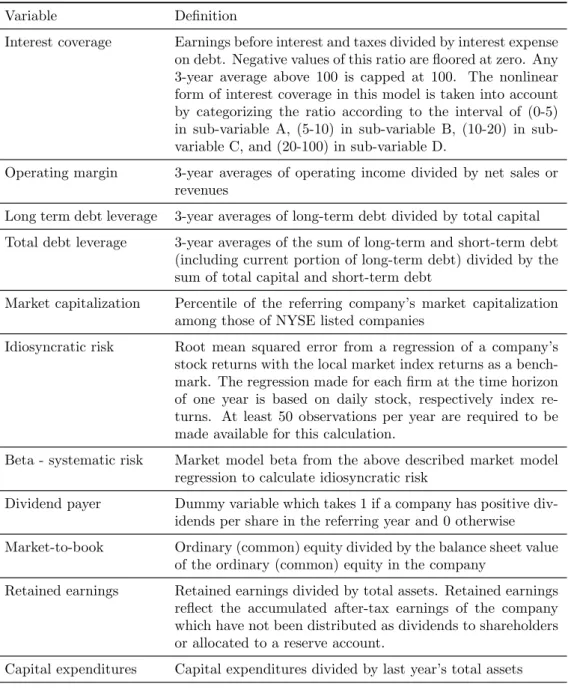
To capture well-documented e↵ects of predicting credit ratings, we control for several variables. The detailed description of all of these variables is provided in Table A.7.
Following Standard&Poor’s (2013); Merton (1974) we include three-year averages of the operating margin, the long-term debt, the total debt, and the interest coverage ratios. The interest coverage ratio is transformed as
suggested by Blume et al. (1998). Since negative values can be caused either by low interest payments or by high negative earnings, the magnitude of negative values for interest coverage is not meaningful and therefore these values are set to zero. The distribution of the interest coverage ratio is heavily skewed and the marginal e↵ect of changes may be small if interest coverage is already on a high level. Accordingly, we cap the three-year average at 100.
To capture the non-linear shape of interest coverageCitfor companyiin year t, we apply the decomposition to four sub-variables cAit,cBit,cCit,cDit as defined by:
cAit cBit cCit cDit
ifCit2[0,5) Cit 0 0 0
ifCit2[5,10) 5 Cit 5 0 0
ifCit2[10,20) 5 5 Cit 10 0 ifCit2[20,100) 5 5 10 Cit 20 .
Furthermore, we also include market capitalization because bigger firms tend to have superior credit ratings (Altman et al., 1977) and because Asset4 scores show a market cap dependence. Moreover, since all claims on assets must earn the same compensation per unit of risk (Merton, 1974; Campbell et al., 2008; Friewald et al., 2014), we also control for systematic risk (market model beta) and idiosyncratic risk. Additionally, the dividend policy of a firm also has an impact on credit risk (Hoberg and Prabhala, 2009). As profitable firms are less likely to default, we expect a positive correlation between the market-to-book ratio and credit ratings and thus include market- to-book ratio (P´astor and Pietro, 2003). Following DeAngelo et al. (2006), retained earnings can be used as a proxy of a company’s life cycle phase.
Mature, stable firms are generally awarded a better rating (Fons, 1994).
Thus we also include retained earnings as control. Additionally, Tang (2009) finds that upgraded firms have more capital expenditure than downgraded firms. Hence, we expect a positive correlation between capital expenditure and credit ratings. Moreover, firms with a poor credit risk profile tend to have precautionary savings (Acharya et al., 2012), which is why we also use the cash balance as a control. Earlier studies (Rampini and Viswanathan, 2013) document an impact of tangibility on credit risk. Furthermore, Bangia et al. (2002) find evidence that S&P credit ratings change pro-cyclically.
Hence, we control for business-cycle e↵ects as depicted by the gross domestic product-growth rate. We further use year dummies to control for remaining systematic e↵ects (Elton et al., 2001). We follow Dimitrov et al. (2015) on the
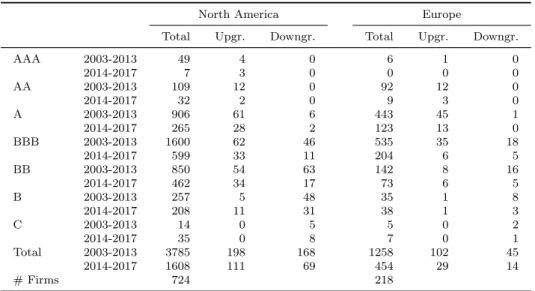
Table 1: This table reports on the total number of firms and observations per rating class including the partial quantity of rating upgrades and downgrades for the samples of North America and Europe. Both panels cover credit ratings from 2003 to 2013 for the coefficient estimation and from 2014 to 2017 for the out-of-sample prediction. Independent variables are lagged by one year compared with the credit ratings. We use S&P long- term borrower credit ratings reflecting the obligors’ creditworthiness over a long-term time horizon (greater than one year).
North America Europe
Total Upgr. Downgr. Total Upgr. Downgr.
AAA 2003-2013 49 4 0 6 1 0
2014-2017 7 3 0 0 0 0
AA 2003-2013 109 12 0 92 12 0
2014-2017 32 2 0 9 3 0
A 2003-2013 906 61 6 443 45 1
2014-2017 265 28 2 123 13 0
BBB 2003-2013 1600 62 46 535 35 18
2014-2017 599 33 11 204 6 5
BB 2003-2013 850 54 63 142 8 16
2014-2017 462 34 17 73 6 5
B 2003-2013 257 5 48 35 1 8
2014-2017 208 11 31 38 1 3
C 2003-2013 14 0 5 5 0 2
2014-2017 35 0 8 7 0 1
Total 2003-2013 3785 198 168 1258 102 45
2014-2017 1608 111 69 454 29 14
# Firms 724 218
connection that the standard model in the literature comes without industry fixed e↵ects in our main models. The underlying idea assumes industry- specific influence factors so far considered in the other controls. However, we consider industry e↵ects in the robustness checks of Section 7.
3.3. Descriptive statistics
Compared to credit ratings, ES variables and controls are lagged by one period. The estimation set contains credit ratings covering the years from 2003 through 2013 and independent variables between 2002 and 2012. Out- of-sample predictions for credit ratings in the time period from 2014 to 2017 are based on independent variables from 2013 to 2016. Table 1 presents descriptive statistics of the credit rating variable, sorted by region (North America vs. Europe) and sub-period (2003-2013 vs. 2014-2017). Rating class BBB shows the largest number on observations in both regions.
For the ES score as well as for the ENV and SOC scores, both mean and median are lower in North America than in Europe indicating weaker overall
CSP. The standard deviation in the ES, ENV, and SOC scores is higher in North America than in Europe. Thus, CSP shows higher variability in North America than in Europe. The distributions of the measures for CSP are skewed to the left. A reason for this phenomenon may be found in the fact that companies with weak CSP ratings are less likely to provide the data required to obtain an ES rating. Hence, the proportion of weak performance companies in the database is less than in the basic population causing this skewness.
The most significant regional di↵erence referring to descriptive statistics is that the mean size of firms in the European sample is bigger than in North America. This can be explained by the broader availability of credit ratings of smaller firms in North America. Moreover, the macroeconomic situation measured by the GDP growth rate shows a high degree of deviation.
While the level of GDP growth in the estimation period and the out-of- sample period in North America is 1.6% and 2.2% respectively, the respective numbers in Europe are 0.4% and 0.8% lower.
4. Methodology
Based on the approach of Kaplan and Urwitz (1979), its continuation by Blume et al. (1998), and its application in many studies (e.g., Dimitrov et al., 2015; Baghai et al., 2014; Alp, 2013; Jiang et al., 2012; Becker and Milbourn, 2011), we estimate a threshold model based on an unobserved linking variable yit⇤, which represents the creditworthiness of a firm i and year t
y⇤it=x0i,t 1 +✏it, (1) wherexi,t 1 represents the vector of observed explanatory variables of firmi in year t 1 and is a vector of slope coefficients. The variable Rit is the rating category of firm i and year t. The linking variable yit⇤ is continuous and its range comprises the set of real numbers. In our study, we consider seven di↵erent levels of credit ratings (i.e., AAA, AA, A, BBB, BB, B and C). The variable Rit is assigned to 7 if firm ihas a rating of AAA, 6 if AA, 5 if A, 4 if BBB, 3 if BB, 2 if B, and 1 if C in year t. Thus, the first stage of our estimation maps the credit ratings into a partition of the unobserved
Table2:ThistablereportsondescriptivestatisticsfortheAsset4scoresandcontrolvariablesfortheNorthAmericanand theEuropeansampleofexplanatoryvariablescoveringtheestimationperiodof2002to2012andtheout-of-sampleprediction periodof2013to2016. NorthAmericaEurope PeriodMean25%Median75%Std.Dev.Mean25%Median75%Std.Dev. Asset4VariablesESScore(%)2002-201251.51624.12048.85080.09028.09381.66875.84088.44092.97915.778 2013-201657.69932.27060.33384.48027.45885.88584.90791.41093.65313.237 ENVScore(%)2002-201250.53818.82048.07082.85031.09881.39076.81789.80593.28717.912 2013-201656.66026.30761.74087.86230.46485.98984.86791.96593.99014.280 SOCScore(%)2002-201252.43725.21051.79080.82028.72682.02474.97289.07594.64817.024 2013-201658.67334.50563.61584.34727.64285.72285.17791.15594.13814.363 ControlVariablesInterestCoverage(%)2002-201211.1082.6405.51012.08016.9728.6682.8704.9208.58813.388 2013-20168.6481.8004.2909.59214.8948.1601.8204.2858.32514.108 OperatingMargin(%)2002-201213.8057.41012.32019.0108.51811.9245.33210.49016.3988.055 2013-201613.2596.39711.87018.6058.80110.8304.5008.55015.4288.154 LongTermDebt(%)2002-201239.53224.97037.43051.68019.20039.73626.79738.61051.02816.842 2013-201646.00431.88744.66557.55519.49741.54428.89538.99553.94016.364 TotalDebt(%)2002-201242.70228.11040.72055.23019.01345.76433.31544.53557.54516.103 2013-201648.51833.77847.40060.54019.51846.82933.73344.51559.46015.818 Size(USDm)2002-201218.1413.4076.99316.52536.77926.4845.46611.16628.86239.369 2013-201621.9812.9247.77420.05445.20527.6605.37913.59231.32538.744 Beta2002-20121.0570.7321.0111.3200.4120.9360.6890.9041.1610.330 2013-20161.1430.8501.0891.3940.4120.9780.7840.9661.1450.284 IdiosyncraticRisk(%)2002-20121.6771.1161.5002.0380.7431.4771.0631.3251.7580.564 2013-20161.6321.0311.3731.9800.8071.3760.9471.1751.6110.575 DividendPayer(%)2002-20120.7551.0001.0001.0000.4300.9101.0001.0001.0000.286 2013-20160.7270.0001.0001.0000.4460.8331.0001.0001.0000.374 Market/Book(%)2002-20122.7681.4302.1803.4501.9612.3421.2601.9603.0501.425 2013-20162.8671.3302.1703.5722.2602.1131.0401.6552.8201.436 RetainedEarnings(%)2002-20120.2590.0940.2580.4250.2560.1630.0460.1430.2750.165 2013-20160.2070.0090.1950.4050.2930.2060.0760.1980.3480.180 CapitalExpense(%)2002-20125.1362.5104.5507.6303.0585.0762.9104.6806.9282.673 2013-20165.1052.2904.4007.9403.1454.3422.4333.7255.8602.473 CashHoldings(%)2002-20120.0900.0230.0630.1370.0810.0930.0460.0780.1240.060 2013-20160.0860.0240.0640.1320.0760.1060.0630.0970.1370.059 Tangibility(%)2002-20120.3580.1430.2960.5570.2470.3260.1640.3120.4700.194 2013-20160.3860.1290.3190.6510.2800.3090.1440.2720.4790.196 GDPGrowth(%)2002-20120.0160.0160.0230.0290.0180.0120.0020.0170.0260.022 2013-20160.0220.0180.0220.0250.0050.0140.0080.0140.0220.011 #Observations2002-201237851258 2013-20161608454
linking variableyit⇤ as follows:
Rit= 8>
>>
>>
>>
>>
>>
<
>>
>>
>>
>>
>>
>:
7 if yit⇤ 2[µ6,1) 6 if yit⇤ 2[µ5, µ6) 5 if yit⇤ 2[µ4, µ5) 4 if yit⇤ 2[µ3, µ4) 3 if yit⇤ 2[µ2, µ3) 2 if yit⇤ 2[µ1, µ2) 1 if yit⇤ 2( 1, µ1),
(2)
whereµj are partition points independent of timet. Thresholds are not given ex ante, but instead determined in the statistical procedure of estimating the model.
Following the assumption that ✏it is normally and independently dis- tributed with a mean of 0 and a variance of 1, which is ensured in the estimation procedure, the probabilities for the di↵erent rating classes (given xt 1) can be calculated according to:
P(Rit=j|xi,t 1) = (µj x0i,t 1 ) (µj 1 x0i,t 1 ), j = 1, ...,7, (3) with µ0 = 1 and µ7 =1.
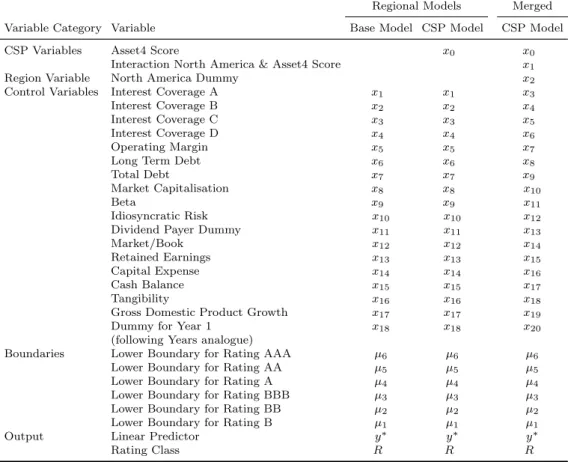
We utilize the panel structure of the data for the model estimation. Both a certain rating (i.e., a realization of Rit) and realizations of the input vari- ables are ascribed to each company and each year during the observation period. In order to represent the state of information when predictions for the following period are calculated, all influence factors are lagged by one period. Table 3 provides an overview of the input factors, boundaries, and outputs of the estimated models. We estimate models for the North American and European sample as well as on their merged dataset. We focus on three di↵erent specifications of the CSP model, namely the ES model, the ENV model, and the SOC model. Each variant includes the corresponding Asset4 score as indicated by their name plus control variables. In the merged es- timation, also a region dummy and an interaction term between region and CSP is further considered. The estimation is carried out by utilizing the maximum likelihood method referring to ordered probit models (Venables and Ripley, 2002; McKelvey and Zavoina, 1975). To account for the panel structure, we pool the observations and cluster standard errors on firm level, which is appropriate for short panels. Waldp-values are calculated following
Table 3: This table gives an overview of the estimated model specifications. The CSP Models for isolated estimation of the regions North America and Europe include Asset4 and control variables while the Base Model includes only controls among their independent variables. The boundaries that are required to assign rating classes depending on the linear predictor are output of the regression. The Asset4 score represents either the equal weighted ES rating, the environment, or the social score.
Regional Models Merged
Variable Category Variable Base Model CSP Model CSP Model
CSP Variables Asset4 Score x0 x0
Interaction North America & Asset4 Score x1
Region Variable North America Dummy x2
Control Variables Interest Coverage A x1 x1 x3
Interest Coverage B x2 x2 x4
Interest Coverage C x3 x3 x5
Interest Coverage D x4 x4 x6
Operating Margin x5 x5 x7
Long Term Debt x6 x6 x8
Total Debt x7 x7 x9
Market Capitalisation x8 x8 x10
Beta x9 x9 x11
Idiosyncratic Risk x10 x10 x12
Dividend Payer Dummy x11 x11 x13
Market/Book x12 x12 x14
Retained Earnings x13 x13 x15
Capital Expense x14 x14 x16
Cash Balance x15 x15 x17
Tangibility x16 x16 x18
Gross Domestic Product Growth x17 x17 x19
Dummy for Year 1 x18 x18 x20
(following Years analogue)
Boundaries Lower Boundary for Rating AAA µ6 µ6 µ6
Lower Boundary for Rating AA µ5 µ5 µ5
Lower Boundary for Rating A µ4 µ4 µ4
Lower Boundary for Rating BBB µ3 µ3 µ3
Lower Boundary for Rating BB µ2 µ2 µ2
Lower Boundary for Rating B µ1 µ1 µ1
Output Linear Predictor y⇤ y⇤ y⇤
Rating Class R R R
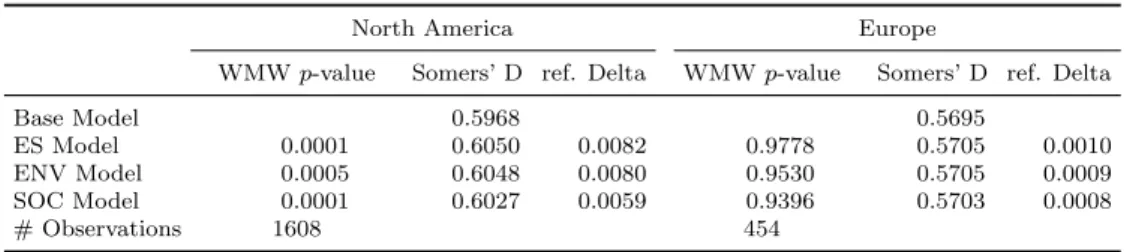
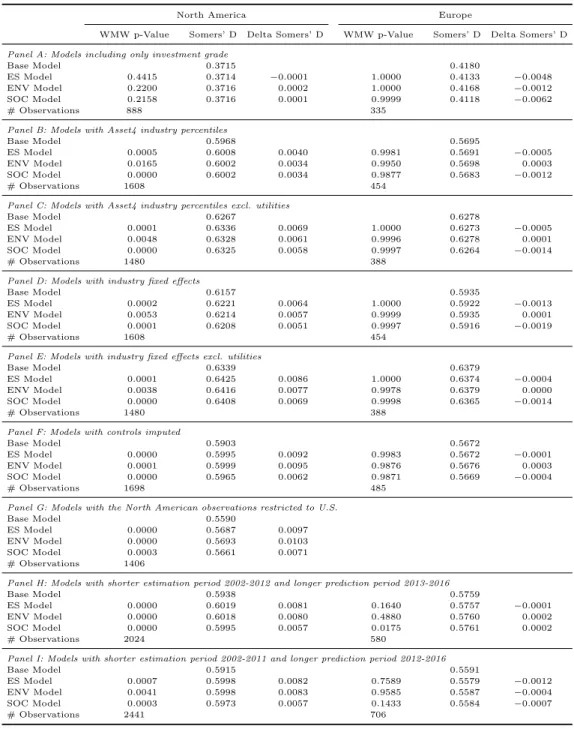
the approach of Huber (1967) to reveal coefficient significance. Moreover, we include estimated thresholds for the various rating levels and the goodness of fit statistics McFadden R2. As the link function in ordered probit mod- els limits the interpretation of the estimated coefficients, we also calculate marginal e↵ects at means to capture the ceteris paribus impact of a marginal change in the ES score on the credit rating prediction. The calculation is based on all independent variables fixed at their means. To computationally derive the marginal e↵ects, we follow Greene (2011).2 One objective of credit portfolio models is to predict future credit ratings appropriately. In order to determine the quality of the credit rating prediction of our model specifica- tions, we calculate the Somers’ D values as a measure of correlation between
2Letxbe the matrix of the independent variables. Then, the marginal e↵ects give an indication of to which extent the probability of a firm being classified to a certain rating classes changes based on the first derivative of the probabilities in Equation (3).
@P(Rit= 1|xi,t 1)
@xi,t 1
= µ1 x0i,t 1
@P(Rit=j|xi,t 1)
@xi,t 1 =h
µj 1 x0i,t 1 (µj x0it )i
,8j2{2,3,4,5,6}
@P(Rit= 7|xi,t 1)
@xi,t 1 = µ6 x0i,t 1
actual and predicted ratings.3 5. Empirical tests
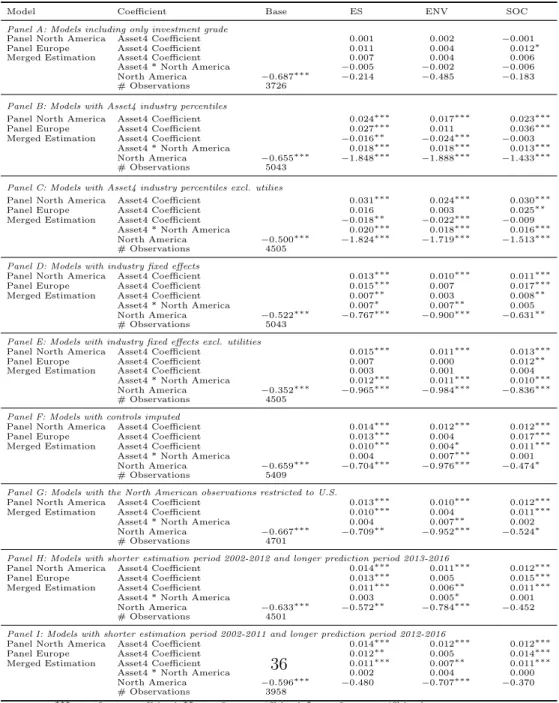
The results of the regional and the merged models are reported in Table 4.
The estimation window for credit ratings in all of these probit models ranges from 2003 to 2013. For the North American sample each of the three CSP measures has a significantly positive coefficient. Thus, all else equal, firms with a high level of CSP in the significant specifications have a higher prob- ability of obtaining better credit ratings than firms with a low level of CSP.
In the European sample only the two specifications of the model with the ES and SOC score manifest a significance of the respective CSP measure at 1% level. The ENV pillar provides no significant explanatory benefit for Eu- rope in contrast to North America. The control variables display reasonable signs in the regressions that are consistent with the findings of the literature displayed in Section 3.2. To rule out the regionally di↵erent relations be- tween CSP and credit ratings, we also provide a merged model of the North American and the European sample with an interaction term between region and CSP. The interpretation of an interaction e↵ect is more difficult as the marginal e↵ect can even be of the opposite sign (Karaca-Mandic et al., 2012;
Ai and Norton, 2003). The results of our merged estimation are consistent
3According to Somers (1962), Somers’ D is a measure of ordinal association. For actual ratingsZ and predicted ratingsY, Newson (2001) define Somers’ D as following:
DY Z = ⌧(Z, Y)
⌧(Z, Z) (4)
with Kendall rank correlation coefficient⌧:
⌧ = NC ND
n(n 1)/2 (5)
Kendall’s⌧ is calculated by taking the di↵erence of the number of concordant pairsNC
and the number of discordant pairsND as well as the sample sizen. Two pairs (zi, yi) and (zj, yj) are called concordant if the ranks of both elements agree, such as zi > zj
and yi > yj or if zi < zj and yi < yj. By contrast, two pairs are determined as being discordant ifzi> zj andyi< yjor ifzi< zjandyi> yj. Somers’ D can take values from 1 (only disagreeing pairs) to +1 (only agreeing pairs). In this context of measuring how predicted and actual credit ratings are associated, the Somers’ D value of +1 expresses the optimal case in which all predictions are actually confirmed.