The social and environmental drivers of corporate credit ratings: international evidence
Gregor Dorfleitner
1 •Johannes Grebler
1Received: 5 May 2020 / Accepted: 8 October 2020 / Published online: 23 December 2020 ÓThe Author(s) 2020
Abstract We provide evidence of the exogenous impact of environmental and social performance components on credit ratings in North America, Europe, and Asia. In particular, the product innovation dimension is clearly identified as being the dominating driver of credit ratings within the environmental performance in every subsample region. In the social performance dimension, the extent of diversity is a main driver for firms in North America and Europe, but due to cultural reasons, not in Asia. Our results show that the risk mitigation view holds for all significant corporate social or environmental performance variables, but the magnitude of impact differs regionally.
Keywords Credit risk Credit ratings Asset4 CSP CSR Sustainability
1 Introduction
We identify the single dimensions of corporate social and environmental performance which have an impact on credit ratings. Our analysis differs from earlier studies through the joint use of more sophisticated and transparent corporate social performance (CSP)
1measures of Asset4, the identification of the affecting CSP components, the regional differentiation in an international dataset (North America, Europe, and Asia), and the use of an instrumental variables approach in
& Gregor Dorfleitner
gregor.dorfleitner@ur.de
1 Department of Finance, University of Regensburg, 93040 Regensburg, Germany
1 The term ’corporate social performance’ (CSP), as usually used in literature, includes both, the social and the environmental dimension (cf. Ioannou and Serafeim2012). For that reason, we refer to CSP in case of the overall CSP performance throughout the paper while referring to either the social or environmental dimension which is denoted as social or environmental performance.
particular that allows us to provide clearer indications of a causal relationship in terms of how CSP components impact credit ratings, as opposed to the common approaches revealing only correlational relationships.
Dorfleitner et al. (2020) find that out-of-sample prediction quality improves by more than 0.8% in their North America sample if environmental and social performance measures are integrated into an established credit risk model.
However, a detailed analysis of the underlying drivers within the social and environmental performance is only available for the USA and suffers from a potential exposure to endogeneity (e.g., Oikonomou et al. 2014) or rather simplistic credit risk modeling (e.g., Attig et al. 2013). Endogeneity, in terms of the reverse causality problem, is crucial to the analysis of the relationship between CSP and credit ratings. On the one hand, CSP is commonly expected to have a positive impact on credit ratings. On the other hand, though, the opposite direction of impact is also conceivable, in the way that firms with better credit ratings save financing costs and are therefore able to increase their spending on CSP. Most studies on this topic use lagged independent variables to deal with the endogeneity problem, which is the first step, but nonetheless appears not to be insufficient. Some (e.g., Bauer et al. 2009; Jiraporn et al. 2014) estimate a two-stage least squares (2SLS) model, which is generally appropriate for reducing endogeneity, but this approach does not meet the standards of current literature on credit risk because credit ratings need to be considered as categorical, and the employed OLS estimation is unable to model this. As a consequence, an international analysis with an adequate credit risk model and a sufficient approach to identify relevant CSP aspects which have a causal impact on credit ratings is still lacking in the literature.
We fill this gap by applying the analysis to both CSP in general and its components in an international dataset including Asset4 CSP measures based on the two-stage predictor substitution (2SPS) with an established credit risk model in the second stage. Asset4 CSP measures are internationally available on a granular level, allowing us to drive our analysis consistently for North America, Europe, and Asia.
The environmental performance comprises measures for emission reduction, product innovation, and resource reduction, while the social performance dimension spans the categories product responsibility, community, human rights, diversity, respectively, equal opportunities, employment quality, health, and training. Asset4 scores are, compared to other providers such as MSCI-KLD, methodologically superior and more transparent (Chatterji and Levine 2006). Concerning established credit risk models, endogeneity can be mitigated through the two-stage predictor substitution (2SPS), which is an implementation of the instrumental variable approach for nonlinear models. In the first stage, we regress the CSP scores on instruments such as the average CSP level of firms located in the same area (Jiraporn et al. 2014) and measures for so-called ‘national business systems’ (NBS) (Whitley 1999) in terms of the political, the labor, education, and the cultural system according to Ioannou and Serafeim (2012) as well as on further control variables.
All instruments have an impact on CSP as shown in the above studies, but obviously
have no direct impact on credit ratings. Hence, they qualify as instruments. Finally,
in the second stage, credit ratings are regressed on the CSP estimate of the first
(1979) and as applied in many studies (e.g., Dimitrov et al. 2015; Baghai et al.
2014; Alp 2013; Jiang et al. 2012; Becker and Milbourn 2011; Blume et al. 1998).
We show that within the environmental performance, the innovation dimension has the most significant impact on credit ratings. This is true for North America, Europe, and Asia. However, the magnitude of the effect differs between these regions. The impact of social performance in North America and Europe is mainly driven by diversity, while no social aspects are relevant for Asia. Our findings are important for real-world decision makers, as they enable the identification of those CSP dimensions that have an impact on credit ratings. As the positive link between selected CSP components and credit ratings indicates a lower default risk of firms with high CSP levels, practitioners may profit from this knowledge through a more precise evaluation of credit risk and the resulting incentives to act. Also, as better credit ratings are associated with lower financing costs, our results help to target investments efficiently, leading to cost savings. Particular investments in environ- mental product innovation are far more impactful than those for emission and resource reduction. Likewise, among the social dimensions, diversity and employ- ment quality are to be prioritized in investment decisions.
The remainder of the paper is organized as follows. We review the related literature and consider theory in Sect. 2. Section 3 describes our international data set and Sect. 4 introduces the employed instumental variable and ordered probit methodology. Sect. 5 presents the empirical results followed by Sect. 6 with robustness tests. Finally, Sect. 7 concludes the paper.
2 Theoretical considerations
A recent stream in literature analyzes the relationship between CSP and credit ratings. Dorfleitner et al. (2020), Stellner et al. (2015), Jiraporn et al. (2014), Oikonomou et al. (2014), Attig et al. (2013), Bauer and Hann (2010), Bauer et al.
(2009) and Frooman et al. (2008) all contribute important insights to the prevailing positive link between CSP and credit ratings. However, the combination of a state of the art credit risk model and an econometrical framework to identify causal relationships rather than simple correlations has not yet been pursued.
In theory, there are two possible relationships between CSP and credit ratings.
The overinvestment view regards CSP as being a waste of scarce resources, but there is little evidence of this perspective. In contrast, the risk mitigation view is based on the idea that sustainable companies face lower risks.
For US firms, Oikonomou et al. (2014), Attig et al. (2013), Bauer and Hann
(2010), and Frooman et al. (2008) find a strong positive link between the KLD
environment score and credit ratings. Dorfleitner et al. (2020) report an improved
prediction quality in their North America sample if they consider environmental
performance in their model. Environmental practices affect the solvency of
borrowing firms by determining their exposure to potentially costly legal,
reputational, and regulatory risks according to Bauer and Hann (2010). Following
the correlation-based evidence of the above-mentioned previous studies, we also
performance on credit ratings. More concretely, we expect at least one of the environmental performance dimensions of emission reduction, resource reduction, and environmental innovation to have a positive impact on credit ratings.
Bauer et al. (2009) have already evidenced a positive relationship between the social pillar of CSP and credit ratings. Dorfleitner et al. (2020) report an improved prediction quality for North America, regarding a model that considers social performance. Through the breakdown into individual components, Attig et al.
(2013) find that KLD social strengths and concerns correlate with credit ratings of US firms and that the individual components of CSP related to primary stakeholder management (i.e., community relations, diversity, and employee relations) matter most in explaining a firm’s creditworthiness. Oikonomou et al. (2014) identify a similar relationship for community, employment, environment, and product safety.
The positive link between CSP components and creditworthiness appears plausible especially for employee relations, as these are associated with greater productivity, higher profitability, higher firm value, and superior shareholder returns (e.g., Huselid 1995; Prennushi et al. 1997; Ichniowski and Shaw 1999; Edmans 2011).
Bauer et al. (2009) argue that employee relations affect bondholders through their influence on firm risk. Thus, firms with sound and competitive employment practices can enhance their capacity to generate higher and more stable cash flows while simultaneously preempting or mitigating the harmful behavior of dissatisfied employees. In contrast, poor employee relations can limit firms’ access to human capital, lead to the exit of valuable employees, increase both litigation and reputation risks, and raise transaction costs. Hence, we also expect a causal impact of (some of) the components of social performance on credit ratings. More narrowly, at least one of the social performance dimensions of product responsi- bility, community, human rights, diversity, employment quality, health, or training performance is expected to have a positive impact on credit ratings.
For the impact of CSP on some types of risk, it was already shown that this relationship varies regionally, e.g., Utz (2018) finds evidence for the risk mitigation view on the impact of CSP on idiosyncratic risk, while the overinvestment view seems to apply in Asia-Pacific. Some previous research on the relationship between CSP and credit ratings is provided for both North America and Europe. Jiraporn et al. (2014) find that the CSP policies of US firms are affected by CSP. Firms with high CSP have better credit ratings, i.e., by 4.5% for a one standard deviation change in the CSP level. In contrast, Stellner et al. (2015) find no relevance of Asset4’s overall CSP rating for credit ratings regarding Europe. Dorfleitner et al.
(2020) also confirm regional deviations between North America and Europe in the explanation and prediction quality of credit ratings through CSP. While social performance is a predictor for credit ratings in both North America and Europe, this is only the case for environmental performance in North America in their setting.
Given there is an impact, we expect the effect of environmental and social
performance categories on credit ratings to differ regionally.
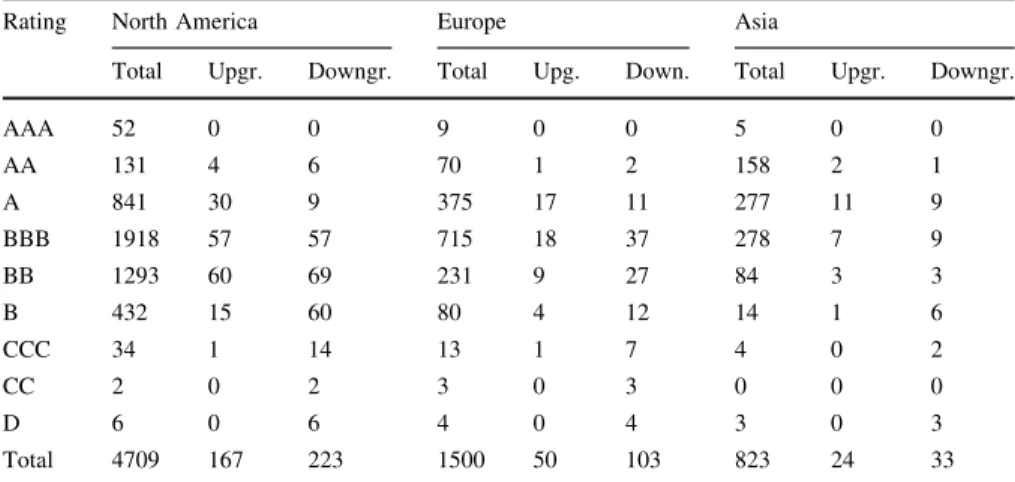
Our sample includes S&P credit ratings, Asset4 CSP measures, and some instrumental and control variables. After excluding financial firms based on the Thomson Reuters Business Classification (TRBC), the final data set encompasses 1212 firms with 7032 firm-year observations. Tables 1 and 2 present descriptive statistics of the credit rating variable, respectively, of the Asset4 scores, the instruments, and the control variables. The regional classification into North America, Europe, and Asia is described in Table 3.
The dependent variable of the second stage regression is the long-term borrower credit rating of S&P. These credit ratings reflect the creditworthiness of a borrower for a time horizon of at least 1 year. The referring rating grades comprise AAA, AA, A, BBB, BB, B, CCC, CC, and D. The default category D is assigned when obligors are overdue for their required payments. Vazza, and Kraemer (2017) provide further information on the rating methodology.
Asset4 publishes annual corporate social and environmental performance scores, which can be interpreted as being external measures for sustainable business models (Ioannou and Serafeim 2012; Chatterji et al. 2016; Humphrey et al. 2012). The scores include information from publicly available sources such as websites, SEC filings such as 10-K, DEF 14A, and 10-Q, sustainability reports, media sources, and NGO reports. The methodology is based on more than 700 questions about the fulfillment of a specific sustainable topic. Each question results in one data point.
These pieces of information are aggregated to categories, which again are condensed to pillars. The approach of Asset4 allows us to overcome weaknesses
Table 1 This table reports on the total number of firms and observations per rating class including the partial quantity of rating upgrades and downgrades compared with the previous period for the entire sample
Rating North America Europe Asia
Total Upgr. Downgr. Total Upg. Down. Total Upgr. Downgr.
AAA 52 0 0 9 0 0 5 0 0
AA 131 4 6 70 1 2 158 2 1
A 841 30 9 375 17 11 277 11 9
BBB 1918 57 57 715 18 37 278 7 9
BB 1293 60 69 231 9 27 84 3 3
B 432 15 60 80 4 12 14 1 6
CCC 34 1 14 13 1 7 4 0 2
CC 2 0 2 3 0 3 0 0 0
D 6 0 6 4 0 4 3 0 3
Total 4709 167 223 1500 50 103 823 24 33
We use S&P long-term borrower credit ratings reflecting the obligor’s creditworthiness over a long-term time horizon (greater than one year)
Table2Thistablereportsthedescriptivestatisticsfortheassetscores,theinstrumentalvariables,andcontrolvariablesinoursamplecoveringtheperiodfrom2002unt 2018 NorthAmericaEuropeAsia MeanSD25%Med.75%MeanSD25%Med.75%MeanSD25%Med.75% CSPvariables CSPscore54.0428.7425.4554.6782.8481.6317.2176.1089.4693.5670.0826.4557.6981.6790.1 Environm.score53.0231.5919.2853.0986.1480.7719.3475.5990.3093.6674.4727.3565.6489.0193.4 Socialscore55.0329.0526.7858.1082.8882.5117.5577.0290.2294.7165.7128.8745.8977.7689.0 Emissionscore52.2831.8418.8152.0386.0081.3519.5278.5490.3393.8474.0427.7260.4088.8993.8 Env.inno.score50.5230.8421.9240.2483.4371.8929.3248.3687.3295.7170.7128.9945.7583.5295.7 Resourcesscore53.5832.1819.6357.5887.2379.3117.9573.1287.5091.9570.8426.7958.3482.8690.8 Prod.resp.score53.3328.1428.4449.7182.4572.1025.4352.3984.1394.0759.6130.3535.0462.2489.5 Comm.score56.3329.2628.9160.0284.2870.3223.6955.1678.9590.4164.8328.2546.7074.2488.6 Hum.rightsscore53.6832.5422.1337.4390.7976.4826.9857.7392.0794.7161.8830.1630.2666.3393.1 Diversityscore54.1928.6924.7952.9684.2475.7424.1361.2088.0894.6163.2234.0123.8983.3092.2 Employm.score53.1229.5123.6754.4182.1174.0723.2058.7884.0593.0652.4428.5826.4152.2680.0 Healthscore53.2229.8326.1849.2484.6775.6823.6156.8987.4296.3258.8929.2731.6061.4688.9 Trainingscore48.9930.4618.4549.5779.8680.0916.4175.0786.4091.8063.3427.7741.5575.0685.7 Instruments £CSPscorea54.014.9652.1555.8256.9981.128.4076.4182.4686.9170.0315.5062.6070.1783.3 £Environm.scorea53.015.1150.3454.5456.6980.309.2174.1881.8086.8374.3917.1670.5577.6588.1 £Socialscorea55.014.9953.9957.1357.3281.948.6777.3083.2787.5965.6614.9159.0465.0378.9 £Emissionscorea 52.285.6149.3353.1855.0880.959.0976.8681.7386.5273.9617.7767.9079.0788.5 £Env.inno.scorea50.533.9049.8051.3853.7471.8513.9059.6973.9382.1770.6417.3362.1772.0783.9 £Resourcesscorea53.575.6650.1855.8057.2978.818.6074.6979.5284.2670.8315.3267.3971.9282.5 £Prod.resp.scorea 53.243.2752.9953.9455.1471.8613.2262.1273.1582.8059.5912.8954.2463.1566.5
Table2continued NorthAmericaEuropeAsia MeanSD25%Med.75%MeanSD25%Med.75%MeanSD25%Med.75% £Comm.scorea56.264.7154.8156.5257.8970.0410.6865.2072.2875.9964.7413.0357.9364.4475.8 £Hum.rightsscorea 53.716.3347.1757.7658.9676.3312.3670.0377.6485.0961.8117.1651.2259.9480.1 £Diversityscorea54.154.1754.1354.7156.7375.4412.2369.8276.5784.1763.2420.5246.2962.7785.6 £Employm.scorea53.077.0153.5555.4456.3873.7110.7069.2475.1580.0452.4114.6137.8049.6366.7 £Healthscorea 53.194.4352.7254.0054.1475.369.7071.3574.8480.8958.8411.9250.0757.6565.7 £Trainingscorea49.045.0146.7551.3052.2979.369.3674.4282.4585.3863.3611.0055.2963.1570.8 Regulatoryframew.17.331.1017.0017.0017.0016.5210.1212.0014.0020.0029.9713.3624.0037.0037.0 Anti-self-dealing0.650.000.650.650.650.500.270.280.380.950.620.200.500.500.58 Corruption0.670.050.680.680.680.840.860.540.540.730.780.860.720.720.72 Politicalorientation94.7328.10103.13103.13103.1326.0543.480.310.3499.7619.8139.970.010.010.01 Uniondensity13.464.8812.0012.0012.0027.0117.6819.5022.2028.8020.665.3919.2019.2020.1 Skilledlabor6.120.106.096.096.096.260.485.786.306.465.130.954.504.506.06 Powerdistance39.920.2740.0040.0040.0044.1214.0735.0035.0057.0059.4210.5954.0054.0068.0 Individualism90.103.0291.0091.0091.0073.8511.8268.0071.0089.0039.4210.4425.0046.0046.0 Controlvariables Interestcoverage11.9719.522.485.5712.209.0414.192.855.279.5423.3529.164.8711.3226.8 Operatingmargin13.618.647.0412.3218.9912.419.045.6410.2316.6610.838.654.667.7614.4 Totaldebt45.5220.7230.5542.9958.1846.6416.8533.4845.9158.3437.5819.2023.0237.0151.9 US$billions20.3446.622.836.5717.4925.9035.814.9411.4631.7220.5029.676.1311.6924.3 Beta0.560.490.150.450.890.550.480.160.440.910.590.480.160.491.00 Idiosyncraticrisk2.031.151.281.812.661.961.151.211.702.471.920.931.241.672.37 Dividendpayer0.710.450.001.001.000.880.331.001.001.000.960.191.001.001.00 Market/Book3.002.221.482.323.742.612.041.252.023.181.680.781.081.482.02
Table2continued NorthAmericaEuropeAsia MeanSD25%Med.75%MeanSD25%Med.75%MeanSD25%Med.75% Retainedearnings0.250.300.060.240.440.190.190.060.180.330.290.160.170.270.39 Capitalexpenditure4.863.032.264.207.214.452.692.263.846.075.402.833.105.147.50 Cashholdings0.110.110.030.070.150.100.080.050.080.130.130.100.060.100.17 Tangibility0.340.260.110.260.550.310.200.130.280.460.350.190.190.320.48 R&D0.020.040.000.000.020.020.030.000.000.020.020.030.000.010.03 GDPgrowth0.020.010.020.020.030.010.020.010.020.020.020.020.010.020.02 N47091500823 a Countryaverage
of the KLD, FTSE4Good, and Dow Jones-rating approaches such as lack of transparency (Chatterji and Levine 2006) as far as possible. Following El Ghoul et al. (2017), we also derive the overall CSP performance from aggregating the environmental and social pillars. The final scores range from zero to 100% with high levels reflecting high CSP. The distribution of Asset4 scores may be skewed as the required information to assign a rating is easier to obtain from larger and high- CSP companies as badly performing firms are unlikely to provide the necessary information. As a consequence, we include size and a large set of further control variables in our models. The data is free from survivorship bias as post- bankruptcies, mergers, and other causes of de-listings are accounted for and the corresponding stocks are retained in the sample. A detailed description of the CSP scores is displayed in Table 4.
Our first instrument for CSP is selected based on the study by Jiraporn et al.
(2014), who ascertain that the CSP policy of surrounding firms to have an impact on firm CSP performance. Thus we apply the average CSP score of all (available) surrounding firms within the same country. Second, a further set on instruments is included, namely the drivers for CSP in terms of ’’national business systems’’ (NBS) according to Whitley (1999), such as the political, labor, education, and the cultural systems. The theoretical NBS category political system is measured with the aid of a regulations index, an anti-self-dealing index, an absence-of-corruption index, and an index for left/center political orientation. The education and labor system is modeled by union density and a skilled labor index while the cultural system involves indices for power distance and individualism. A detailed description of the variables of each NBS category is presented in Table 5.
We add further control variables based on previous research. Following Standard&Poor’s (2013) and Merton (1974), we include the three-year averages of the operating margin, the total debt, and the interest coverage ratios. The interest coverage ratio is transformed as suggested by Blume et al. (1998). We set negative values to zero because these could be due to low interest payments or high negative earnings, while both explanations have a contradictory impact on credit ratings. By assuming decreasing marginal effects for high levels of interest coverage, we cap the three-year average at 100. To model a non-linear shape, we transform the
for our panel selection when analyzing regional differences
Continent Countries Observations Firms
North America Canada, USA 4709 813
Europe Belgium, Switzerland, Germany, Denmark, Spain, Finland, France, Great Britain, Greece, Italy, Netherlands, Norway, Portugal, Sweden
1500 224
Asia Hong Kong, India, Japan, Malaysia, Singapore, Taiwan 823 175
Total 7032 1212
Variable Definition
Emission The emission reduction category measures a company’s management commitment and effectiveness toward reducing environmental emission in the production and operational processes. It reflects a company’s capacity to reduce air emissions (greenhouse gases, F-gases, ozone-depleting substances, NOx and SOx, etc.), waste, hazardous waste, water discharges, spills, or its impacts on biodiversity and to partner environmental organisations to reduce the environmental impact of the company in the local or broader community.
Source: Thomson Reuters Datastream, Mnemonic ENER
Env. inno. The product innovation category measures a company’s management commitment and effectiveness toward supporting the research and development of eco-efficient products or services. It reflects a company’s capacity to reduce the environmental costs and burdens for its customers, thereby creating new market opportunities through new environmental technologies and processes or eco-designed, dematerialized products with extended durability. Source: Thomson Reuters Datastream; Mnemonic ENPI
Resources The resource reduction category measures a company’s management commitment and effectiveness toward achieving an efficient use of natural resources in the production process. It reflects a company’s capacity to reduce the use of materials, energy or water, and to find more eco-efficient solutions by improving supply chain management. Source:
Thomson Reuters Datastream; Mnemonic ENRR
Prod. resp. The customer/product responsibility category measures a company’s management commitment and effectiveness toward creating value-added products and services upholding the customer’s security. It reflects a company’s capacity to maintain its license to operate by producing quality goods and services integrating the customer’s health and safety, and preserving its integrity and privacy, also through accurate product information and labelling. Source: Thomson Reuters Datastream; Mnemonic SOPR
Comm. The community category measures a company’s management commitment and effectiveness toward maintaining the company’s reputation within the general community (local, national, and global). It reflects a company’s capacity to maintain its license to operate by being a good citizen (donations of cash, goods or staff time, etc.), protecting public health (avoidance of industrial accidents, etc.), and respecting business ethics (avoiding bribery and corruption, etc.). Source: Thomson Reuters Datastream; Mnemonic SOCO
Hum. rights The human rights category measures a company’s management commitment and effectiveness towards respecting the fundamental human rights conventions. It reflects a company’s capacity to maintain its license to operate by guaranteeing the freedom of association and excluding child, forced or compulsory labor. Source: Thomson Reuters Datastream; Mnemonic SOHR
Diversity The diversity and opportunity category measures a company’s management commitment and effectiveness towards maintaining diversity and equal opportunities in its workforce. It reflects a company’s capacity to increase its workforce loyalty and productivity by promoting an effective life-work balance, a family friendly environment and equal opportunities regardless of gender, age, ethnicity, religion or sexual orientation. Source:
Thomson Reuters Datastream; Mnemonic SODO
Employm. The employment quality category measures a company’s management commitment and effectiveness towards providing high-quality employment benefits and job conditions. It reflects a company’s capacity to increase its workforce loyalty and productivity by distributing rewarding and fair employment benefits, and by focusing on long-term employment growth and stability by promoting from within, avoiding lay-offs, and maintaining relations with trade unions. Source: Thomson Reuters Datastream; Mnemonic SOEQ
Variable Definition
Health The health & safety category measures a company’s management commitment and effectiveness towards providing a healthy and safe workplace. It reflects a company’s capacity to increase its workforce loyalty and productivity by integrating into its day-to- day operations a concern for the physical and mental health, well-being, and stress level of all employees. Source: Thomson Reuters Datastream; Mnemonic SOHS
Training The training and development category measures a company’s management commitment and effectiveness towards providing training and development (education) for its workforce. It reflects a company’s capacity to increase its intellectual capital, workforce loyalty, and productivity by developing the workforce’s skills, competences,
employability, and careers in an entrepreneurial environment. Source: Thomson Reuters Datastream; Mnemonic SOTD
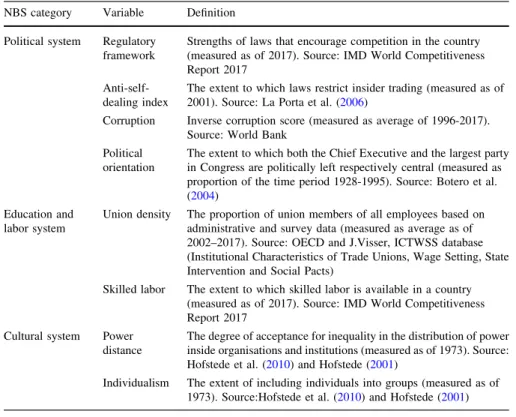
Table 5 This table provides an overview of the NBS categories (Whitley1999) and their variables, which we select as instruments for use during the first stage of our 2SPS regressions based on the work of Ioannou and Serafeim (2012)
NBS category Variable Definition Political system Regulatory
framework
Strengths of laws that encourage competition in the country (measured as of 2017). Source: IMD World Competitiveness Report 2017
Anti-self- dealing index
The extent to which laws restrict insider trading (measured as of 2001). Source: La Porta et al. (2006)
Corruption Inverse corruption score (measured as average of 1996-2017).
Source: World Bank Political
orientation
The extent to which both the Chief Executive and the largest party in Congress are politically left respectively central (measured as proportion of the time period 1928-1995). Source: Botero et al.
(2004) Education and
labor system
Union density The proportion of union members of all employees based on administrative and survey data (measured as average as of 2002–2017). Source: OECD and J.Visser, ICTWSS database (Institutional Characteristics of Trade Unions, Wage Setting, State Intervention and Social Pacts)
Skilled labor The extent to which skilled labor is available in a country (measured as of 2017). Source: IMD World Competitiveness Report 2017
Cultural system Power distance
The degree of acceptance for inequality in the distribution of power inside organisations and institutions (measured as of 1973). Source:
Hofstede et al. (2010) and Hofstede (2001)
Individualism The extent of including individuals into groups (measured as of 1973). Source:Hofstede et al. (2010) and Hofstede (2001)
acording to:
cAit cBit cCit cDit
ifCit2 ½0;5Þ Cit 0 0 0
ifCit2 ½5;10Þ 5 Cit5 0 0
ifCit2 ½10;20Þ 5 5 Cit10 0
ifCit2 ½20;100Þ 5 5 10 Cit20 .
We control for firm size for two reasons. On the one hand, larger companies are less likely to default (Altman et al. 1977). On the other hand, the CSP scores are likely to be skewed with respect to firm size. Referring to Blume et al. (1998), we also control for systematic risk (market model beta) as well as idiosyncratic risk.
The firms’ willingness to pay dividends can also be an indicator of credit risk (Hoberg and Prabhala 2009). Furthermore, firms with a high market-to-book ratio may be less likely to default (Pa´stor and Pietro 2003). Retained earnings are used to proxy a company’s life cycle phase (DeAngelo et al. 2006), whereas established companies tend to have better ratings (Fons 1994). Additionally, capital expenditure has been evidenced to influence credit risk (Tang 2009). We include cash among the controls because firms in distress tend to hold precautionary savings (Acharya et al.
2012). Furthermore, tangibility may have an impact on credit risk (Rampini and Viswanathan 2013). As S&P credit ratings appear to change at least to some extent pro-cyclically, the gross domestic product (GDP) growth rate is employed to model the business cycle. A detailed description of the above control variables is presented in Table 6. Time fixed effects are intended to catch all remaining systematic effects (Elton et al. 2001). Finally, we also control for industry-fixed effects. An overview of industries is delineated in Table 7.
In order to control for multicollinearity, we calculate variance inflation factors (VIF) for overall CSP scores, instruments, and control variables. If necessary, input variables are discarded in a selection process in order to maintain only VIFs below 10 indicating sufficient low exposure to multicollinearity. The variable ’individ- ualism’ is discarded in that process for the combined dataset of all three regions. An estimation based on the full set of instruments is presented in the robustness checks.
4 Methodology
As CSP and credit ratings are likely to be highly endogenous, our analysis is based
on the instrumental variable approach to mitigate the bias due to the endogeneity of
the input variables. Thus in the first stage, we regress the respective CSP factor on
selected instruments and controls. All factors that can explain variation in CSP but
do not affect credit ratings qualify as instruments.
The first stage regression includes the CSP measure x
i;t1as a dependent variable, and instrument variables z
i;t1and controls c
i;t1as explanatory (vectorial) variables with referring coefficients vectors b
zand b
cas described by:
x
i;t1¼ z
0i;t1b
zþ c
0i;t1b
cþ
1;i;t: ð1Þ This estimation is based on OLS. To account for the panel structure of our data, we
them are delivered by Worldscope and Thomson Reuters Datastream Variable Definition
Interest coverage
Earnings before interest and taxes divided by interest expense on debt (3-year averages; floored at 0; capped at 100). To model the nonlinear shape of the interest coverage ratio, the interval of (0–5) is assigned to sub-variable A, (5–10) to sub- variable B, (10–20) to sub-variable C, and (20–100) to sub-variable D. Source:
Thomson Reuters Datastream; Mnemonic WC08291 Operating
margin
The ratio of operating income and net sales or revenues (3-year averages). Source:
Thomson Reuters Datastream; Mnemonics WC08316
Total debt The ratio of long-term plus short-term debt and total capital plus short-term debt (3- year averages). Source: Thomson Reuters Datastream; Mnemonic WC08221 Size The percentile of the market capitalization among those of companies listed at the
New York Stock Exchange (NYSE). Source: Thomson Reuters Datastream;
Mnemonic WC07210 Idiosyncratic
risk
The root mean squared error of a market model estimation based on daily stock and local market index returns within the time horizon of one year if at least 50 observations are available. Source: Thomson Reuters Datastream; Mnemonics X(LI), X(RI)
Beta The systematic risk beta of the market model as described for the calculation of idiosyncratic risk. Source: Thomson Reuters Datastream; Mnemonics X(LI), X(RI) Dividend payer Positive dividends per share indicated by a dummy variable. Source: Thomson
Reuters Datastream; Mnemonic WC05101
Market/Book The ratio of common equity and its balance sheet value. Source: Thomson Reuters Datastream; Mnemonic MTBV
R&D All costs related to the development of new processes, techniques, applications, and products that are intended for commercial exploitation. Missing values are replaced by zero. Source: Thomson Reuters Datastream; Mnemonics WC01201, WC02999 Retained
earnings
The ratio of accumulated earnings after tax that have not been paid as dividends or allocated to allowances and total assets. Source: Thomson Reuters Datastream;
Mnemonics WC03495, WC02999 Capital
expenditures
The ratio of capital expenditures and total assets. Source: Thomson Reuters Datastream; Mnemonics WC08416, WC02999
Cash holdings The ratio of cash plus short-term investments and total assets. Source: Thomson Reuters Datastream; Mnemonics WC02001, WC02999
Tangibility The ratio of net property, plant, and equipment and total assets. Source: Thomson Reuters Datastream; Mnemonics WC02501, WC02999
GDP growth The growth rate of the gross domestic product (GDP) per year. Source: Thomson Reuters Datastream; Mnemonic GDP..D (in combination with the two letter country code)
include time-fixed effects among the controls and clustering of standard errors at the firm level.
The second stage regression is based on a model that was initially introduced by Kaplan and Urwitz (1979) and further developed by (e.g. Blume et al. (1998)). This model is applied in many studies (e.g., Dimitrov et al. 2015; Baghai et al. 2014; Alp 2013; Jiang et al. 2012; Becker and Milbourn 2011). Our threshold model is based on an unobserved linking variable y
it, which represents the creditworthiness of a firm i and year t and calculates
y
it¼ x ^
i;t1b
x^þ c
0i;t1b
cþ
2;i;t; ð2Þ
where x ^
i;t1is the CSP estimate of the first stage and c
i;t1represents the vector of observed explanatory variables of firm i in the year t 1. Accordingly, b
x^is the CSP coefficient while b
cis a vector of coefficients for control variables. The linking variable y
itis continuous and its range comprises the set of real numbers. In our study, we consider nine different levels of credit ratings (i.e., AAA, AA, A, BBB, BB, B, CCC, C, and D). The variable R
itdefines the rating category of firm i and year t. It takes the value 9 if firm i has a rating of AAA, 8 if AA, 7 if A, 6 if BBB, 5 if BB, 4 if B, 3 if CCC, 2 if CC and 1 if D in year t. Thus the first stage of our estimation maps the credit ratings into a partition of the unobserved linking variable y
itas follows:
R
it¼
9 if y
it2 ½l
8; l
9Þ ðAAAÞ 8 if y
it2 ½l
7; l
8Þ ðAAÞ 7 if y
it2 ½l
6; l
7Þ ðAÞ 6 if y
it2 ½l
5; l
6Þ ðBBBÞ 5 if y
it2 ½l
4; l
5Þ ðBBÞ 4 if y
it2 ½l
3; l
4Þ ðBÞ 3 if y
it2 ½l
2; l
3Þ ðCCCÞ 2 if y
it2 ½l
1; l
2Þ ðCCÞ 1 if y
it2 ðl
0; l
1Þ ðDÞ;
8 >
> >
> >
> >
> >
> >
> >
> >
> <
> >
> >
> >
> >
> >
> >
> >
> >
:
ð3Þ
where l
1; . . .; l
8are partition points independent of time t while l
0¼ 1 and l
9¼ 1. Thresholds are not given ex-ante but instead determined in the statistical estimation procedure. The assumption that
itis normally and independently
Reuters Business Classification (TRBC). Financial firms are excluded
Industry Class Observations Industry Class Observations
Basic materials 624 Oil and Gas 569
Consumer goods 1050 Technology 527
Consumer services 1169 Telecommunications 213
Healthcare 539 Utilities 677
Industry 1664 Total 7032
obtain a certain rating (i.e., a realization of R
it) and a realization of the input variables for each company and each year during the observation period.
2The explanatory variables are lagged by one period to model the status of information at the time of prediction. Table 8 provides an overview of the input factors, bound- aries, and outputs of the estimated models.
Following the assumption that
2;i;t;is normally and independently distributed with a mean of 0 and a variance of 1 and given x ^
i;t1and c
i;t1, the probability of assignment to a specific rating class can be calculated according to:
PðR
it¼ jj x ^
i;t1; c
i;t1Þ ¼ Uðl
jx ^
i;t1b
x^þ c
i;t1b
cÞ Uðl
j1x ^
i;t1b
x^þ c
i;t1b
cÞ ð4Þ with j ¼ 1; :::; 9, l
0¼ 1 and l
9¼ 1.
5 Empirical tests
To test our hypotheses, we estimate a total of 13 different model specifications.
Starting with a model of overall CSP, two further models include the environmental or the social pillar respectively. Further models focus on each of the components contained in the pillars, respectively. Concerning environmental performance, we estimate models for emission, environmental innovation, and resources. Referring to social performance, additional models include product responsibility, community, human rights, diversity, employment quality, health, and training. All of these models are estimated on the pooled dataset of North America, Europe, and Asia in two stages based on the 2SPS approach. Each model considers one CSP score as a dependent variable in the first stage regressed on instrumental and control variables.
The corresponding second step includes the credit rating as the dependent variable with both the CSP estimate and the same controls from the first stage as independent variables. The regression results for both stages of all models are presented in Table 9. Moreover, we test for weak instruments in the first stage and report adjusted R
2values as goodness-of-fit measures for both stages of every model.
5.1 The impact of CSP and its components
The first stage regression results for the overall CSP, the environment, and the social model in our pooled sample of North America, Europe, and Asia show that some of our instruments are significant and hence add an important explanation to the CSP scores. The test on weak instruments delivers p values close to zero, implying that
2 The main purpose of lagging the variables is to enable a prediction of credit ratings through a function of explaining variables at the end of yeart1. The specification of a lag of 1 year is frequently used in studies on CSP (e.g., Oikonomou et al.2014; Attig et al.2013), while we cannot find any references for benefits of lags of higher order in the literature (cf., Baghai et al.2014). In the case of our data, which are characterized by short time series in a large cross section, lags of higher order would lower the estimation quality as we would lose a large number of observations. For these reasons, we choose the standard specification of only including a lag of one period.
instruments and control variables to estimate CSP scores as dependent variables. The second stage includes the estimate of the referring CSP score and the same control variables from the first stage with credit ratings as the dependent variable. The estimation results contain also boundaries needed to assign rating classes based on the linear predictor
Dependent variable Stage 1 Stage 2
CSP score Credit rating
CSP variables CSP score estimate x^0
Instruments Country average of CSP score x1
Regulatory framework x2
Anti-self-dealing x3
Corruption x4
Political orientation x5
Union density x6
Skilled labor x7
Power distance x8
Individualism x9
Control variables Interest coverage A x10 x1
Interest coverage B x11 x2
Interest coverage C x12 x3
Interest coverage D x13 x4
Operating margin x14 x5
Total debt x15 x6
Size x16 x7
Beta x17 x8
Idiosyncratic risk x18 x9
Dividend payer dummy x19 x10
Market/Book x20 x11
Retained earnings x21 x12
Capital expenditure x22 x13
Cash holdings x23 x14
Tangibility x24 x15
R&D x25 x16
GDP growth x26 x17
Dummy for North America x27 x18
Dummy for Asia x28 x19
Dummy for year 1 (following years analogue) x29 x20
Boundaries Lower Boundary for rating AAA l8
Lower boundary for rating AA l7
Lower boundary for rating A l6
Lower boundary for rating BBB l5
Lower boundary for rating BB l4
Lower boundary for rating B l3
Lower boundary for rating CCC l2
Lower boundary for rating CC l1
the null hypothesis of weak instruments can be rejected. In the second stage, we find coefficients of overall CSP in all three regions to be positive and significant on a 1%
level. The sign indicates that strong CSP performance tends to be linked to better credit ratings. Thus increases of firm CSP also tend to go along with credit rating improvements. Hence, these results confirm the risk mitigation view. By implementing the argument of Galema et al. (2008) that aggregating multiple categories of CSP may hide confounding effects among the single components of corporate social and environmental performance, we focus on CSP components in the following.
When targeting the environmental category level of Asset4 CSP scores, we find that all environmental categories (emission, environmental innovation, and resources) are relevant. A consideration of the most distinct result regarding environmental innovation raises the question of why conventional control variables such as R&D expenses cannot catch the effect. First, we argue that CSP aims to measure future long-term development while the accounting ratios included in controls represent solely the status quo. Second, CSP also catches intangible assets which are likely not (fully) reflected in accounting ratios. Previous research reveals some reasons for the potential relationship between environmental innovation and firm performance. Environmental innovation may increase efficiency and hence decrease total material cost (Porter and Van der Linde 1995). Additionally, businesses can gain competitive advantages through green product and green process innovation (Chen et al. 2006). Moreover, Kammerer (2009) argues that product innovation also increases the customer benefits and thereby also the demand. Furthermore, a positive impact on the market performance is confirmed by Pujari (2006), including reputation among the potential drivers of this (Eiadat et al.
2008).
Next, we analyze which single categories of the social performance dimension drive the impact on credit ratings. Our findings show a significant positive impact of health and diversity, while the latter is more important in terms of significance. A considerable number of empirical studies identifies a positive relationship between gender diversity in the boardroom and firm performance for North America (Carter et al. 2003; Erhardt et al. 2003; Miller and del Carmen Triana 2009) and European countries (Campbell and Mı´nguez-Vera 2008; Reguera-Alvarado et al. 2017;
Lu¨ckerath-Rovers 2013). A similarly positive relationship can be formulated between gender diversity in management and firm performance if moderated by a firm’s strategic orientation and the organizational culture (Dwyer et al. 2003).
Dependent variable Stage 1 Stage 2
CSP score Credit rating Output CSP score estimate (becomes input for stage 2) x^0
Linear predictor y
Rating class R
Table9Pooledestimation StageOv.CSPEnvironm.Social DependentvariableStage1Stage2Stage1Stage2Stage1Stage2 Ov.CSPCr.rat.Environm.Cr.rat.SocialCr.rat. Coefficients dCSP0.040***0.044***0.032** Intercept31.250**17.87137.630*** DummyNorthAm.11.405***0.52211.419***0.574*12.635***0.354 DummyAsia20.021***1.310***16.589***1.187***24.717***1.309*** CSPcou.av.0.175***0.135*0.162** Regulatoryframework0.222**0.184*0.268*** Antiselfdealing19.017***16.106**21.584*** Corruption1.814**2.048**1.735** Politicalorientation0.101***0.115***0.092*** Uniondensity0.0380.0330.041 Skilledlabor0.0180.9620.542 Powerdistance0.0780.0280.127 Individualism0.000***0.000***0.000***0.000***0.000***0.000*** InterestcoverageA0.707*0.379***0.898**0.389***0.5010.367*** InterestcoverageB0.3830.0290.5350.0190.2360.039 InterestcoverageC0.1260.055***0.0400.051***0.2140.058*** InterestcoverageD0.056*0.0000.0320.0010.082**0.000 Operatingmargin0.456***0.024**0.491***0.028***0.427***0.018* Totaldebt0.128***0.023***0.159***0.025***0.098***0.021*** Size0.915***0.059***0.905***0.056***0.931***0.066*** Beta0.6240.0040.9950.0260.2840.017 Idiosyncraticrisk0.3710.0320.2710.0280.4710.033 Dividendpayer7.836***1.213***9.302***1.118***6.311***1.341*** Market/Book0.1660.079***0.1480.081***0.2010.076*** Retainedearnings9.258***1.529***7.910**1.583***10.841***1.528*** Capitalexpenditure0.3750.044*0.3660.043*0.405*0.046* Cashholdings9.519*1.415**14.188**1.608**5.0201.227* Tangibility15.816***0.43420.065***0.16811.827***0.738
Table9continued StageOv.CSPEnvironm.Social DependentvariableStage1Stage2Stage1Stage2Stage1Stage2 Ov.CSPCr.rat.Environm.Cr.rat.SocialCr.rat. R&D97.620***0.706123.231***2.29172.413***1.079 GDPgrowth173.837***0.774***193.196***3.549***157.392***3.022*** TimedummiesYYYYYY IndustrydummiesYYYYYY Lowerboundaries AAA|AA17.02517.02317.015 AA|A14.75514.75014.748 A|BBB12.08812.08112.085 BBB|BB8.4898.4768.490 BB|B4.7934.7794.796 B|CCC1.0751.0551.085 CCC|CC0.4700.4920.458 CC|D0.8160.8390.805 WeakInstruments0.0000.0000.000 R20.5050.3640.4780.3650.4570.364 N703270327032 StageEmissionEnv.inno.Resources DependentvariableStage1Stage2Stage1Stage2Stage1Stage2 EmissionCr.rat.Env.inno.Cr.rat.ResourcesCr.rat. Coefficients dCSP0.038***0.069***0.038*** Intercept8.6562.3848.752 DummyNorthAm.11.450***0.541*9.530***0.722***12.229***0.415 DummyAsia18.419***1.135***9.784**1.289***18.822***1.128*** CSPcou.av.0.164**0.0940.061 Regulatoryframework0.1020.0760.264***
Table9continued StageEmissionEnv.inno.Resources DependentvariableStage1Stage2Stage1Stage2Stage1Stage2 EmissionCr.rat.Env.inno.Cr.rat.ResourcesCr.rat. Antiselfdealing21.752***1.17415.588** Corruption2.215**1.2621.536 Politicalorientation0.156***0.0480.108*** Uniondensity0.0080.0280.074 Skilledlabor3.287*0.2671.383 Powerdistance0.0130.0290.063 Individualism0.000***0.000***0.000***0.000***0.000***0.000*** InterestcoverageA1.057**0.390***0.1160.355***1.097**0.390*** InterestcoverageB0.2930.0300.876*0.0200.1370.038 InterestcoverageC0.0630.051***0.2830.0300.0720.052*** InterestcoverageD0.0310.0010.0210.0010.0240.001 Operatingmargin0.352***0.020**0.651***0.054***0.370***0.020** Totaldebt0.149***0.024***0.184***0.031***0.110***0.023*** Size0.918***0.061***0.676***0.048***0.877***0.063*** Beta1.2910.0291.0100.0660.5230.000 Idiosyncraticrisk0.1710.0220.3500.0410.1880.024 Dividendpayer8.083***1.209***7.535***1.022***8.870***1.196*** Market/Book0.0180.074***0.582*0.120***0.0260.074*** Retainedearnings8.572***1.627***6.259*1.451***7.445**1.624*** Capitalexpenditure0.3710.044*0.0980.053**0.3480.045* Cashholdings17.673***1.626**7.9061.530**11.881*1.463** Tangibility26.417***0.0144.6450.787**18.477***0.364 R&D92.413***0.504178.260***9.441***90.222***0.260 GDPgrowth148.760***1.134***189.804***9.472***134.427***0.769*** TimedummiesYYYYYY IndustrydummiesYYYYYY Lowerboundaries AAA|AA16.87617.72317.217 AA|A14.60115.44714.947
Table9continued StageEmissionEnv.inno.Resources DependentvariableStage1Stage2Stage1Stage2Stage1Stage2 EmissionCr.rat.Env.inno.Cr.rat.ResourcesCr.rat. A|BBB11.92712.77612.280 BBB|BB8.3209.1738.680 BB|B4.6185.4744.984 B|CCC0.8931.7481.266 CCC|CC0.6560.1990.281 CC|D1.0030.1470.627 WeakInstruments0.0000.1000.000 R20.4760.3650.3860.3650.4010.364 N703270327032 StageProd.resp.Comm.Hum.rightsDiversity DependentvariableStage1Stage2Stage1Stage2Stage1Stage2Stage1Stage2 Prod.resp.Cr.rat.Comm.Cr.rat.Hum.rightsCr.rat.DiversityCr.rat. Coefficients dCSP0.0150.0200.0160.046*** Intercept28.154*30.982**10.84413.486 DummyNorthAm.14.028***0.0673.537*0.14312.531***0.01310.763***0.380 DummyAsia28.248***0.910***14.870***0.852***23.288***0.996**24.244***1.369*** CSPcou.av.0.0830.0990.151**0.114* Regulatoryframework0.524***0.262***0.502***0.194 Antiselfdealing6.10238.338***3.99513.312** Corruption2.591**1.0532.573*0.647 Politicalorientation0.0000.153***0.0030.093** Uniondensity0.1240.0970.207**0.064 Skilledlabor0.4570.6040.7725.429** Powerdistance0.464***0.0970.1130.016
Table9continued StageProd.resp.Comm.Hum.rightsDiversity DependentvariableStage1Stage2Stage1Stage2Stage1Stage2Stage1Stage2 Prod.resp.Cr.rat.Comm.Cr.rat.Hum.rightsCr.rat.DiversityCr.rat. Individualism0.000***0.000***0.000***0.000***0.000***0.000***0.000***0.000*** InterestcoverageA0.2410.347***0.3230.359***0.5040.358***0.826**0.386*** InterestcoverageB0.2190.0430.2600.0420.6870.0340.700*0.008 InterestcoverageC0.0610.052***0.3210.057***0.2710.054***0.372*0.064*** InterestcoverageD0.0070.0020.058*0.0010.0430.0020.099***0.002 Operatingmargin0.407***0.0120.340***0.0110.497***0.0140.276***0.021** Totaldebt0.0150.018***0.0570.019***0.098**0.020***0.111***0.025*** Size0.352***0.090***0.777***0.080***0.666***0.084***0.877***0.055*** Beta0.1060.0220.5280.0211.0360.0430.7440.009 Idiosyncraticrisk0.1100.0190.1700.0230.5850.0290.3170.028 Dividendpayer2.765*1.522***7.476***1.387***7.618***1.438***4.378***1.335*** Market/Book0.518*0.064**0.0930.066**0.5070.078***0.1260.085*** Retainedearnings7.716**1.699***9.854***1.656***15.001***1.570***7.068**1.580*** Capitalexpenditure0.1270.059**0.3300.051**0.1060.057**0.794***0.024 Cashholdings6.6250.9816.1901.196*8.3231.171*6.9411.248** Tangibility1.2401.210***10.940**0.877**4.9341.231***11.267**0.564 R&D65.165**2.37926.9052.80986.311***1.78072.942***0.422 GDPgrowth56.1327.453***149.072***6.073***35.1917.954***167.035***7.052*** TimedummiesYYYYYYYY IndustrydummiesYYYYYYYY Lowerboundaries AAA|AA17.77616.92317.49616.948 AA|A15.51114.65615.23114.673 A|BBB12.85011.99112.56911.998 BBB|BB9.2608.4018.9828.393 BB|B5.5654.7085.2884.683 B|CCC1.8591.0001.5820.953 CCC|CC0.3140.5420.0370.604 CC|D0.0320.8880.3100.952
Table9continued StageProd.resp.Comm.Hum.rightsDiversity DependentvariableStage1Stage2Stage1Stage2Stage1Stage2Stage1Stage2 Prod.resp.Cr.rat.Comm.Cr.rat.Hum.rightsCr.rat.DiversityCr.rat. WeakInstruments0.0000.0000.0000.000 R20.2380.3630.2850.3630.3240.3630.3700.365 N7032703270327032 StageEmploym.HealthTraining DependentvariableStage1Stage2Stage1Stage2Stage1Stage2 Employm.Cr.rat.HealthCr.rat.TrainingCr.rat. Coefficients dCSP0.0170.033*0.011 Intercept76.749***2.77817.999 DummyNorthAm.9.913***0.581*12.081***0.31623.028***0.001 DummyAsia18.272***0.32623.882***1.323***23.953***0.903** CSPcou.av.0.184***0.0620.020 Regulatoryframework0.1640.1240.192** Antiselfdealing21.630***20.287***13.702* Corruption0.9950.1401.126 Politicalorientation0.065*0.102***0.063* Uniondensity0.0240.0200.029 Skilledlabor6.132***1.2352.033 Powerdistance0.0850.1870.196** Individualism0.000***0.000***0.000***0.000***0.000***0.000*** InterestcoverageA0.2930.347***0.2710.363***1.085**0.365*** InterestcoverageB0.5280.0340.2820.0560.3670.043 InterestcoverageC0.1270.047**0.0380.051***0.0520.050*** InterestcoverageD0.089**0.0040.082*0.0000.0460.002 Operatingmargin0.128*0.0050.251***0.0120.386***0.009
Table9continued StageEmploym.HealthTraining DependentvariableStage1Stage2Stage1Stage2Stage1Stage2 Employm.Cr.rat.HealthCr.rat.TrainingCr.rat. Totaldebt0.0400.018***0.117***0.022***0.104***0.019*** Size0.756***0.107***0.676***0.073***0.823***0.086*** Beta2.051*0.0630.9670.0050.1260.028 Idiosyncraticrisk0.2070.0250.5980.0400.4820.027 Dividendpayer3.084**1.626***6.305***1.337***1.9961.538*** Market/Book0.1700.068**0.3420.079***0.3340.073*** Retainedearnings11.719***1.974***3.0741.773***10.796***1.689*** Capitalexpenditure0.2150.063**0.2900.049**0.3060.056** Cashholdings0.3651.0327.9661.385**5.7981.163* Tangibility11.018***1.383***17.985***0.54511.297**1.044** R&D26.7413.51780.501***0.91828.1293.074 GDPgrowth187.798***11.729***98.888**7.766***72.218*9.344*** TimedummiesYYYYY IndustrydummiesYYYYY Lowerboundaries AAA|AA17.28517.35217.172 AA|A15.01815.08714.907 A|BBB12.35312.42412.245 BBB|BB8.7688.8308.659 BB|B5.0675.1374.966 B|CCC1.3631.4321.264 CCC|CC0.1840.1070.278 CC|D0.5320.4540.624 WeakInstruments0.0000.0020.001 R20.3090.3630.3290.3630.3590.363 N703270327032 ThistabledisplaystheestimationresultsofbothstagesoftheinstrumentalvariableapproachforeachCSPimpactscore.Coefficientsofallvariablesaredisplay includingthesignificancelevelmarkedbyasterisks.Theyareconsideredsignificantonthelevelof1%(***),5%(**)or10%(*)whenthepvalueisbelowtheselevels. ThelowerboundariesoftheratingcategoriesaccordingtoSect.4arealsodisplayed
are less widespread. Possible explanations include the conjecture that diversity may help in decision processes by introducing other perspectives and information and additionally a different assessment of risk (Gul et al. 2011). Moreover, a diverse mindset within firms helps to catch up with business and society trends of the customer base and attract talented personnel (Li and Chen 2018).
5.2 The region matters
Tables 10, 11 and 12 show the second stage results for separate estimations on the panels of North America, Europe, and Asia.
3When focusing on North America, we find all dimensions (emission, environmental innovation, resources, product responsibility, community, human rights, diversity, employment quality, health, and training) to be positively significant. Concerning Europe, we find the dimensions environmental innovation and diversity to be significantly positively related to credit ratings. The measures community and training are weakly significant on a 10% level and the first reveals a negative sign. Coefficients in the Asia subsample are significant in the dimensions of emission, environmental innovation, and resources. Among the social categories, no dimension is significant.
Except for the community category in Europe, all significant CSP coefficients show positive signs indicating the positive link between the referring CSP scores and credit ratings. Our results once more generally support the risk mitigation view.
As the link function in our model limits the interpretability of the CSP impact, marginal effects (at means of the controls) according to Greene (2011) are calculated. In the Tables 18, 19 20, one can observe the practical implications of our results. Predominantly, we see increases of the probability to obtain a better rating class if the CSP score is significant and is increased by 1% point (ceteris paribus).
At the same time, the probability to obtain a worse rating class decreases. For example, the probability of an actual BBB rated North American counterparty to upgrade to an A rating increases by 0.43% points if the overall CSP score increases by 1% point under otherwise identical circumstances, while the probability of a downgrade to BBB decreases by 0.48%.
In general, we support the argumentation of Attig et al. (2013) that CSP helps to generate intangible assets such as reputation and relationships with stakeholders, which again improve a firm’s competitiveness (Orlitzky et al. 2003). This may explain the relevance of all CSP scores in North America. The same argumentation may apply also for Europe. However, besides environmental innovation and diversity no further CSP component is significant on the 1% level, which is likely caused by the comparably high mean levels and low variation of CSP of European firms. For example, emission exhibits a higher mean of 81.3% and a lower standard deviation of 19.5% when compared to the mean (52.3%) and standard deviation (31.8%) of North American companies. As a result, European firms can differentiate less from each other through emission reduction. In contrast, environmental innovation shows a higher standard deviation (29.3%) and turns out to be
3 Referring first stage estimation results are presented in Tables13,14and15.
Table10PanelNorthAmerica Ov.CSPEnvironm.SocialEmissionEnv.inno.ResourcesProd.resp. Coefficients dCSP0.039**0.036**0.042**0.030**0.079***0.037**0.076** CSRcountryaverage0.000***0.000***0.000***0.000***0.000***0.000***0.000*** InterestcoverageA0.362***0.364***0.359***0.357***0.327***0.378***0.308*** InterestcoverageB0.0020.0070.0040.0030.0390.0060.040 InterestcoverageC0.070***0.062***0.078***0.066***0.0240.065***0.086*** InterestcoverageD0.0020.0010.0040.0020.0000.0010.001 Operatingmargin0.030**0.029**0.030**0.023**0.057***0.026**0.043** Totaldebt0.024***0.025***0.023***0.024***0.035***0.023***0.022*** Size0.054***0.057***0.051**0.062***0.043***0.056***0.061*** Beta0.0230.0050.0420.0070.0470.0140.111 Idiosyncraticrisk0.0550.0650.0450.0700.0540.0610.086 Dividendpayer1.259***1.228***1.300***1.317***0.929***1.247***1.349*** Market/Book0.075**0.074**0.078**0.068**0.098***0.073**0.074** Retainedearnings1.627***1.726***1.511***1.788***1.493***1.710***1.458*** Capitalexpenditure0.0430.0440.0420.0440.056*0.0440.064** Cashholdings1.446*1.586**1.292*1.744**1.682**1.485*0.557 Tangibility0.0120.1480.1510.2380.3150.1251.218** R&D2.8423.3212.2631.61210.330***2.6584.475 TimedummiesYYYYYYY IndustrydummiesYYYYYYY Lowerboundaries AAA|AA15.34615.38615.30115.30615.76215.71318.829 AA|A13.81513.85513.77013.77414.23114.18217.298 A|BBB11.06011.10011.01511.02011.47611.42814.544 BBB|BB7.4997.5397.4547.4587.9157.86610.982 BB|B3.6823.7213.6373.6414.0974.0497.165 B|CCC0.4650.4260.5100.5060.0500.0983.018 CCC|CC2.3332.2932.3782.3741.9181.9661.150 CC|D2.6362.5962.6812.6782.2212.2690.847 Weakinstruments0.0000.0000.0000.0000.0600.0000.003
Table10continued Ov.CSPEnvironm.SocialEmissionEnv.inno.ResourcesProd.resp. R20.3700.3700.3700.3700.3700.3700.370 N4709470947094709470947094709 Comm.Hum.rightsDiversityEmploym.HealthTraining Coefficients dCSP0.034**0.088***0.067**0.044**0.050**0.063** CSRcountryaverage0.000***0.000***0.000***0.000***0.000***0.000*** InterestcoverageA0.337***0.359***0.404***0.351***0.342***0.418*** InterestcoverageB0.0060.0310.0270.0370.0600.011 InterestcoverageC0.076***0.073***0.102***0.075***0.050**0.068*** InterestcoverageD0.0020.0020.0080.0040.0020.004 Operatingmargin0.024**0.053***0.026**0.017*0.026**0.041** Totaldebt0.021***0.029***0.027***0.020***0.024***0.025*** Size0.064***0.034**0.0340.057***0.056***0.036 Beta0.0310.0970.0100.0190.0050.047 Idiosyncraticrisk0.0660.0380.0260.0700.0210.036 Dividendpayer1.333***0.825***1.211***1.473***1.224***1.474*** Market/Book0.065**0.132***0.059*0.073**0.081***0.082*** Retainedearnings1.639***0.820**1.446***1.407***1.848***1.185** Capitalexpenditure0.0460.079**0.0000.056*0.0440.019 Cashholdings1.1961.845**1.670**1.224*1.600**1.433* Tangibility0.1951.089**0.0170.2580.2430.440 R&D0.2867.665***3.4770.6622.5841.125 TimedummiesYYYYYY IndustrydummiesYYYYYY Lowerboundaries AAA|AA15.76717.25214.78414.92715.96115.390 AA|A14.23615.72113.25313.39614.43013.858 A|BBB11.48112.96610.49810.64211.67511.104 BBB|BB7.9209.4056.9377.0808.1147.542 BB|B4.1035.5883.1193.2634.2963.725
Table10continued Comm.Hum.rightsDiversityEmploym.HealthTraining B|CCC0.0441.4401.0280.8840.1490.422 CCC|CC1.9120.4272.8962.7521.7192.290 CC|D2.2150.7303.1993.0552.0222.593 Weakinstruments0.0000.1150.0080.0000.0000.021 R20.3700.3700.3700.3700.3700.370 N470947094709470947094709 ThistabledisplaystheestimationresultsofthesecondstageoftheinstrumentalvariableapproachforeachCSPimpactscoreintheNorthAmericasample.Coefficients allvariablesaredisplayedincludingthesignificancelevelmarkedbyasterisks.Theyareregardedasbeingsignificantonthelevelof1%(***),5%(**)or10%(*)when thepvalueisbelowtheselevels.ThelowerboundariesoftheratingcategoriesaccordingtoSect.4arealsodisplayed Table11PanelEurope Ov.CSPEnvironm.SocialEmissionEnv.inno.ResourcesProd.resp. Coefficients dCSP0.0590.078**0.0170.0420.061***0.0200.016 InterestcoverageA0.422***0.424***0.423***0.446***0.417***0.419***0.412*** InterestcoverageB0.152**0.1230.163**0.145*0.0980.164**0.186** InterestcoverageC0.0480.0420.0540.0510.0320.0490.051 InterestcoverageD0.0000.0000.0000.0000.0000.0010.000 Operatingmargin0.0270.046**0.0090.0200.058***0.0110.011 Totaldebt0.014*0.013*0.016**0.015*0.016**0.016**0.015** Size0.071**0.060**0.096***0.082***0.059***0.096***0.099*** Beta0.1170.1650.0780.1290.1940.0760.082 Idiosyncraticrisk0.241**0.269**0.235**0.252**0.274***0.239**0.237** Dividendpayer1.210***1.166***1.257***1.262***1.307***1.248***1.311*** Market/Book0.134***0.139***0.142***0.130**0.189***0.144***0.123**
Table11continued Ov.CSPEnvironm.SocialEmissionEnv.inno.ResourcesProd.resp. Retainedearnings0.8610.9280.7790.6331.0230.8360.813 Capitalexpenditure0.0170.0220.0090.0060.0530.0030.006 Cashholdings0.3680.1281.1480.9540.1641.0201.389 Tangibility0.5150.9920.0780.6020.6380.0450.068 R&D7.1462.93110.0067.2946.141***9.82110.557 GDPgrowth10.269***15.221***3.043***5.682***12.380***4.282***3.332*** TimedummiesYYYYYYY IndustrydummiesYYYYYYY Lowerboundaries AAA|AA22.22622.89220.78821.76921.08121.03021.069 AA|A19.36720.02717.94318.92218.21218.18918.220 A|BBB16.13116.78914.70815.69314.95114.95514.980 BBB|BB11.79312.43210.38311.35610.55910.63010.649 BB|B8.2898.9126.8847.8497.0177.1257.141 B|CCC4.8765.4743.4884.4483.5353.7273.736 CCC|CC3.5854.1862.1923.1592.2342.4332.436 CC|D2.9823.5871.5852.5541.6361.8271.832 Weakinstruments0.1600.3100.1120.3600.0090.1400.000 R20.3920.3940.3920.3920.3980.3920.392 N1500150015001500150015001500 Comm.Hum.rightsDiversityEmploym.HealthTraining Coefficients dCSP0.040*0.0410.078***0.0010.0040.067* InterestcoverageA0.426***0.398***0.424***0.424***0.423***0.453*** InterestcoverageB0.157**0.160**0.1160.160**0.160**0.147* InterestcoverageC0.0430.0590.0590.0550.0540.027 InterestcoverageD0.0010.0040.0040.0010.0010.003 Operatingmargin0.0020.0120.029*0.0040.0040.012 Totaldebt0.021***0.024***0.018**0.017**0.017**0.014* Size0.121***0.130***0.051**0.105***0.103***0.078***
Table11continued Comm.Hum.rightsDiversityEmploym.HealthTraining Beta0.0870.1510.1100.0670.0680.124 Idiosyncraticrisk0.254**0.202*0.1690.242**0.238**0.257** Dividendpayer1.550***1.351***1.142***1.282***1.289***1.285*** Market/Book0.188***0.170***0.162***0.148***0.150***0.182*** Retainedearnings0.7311.1651.0640.7580.7720.894 Capitalexpenditure0.0130.0260.0620.0040.0040.007 Cashholdings2.821*2.4600.6691.4321.3850.398 Tangibility0.1750.0951.0920.0550.0250.421 R&D8.42511.1905.07410.1839.76410.710 GDPgrowth1.434***1.934***17.233***0.7801.244*9.929*** TimedummiesYYYYYY IndustrydummiesYYYYYY Lowerboundaries AAA|AA19.28118.45821.23520.21020.32923.701 AA|A16.44215.62418.37817.37317.49020.843 A|BBB13.20312.37515.10214.13814.25617.596 BBB|BB8.8528.04110.7149.8139.93013.247 BB|B5.3154.5377.2136.3116.4289.747 B|CCC1.8891.1233.7402.9163.0356.279 CCC|CC0.5910.1932.3891.6191.7404.960 CC|D0.0110.8041.7721.0121.1334.355 Weakinstruments0.0020.0900.0370.4220.0040.000 R20.3940.3930.3970.3910.3910.394 N150015001500150015001500 ThistabledisplaystheestimationresultsofthesecondstageoftheinstrumentalvariableapproachforeachCSPimpactscoreintheEuropesample.Coefficientsof variablesaredisplayedincludingthesignificancelevelmarkedbyasterisks.Theyareregardedasbeingsignificantonthelevelof1%(***),5%(**)or10%(*)when pvalueisbelowtheselevels.ThelowerboundariesoftheratingcategoriesaccordingtoSect.4arealsodisplayed
Table12PanelAsia Ov.CSPEnvironm.SocialEmissionEnv.inno.ResourcesProd.resp. Coefficients dCSP0.0280.024*0.0250.0170.065***0.0190.020 CSRcountryaverage InterestcoverageA0.369**0.385***0.361**0.386***0.312**0.406***0.374** InterestcoverageB0.0320.0260.0260.0000.0860.0160.012 InterestcoverageC0.0490.0530.0430.0450.078**0.0470.041 InterestcoverageD0.0040.0030.0040.0020.0040.0030.000 Operatingmargin0.0040.0020.0050.0000.0240.0010.007 Totaldebt0.056***0.057***0.054***0.054***0.061***0.056***0.046*** Size0.117***0.121***0.117***0.129***0.090***0.125***0.140*** Beta0.0290.0210.0460.0320.0250.0520.026 Idiosyncraticrisk0.1350.1170.1480.1090.1850.1040.122 Dividendpayer2.500*2.502*2.503*2.611*2.4042.465*2.648* Market/Book0.677***0.671***0.702***0.679***0.533***0.724***0.781*** Retainedearnings3.312**3.182**3.370**2.948**4.203***3.144**3.194** Capitalexpenditure0.160***0.159***0.159***0.157***0.198***0.152***0.155*** Cashholdings2.7172.9912.3852.7273.492*2.7992.087 Tangibility4.848***4.801***4.895***4.718***5.445***4.776***4.526*** R&D1.791***2.175***0.1460.433***17.725***0.2040.292 GDPgrowth30.499***26.679***35.914***29.986***2.610***32.930***35.913** TimedummiesYYYYYYY IndustrydummiesYYYYYYY Lowerboundaries AAA|AA19.94220.43519.57920.68220.52120.31721.392 AA|A15.07815.57314.71415.82115.62815.46016.514 A|BBB11.90412.40111.53712.64912.42512.29013.331 BBB|BB7.9558.4557.5918.7028.4868.3479.382 BB|B4.2804.7843.9265.0294.8314.6855.725 B|CCC1.2181.7090.8941.9601.7791.6072.767 CCC|CC0.8610.3801.1660.1250.2640.4810.698 CC|D0.8620.3801.1660.1260.2640.4810.698
Table12continued Ov.CSPEnvironm.SocialEmissionEnv.inno.ResourcesProd.resp. Weakinstruments0.0010.0020.0060.0000.1240.0060.000 R20.4070.4070.4070.4070.4090.4070.408 N823823823823823823823 Comm.Hum.rightsDiversityEmploym.HealthTraining Coefficients dCSP0.0140.0160.0240.0110.0180.010 CSRcountryaverage InterestcoverageA0.398***0.423***0.376**0.411***0.379**0.427*** InterestcoverageB0.0030.0210.0110.0340.0100.042 InterestcoverageC0.0440.0500.0380.0420.0580.038 InterestcoverageD0.0020.0040.0070.0010.0060.000 Operatingmargin0.0000.0070.0110.0030.0040.001 Totaldebt0.051***0.053***0.057***0.051***0.050***0.046*** Size0.130***0.130***0.115***0.149***0.130***0.150*** Beta0.0560.1060.0680.1370.0510.049 Idiosyncraticrisk0.1280.1150.0980.0900.1260.080 Dividendpayer2.511*2.3032.679*2.542*2.3372.507* Market/Book0.711***0.740***0.662***0.773***0.762***0.785*** Retainedearnings3.151**3.101**3.186**2.6883.146**2.836** Capitalexpenditure0.159***0.145**0.151***0.156**0.150**0.140** Cashholdings2.6722.2002.2842.7642.6362.469 Tangibility4.944***5.002***4.712***4.682***4.276***4.751*** R&D3.3021.2620.8884.6122.8965.215 GDPgrowth37.023***33.464***31.486***36.219***37.608***36.836** TimedummiesYYYYYY IndustrydummiesYYYYYY Lowerboundaries
Table12continued Comm.Hum.rightsDiversityEmploym.HealthTraining AAA|AA20.34320.40519.54320.77320.07021.061 AA|A15.48515.54114.68115.91915.21116.202 A|BBB12.31212.36611.50912.74712.03213.025 BBB|BB8.3698.4277.5298.8108.0999.098 BB|B4.7134.7683.8165.1694.4635.466 B|CCC1.6681.6900.7212.0871.4442.389 CCC|CC0.3940.3971.3870.0120.5940.326 CC|D0.3960.3981.3870.0120.5960.326 Weakinstruments0.0000.0000.0000.1300.0060.080 R20.4070.4070.4090.4060.4060.406 N823823823823823823 ThistabledisplaystheestimationresultsofthesecondstageoftheinstrumentalvariableapproachforeachCSPimpactscoreintheAsiasample.Coefficientsof variablesaredisplayedincludingthesignificancelevelmarkedbyasterisks.Theyareregardedasbeingsignificantonthelevelof1%(***),5%(**)or10%(*)when pvalueisbelowtheselevels.ThelowerboundariesoftheratingcategoriesaccordingtoSect.4arealsodisplayed
Table13FirststagepanelNorthAmerica Ov.CSPEnvironm.SocialEmissionEnv.inno.ResourcesProd.resp. Coefficients Intercept23.276***23.946***22.884***31.443***6.29914.551**33.676** Politicalorientation0.149***0.160***0.139***0.192***0.074*0.156***0.076*** InterestcoverageA0.939**1.060*0.804*1.032*0.0151.410**0.226 InterestcoverageB0.1470.2970.0090.0320.5500.0510.567 InterestcoverageC0.1040.0960.2980.0110.524*0.0110.274 InterestcoverageD0.0410.0070.074*0.0240.0100.0010.005 Operatingmargin0.504***0.535***0.482***0.429***0.600***0.436***0.435*** Totaldebt0.152***0.187***0.118***0.189***0.217***0.126***0.053 Size1.028***1.016***1.046***1.056***0.648***1.014***0.435*** Beta0.3790.8910.1071.0311.0800.6450.959 Idiosyncraticrisk0.5150.2990.7300.1700.2740.4010.140 Dividendpayer8.395***9.890***6.879***8.944***8.380***9.117***3.119* Market/Book0.2130.1820.2610.0140.3900.1670.084 Retainedearnings10.940***9.047**13.040***8.833**7.150*9.240***7.817** Capitalexpenditure0.616**0.638*0.608**0.758**0.1360.622*0.043 Cashholdings7.95012.3793.75620.125**6.9509.3627.573 Tangibility19.869***25.111***14.714***33.177***5.73123.839***5.916 R&D98.526***119.169***78.435**86.700**144.280***98.253***71.776** GDPgrowth0.000***0.000***0.000***0.000***0.000***0.000***0.000*** TimedummiesYYYYYYY IndustrydummiesYYYYYYY Weakinstruments0.0000.0000.0000.0000.0600.0000.003 R20.4480.4130.4100.4180.3140.3520.214 N4709470947094709470947094709 Comm.Hum.rightsDiversityEmploym.HealthTraining Coefficients Intercept14.295**11.33521.880***30.079***5.95113.753**